Bone and Soft-Tissue Tumors
Miriam A. Bredella
David W. Stoller
James O. Johnston
The superior contrast discrimination provided by magnetic resonance (MR) imaging has proved extremely valuable in the assessment of bone and soft-tissue tumors.1,2,3,4,5,6,7,8,9,10,11,12,13,14,15,16,17 T1 and T2 relaxation times are prolonged in a variety of malignant tissue types; therefore, malignant change tends to demonstrate low to intermediate signal intensity on T1-weighted images and high signal intensity on T2-weighted images. Although computed tomography (CT) may provide superior cortical detail, MR imaging is much more sensitive to marrow involvement by edema or tumor and provides soft-tissue definition of the surrounding musculature, fascial planes, and neurovascular bundles without artifact from cortical bone.
Imaging Techniques
Conventional radiographs remain the initial imaging examination in evaluating bone and some soft-tissue tumors and are almost invariably the most diagnostic. Although other imaging modalities such as MR imaging are superior to radiographs in staging musculoskeletal neoplasms, radiographs remain the best modality for establishing a diagnosis and assessing the activity (benign or aggressive) of a lesion.18,19
Pearls and Pitfalls
Imaging Techniques
Radiographs are essential for evaluating bone tumors and some soft-tissue tumors.
MR imaging features are usually nonspecific in differentiating benign from malignant processes.
MR imaging is important in the evaluation of tumor extent, staging, and response to therapy.
Gadolinium administration is useful in the evaluation of nonenhancing necrotic or hemorrhagic tumor components.
For MR imaging, a combination of both T1 and T2 weighting, fat-suppressed T2-weighted or proton density-weighted fast spin-echo, or gradient-echo techniques is essential in the evaluation of musculoskeletal neoplasms. With short TI inversion recovery (STIR) imaging sequences, T1 and T2 contrast are additive.20,21
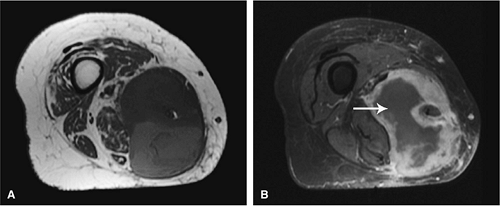 FIGURE 14-1 ● T1-weighted images (A) before and (B) after intravenous gadolinium administration show malignant fibrous histiocytoma. The tumor enhances after intravenous injection of gadolinium. Central tumor necrosis remains unenhanced (arrow). |
The MR protocols most useful in tumor imaging include the following:
T1-weighted images provide excellent contrast for identification of marrow, cortical, and soft-tissue involvement. In particular, T1-weighted images allow differentiation between fat and tumor, as well as definition of muscle planes and separate anatomic compartments.
Gadolinium has been used to enhance contrast on T1-weighted images to better characterize osseous and soft-tissue tumor involvement.2,7,15,22,23,24 On gadolinium-enhanced images, nonenhancing regions are thought to represent areas of nonviable tumor or necrosis (Fig. 14-1). Gadolinium-enhanced images may also be useful for differentiating peritumoral edema from underlying tumor and recurrent tumor from scar or fibrosis.25
Dynamic contrast-enhanced MR imaging has been used to determine response to chemotherapy. In patients who respond to chemotherapy, MR images show a reduction in enhancement, whereas patients who do not respond show little or no reduction. Dynamic contrast-enhanced MR images should be acquired in short time intervals, since reactive changes may show contrast enhancement indistinguishable from that of tumor in the later phases of enhancement.23,26,27 Subtraction MR imaging has been used to increase the detection of early arterial enhancement of residual tumor.27
T2-weighted images are valuable in distinguishing muscle from tumor and can increase diagnostic specificity in evaluating marrow infiltration, seen as areas of low signal intensity on T1-weighted images.
MR imaging may not be as sensitive as CT to cortical disruption, fine periosteal reactions, and small calcifications; however, with proper imaging planes and resolution, early endosteal and cortical erosions as well as periosteal changes can be detected on MR images (Figs. 14-2, 14-3, and 14-4). Although each MR examination must be tailored to the patient
and pathology in question, certain general guidelines can be followed:
and pathology in question, certain general guidelines can be followed:
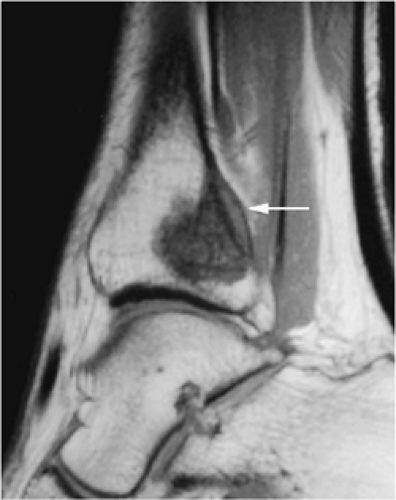 FIGURE 14-2 ● Osteosarcoma of the distal tibia is seen on a sagittal proton density-weighted image. Cortical thinning and periosteal reaction are demonstrated (arrow). |
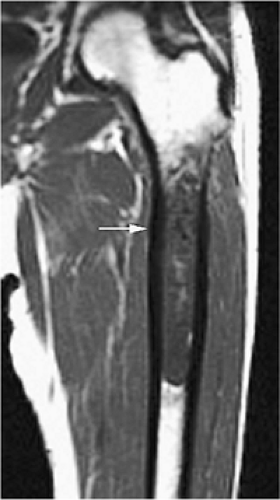 FIGURE 14-3 ● Chondrosarcoma of the proximal femoral shaft is seen on a coronal T1-weighted image. Cortical thickening (arrow) demonstrates low signal intensity on the T1-weighted image. |
The longitudinal extent of tumors can be seen on T1-weighted coronal or sagittal images.
If a lesion is difficult to differentiate from (i.e., is isointense with) adjacent tissues, a conventional T2, fat-suppressed T2-weighted fast spin-echo, fat-suppressed proton density-weighted fast spin-echo, or STIR sequence should be obtained.
T1- and T2-weighted images (including fat-suppressed T2-weighted fast spin-echo or STIR sequences) in the axial plane provide the most important images in delineating the relationship of a tumor to adjacent neurovascular structures and compartments—essential information in preoperative limb-salvage planning.
The proximal and distal extent of tumor involvement can be assessed by evaluating multiple axial sections.
The region of abnormality should be positioned as close to the center of the coil as possible.
The patient—s position (prone or supine) is determined by the area of abnormality.
Prior to imaging the region of interest, a large field-of-view localizer using an increased-diameter surface coil or body coil may be necessary to include skin lesions or to accurately determine the proximal and distal extension of a large mass.
MR spectroscopy using phosphorus-31 or protons has been used to improve lesion characterization and to evaluate response to therapy.28,29 It is not, however, routinely used in most clinical settings. This technique is limited by the difficulty of obtaining representative spectra in all locations of the tumor and by contamination of tumor spectra with adjacent soft tissues.
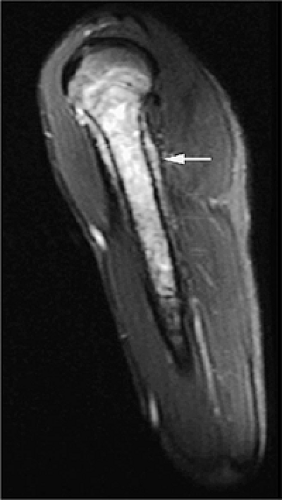 FIGURE 14-4 ● Sagittal fat-suppressed T2-weighted fast spin-echo image demonstrates chondrosarcoma of the humeral shaft. Histologically confirmed hyperintense subcortical tumor infiltration (arrow) is identified. |
Staging
Pearls and Pitfalls
Staging
MR imaging is the method of choice in staging musculo-skeletal neoplasms.
MR images should be read in conjunction with radiographs.
MR imaging is accurate in determining the local extent of tumor and involvement of muscle compartments, joints, and neurovascular bundles.
Evaluation of intra- and extraosseous extent, joint invasion, neurovascular bundle involvement, skip metastases, and local adenopathy as well as distant metastases is important for accurate staging and subsequent therapy.
Consider FDG-PET for staging and evaluation of therapy response in equivocal cases.
Accurate preoperative staging is important to determine the prognosis and to aid clinicians in choosing the appropriate therapy. The purpose of staging is to define the local and distant extent of tumor, determine the surgical margins of resection, and facilitate interdisciplinary communication regarding treatment and results. The Enneking staging system for bone and soft-tissue tumors, the most widely used, is based on tumor grade, site, and the presence of metastases using histologic, radiologic, and clinical criteria (Table 14-1).30,31. In the Enneking system benign lesions are considered grade 0 (G0) and malignant lesions are either low grade (G1) or high grade (G2). For the assessment of the site and extent of tumors, T0 is reserved for benign tumors confined within a true capsule and the anatomic compartment of origin. An aggressive benign or malignant tumor confined within its anatomic compartment is T1. T2 indicates spread of the lesion beyond the anatomic compartment of origin. For the assessment of metastatic disease, M0 indicates no metastatic disease and M1 indicates the presence of regional or distant metastases. The Enneking staging system divides benign tumors into latent, active, or aggressive tumors.30,31
MR imaging has become the modality of choice for staging musculoskeletal neoplasms and assessing local spread of tumor. MRI can accurately detect tumor involvement of neurovascular structures, muscle compartments, and joints.
Recently, positron emission tomography (PET) has been found to be useful in following patients with bone and soft-tissue sarcomas after therapy.32 PET is an imaging technique that uses radiopharmaceuticals, typically a radionuclide-labeled analog of glucose, such as 2-F18-fluoro-2-deoxy-d-glucose (FDG), to detect abnormal metabolic activity. Because malignant tumors usually have increased cellular (and thus increased glucose) metabolism, PET is able to provide unique information, complementary to that provided by MR imaging, about the biologic activity of musculoskeletal tumors. FDG-PET has been shown to be able to distinguish recurrent tumor from post-therapeutic changes. In addition, FDG-PET has the ability to examine the entire body for both primary malignancies and metastatic disease during a single procedure. It can also be used to guide a biopsy to the most active tissue and to evaluate patients who have undergone limb-salvage procedures (Fig. 14-5).32,33,34
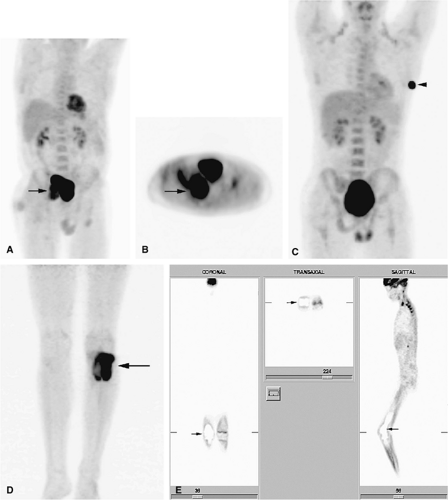 FIGURE 14-5 ● FDG-PET in the evaluation of patients with sarcomas. Whole-body FDG-PET scan (A) and corresponding axial image (B) in a patient with neurofibromatosis type 1 demonstrates a region of intense FDG uptake in the right buttock area (arrow), which was found to represent a malignant peripheral nerve sheath tumor arising in a neurofibroma. (C and D) Images from a whole-body FDG PET scan in a patient with osteosarcoma show intense FDG uptake in the proximal tibia (D) in the area of the tumor (arrow). Images of the chest and abdomen demonstrate no evidence of metastatic disease. A marker was placed over the left chest wall (C) (arrowhead). (E) Coronal, axial, and sagittal images of a whole-body FDG-PET scan in a patient with osteosarcoma of the right femur. The patient underwent resection of the right femur and total knee arthroplasty. MR images and CT scans were deemed inadequate for tumor evaluation because of metallic artifact. FDG-PET scan shows a cold defect in the region of the right knee arthroplasty (arrows) and no increased FDG uptake in the area of the right femur and knee. |
TABLE 14.1 ● The Enneking staging system for musculoskeletal neoplasms | ||||||||||||||||||||||||||||||||||||||||||||||||||||||||||||||||||||||||||||||||||||
|---|---|---|---|---|---|---|---|---|---|---|---|---|---|---|---|---|---|---|---|---|---|---|---|---|---|---|---|---|---|---|---|---|---|---|---|---|---|---|---|---|---|---|---|---|---|---|---|---|---|---|---|---|---|---|---|---|---|---|---|---|---|---|---|---|---|---|---|---|---|---|---|---|---|---|---|---|---|---|---|---|---|---|---|---|
| ||||||||||||||||||||||||||||||||||||||||||||||||||||||||||||||||||||||||||||||||||||
General MR Appearance
Pearls and Pitfalls
General MR Appearance
MR imaging features are usually nonspecific in differentiating benign from malignant processes.
Benign and malignant tumors usually demonstrate low signal on T1- and high signal on T2-weighted images.
Infiltration of neurovascular bundles is seen more commonly in malignant tumors.
Both benign and malignant tumors can present with fluid–fluid levels.
Direct multiplanar imaging facilitates improved preoperative and pretherapy evaluation of the exact extent of a lesion. In addition, since there is minimal artifact from nonferromagnetic implants with MR imaging, it is often possible to identify postoperative and post-treatment fibrous tissues not seen on CT. The following MR findings are used in tumor evaluation:
A tumor bed with postoperative scarring demonstrates low signal intensity on both T1- and T2-weighted images (including fat-suppressed T2- or proton density-weighted fast spin-echo images).
If T1- and T2-weighted images show intermediate and high signal intensity, respectively, the possibility of recurrent tumor is more likely.
Frequently it is not possible to distinguish benign from malignant lesions of bone and soft tissue on the basis of MR signal characteristics alone. Both benign and malignant lesions may demonstrate areas of low signal intensity on T1-weighted images and increased signal intensity on T2-weighted images. Malignant lesions tend to be more extensive, involving marrow, cortical bone, and soft tissues, but these criteria do not always distinguish benign from malignant lesions. No correlations have been shown matching T1 and T2 relaxation times with corresponding histopathology.35
If the neurovascular bundle is involved, the lesion is likely to be malignant.
A fluid–fluid level is a nonspecific finding in bone and soft-tissue lesions. Tumors with fluid–fluid levels include fibrous dysplasia, simple and aneurysmal bone cysts, malignant fibrous histiocytoma, osteosarcoma, chondroblastoma, and osteoblastoma.36
Infectious processes (e.g., osteomyelitis) and benign neoplasms have been found to have a low-signal-intensity peripheral margin in 33% of patients.37 This margin is rarely seen in malignant lesions because a well-defined sclerotic interface is not present.
It is important to perform MR studies prior to biopsy to avoid postsurgical inflammation and edema, which may prolong the T2 values of uninvolved tissues.
Muscle edema is nonspecific and may be associated with trauma, infection, and vascular insults.
On T1-weighted images, high signal intensity in the surrounding musculature can be seen in atrophy with fatty infiltration or neuromuscular disorders and should not be mistaken for tumor.
Venous varicosities may scallop subcutaneous tissue and demonstrate low signal intensity on T1-weighted images. This appearance is characteristic and can be distinguished from neoplastic soft-tissue extension or tumor vascularity.
Red-to-yellow marrow conversion in middle-aged women (marrow inhomogeneity is especially common in obese women with a history of smoking) is seen in metaphyseal or diaphyseal areas of low signal intensity (i.e., red marrow) without extension into the epiphysis (Fig. 14-6). These lesions become isointense with
adjacent marrow on heavily T2-weighted images and demonstrate increased signal intensity on STIR images. Inhomogeneity of metaphyseal red and yellow marrow may also be observed in the immature skeleton.
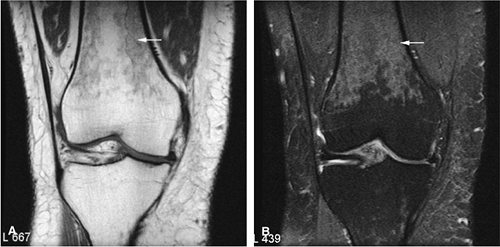 FIGURE 14-6 ● Coronal T1-weighted image (A) and coronal STIR image (B) demonstrate red marrow heterogeneity (arrow) in the femoral diaphysis and metaphysis without extension across the physeal scar. |
Bone Tumors
Benign Lesions
Benign Osteoblastic Lesions
Pearls and Pitfalls
Benign Osteoblastic Lesions
Osteoid osteomas may present with extensive marrow edema on MR imaging, obscuring the nidus, and may therefore be mistaken for osteomyelitis or malignant tumor.
CT is most sensitive in detecting the nidus in osteoid osteomas.
Consider image-guided therapy for the treatment of osteoid osteomas.
Osteoblastomas frequently involve the posterior elements of the spine.
Osteoblastomas can present with fluid–fluid levels.
Osteoid Osteoma
Osteoid osteomas are small, benign, osteoblastic lesions characteristically seen in younger patients (between 7 and 25 years of age).38 They are composed of osteoid and trabeculae of newly formed osseous tissue embedded in a substriated, highly vascularized osteogenic connective tissue with a surrounding peripheral zone of dense sclerotic bone. They rarely exceed 1 cm in diameter and are usually located in either the spongiosa or the cortex of the bone. Most commonly, they affect long tubular bones; the femur is the most common site of involvement (Fig. 14-7). The clinical hallmark of this lesion is pain that is most prominent at night and can be relieved with salicylates such as aspirin.38,39,40
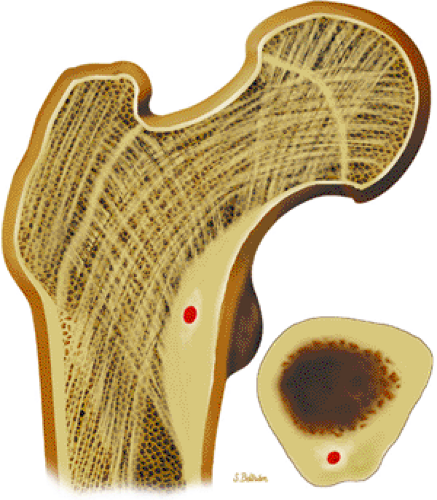 FIGURE 14-7 ● Osteoid osteoma of the proximal femur. Coronal graphic illustration shows tumor nidus in red with surrounding sclerosis. |
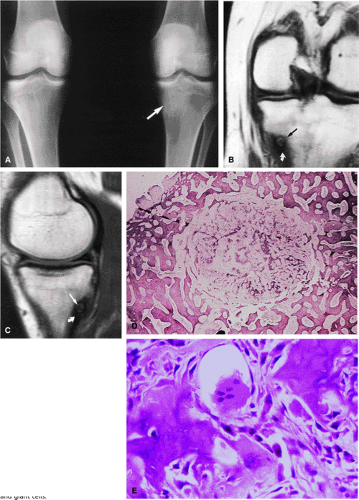 FIGURE 14-8 ● (A) Anteroposterior radiograph shows focal sclerosis of the medial tibial metaphysis (arrow). T1-weighted coronal (B) and sagittal (C) images reveal the osteoid osteoma nidus (straight arrows) and thickened cortex (curved arrow). (D) Scanning lens photomicrograph shows the nidus surrounded by sclerotic reactive bone. (E) High-power photomicrograph of the nidus demonstrates young neoplastic osteoid formation in an angiofibrotic background speckled with osteoblasts and giant cells. |
The characteristic MR appearance of osteoid osteoma includes the following findings:
On T1-weighted images, the nidus of the lesion demonstrates low to intermediate signal intensity (Fig. 14-8).
Intracapsular osteoid osteomas of the hip usually cause a synovial inflammatory response and are associated with joint effusions and variable reactive marrow edema.43,44 Reactive sclerosis demonstrates low signal intensity on T1- and T2-weighted images. There may be extensive marrow edema associated with osteoid osteomas, and STIR or fat-suppressed T2-weighted fast spin-echo sequences can be used to screen for this reactive edema (Fig. 14-9).
Occasionally, increased vascularity directed toward the nidus is seen on MR images.
Thin-section CT may be necessary to identify the nidus in intracortical lesions.45
Enhancement with gadolinium in the presence of a reactive soft-tissue mass may be mistaken for a malignant tumor or osteomyelitis.8
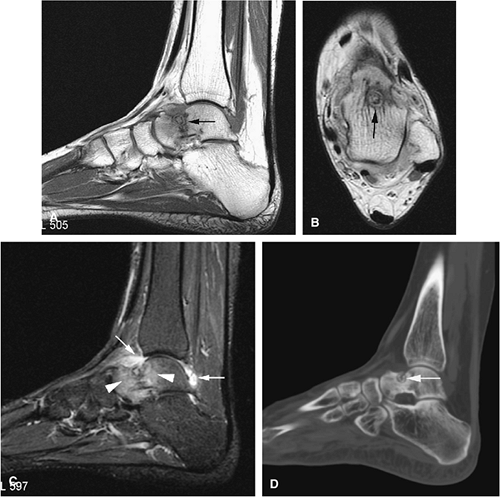 FIGURE 14-9 ● Sagittal (A) and axial (B) T1-weighted images show subcortical osteoid osteoma with a low-signal-intensity nidus (arrow) of the talar neck. (C) Corresponding sagittal fat-suppressed T2-weighted fast spin-echo image demonstrates surrounding hyperintense bone marrow edema (arrowheads). A joint effusion and synovitis is present (arrows). (D) Sagittal CT image demonstrates the osteoid osteoma nidus in the talar neck (arrow). |
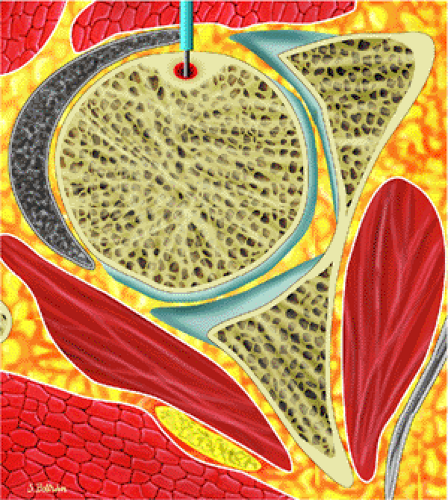 FIGURE 14-10 ● Axial graphic illustration shows radiofrequency ablation of an osteoid osteoma. Nidus is shown in red with surrounding cortical thickening. The radiofrequency probe is positioned within the nidus. |
There are three fundamentally different approaches to the treatment of osteoid osteomas: surgical (resection or curettage), conservative (medical), or percutaneous (percutaneous excision, radiofrequency ablation, laser photocoagulation).46,47,48,49 CT-guided percutaneous radiofrequency ablation has been found to be a safe and effective treatment for osteoid osteoma.50,51 It is performed under general or spinal anesthesia as an outpatient procedure. The patient is placed on the CT scanner and the lesion is identified using CT guidance. In general, the shortest distance through the bone is selected for access and a drill is used to enter the cortex and the nidus. A biopsy is usually obtained at the time of treatment. After needle biopsy, a radiofrequency electrode is introduced into the nidus and the lesion is heated to 90°C for 6 minutes (Figs. 14-10 and 14-11). If the lesion is large, multiple treatments can be performed during the same session.
Osteoblastoma
Initially known as giant osteoid osteoma, osteoblastoma commonly presents in patients between 10 and 20 years of age.8,40,52 Local pain is inconsistently relieved with salicylates. Osteoblastoma most frequently involves the flat bones, posterior osseous elements of the vertebrae (Fig. 14-12), and long bones (Fig. 14-13). Histologically, osteoblastomas present a more variable picture than osteoid osteomas.
There is well-vascularized connective tissue containing osteoid and primitive woven bone rimmed by osteoblasts. In contrast to osteoid osteoma, trabecular maturation, the degree of calcification, and overall architectural patterns vary greatly in osteoblastoma.40
There is well-vascularized connective tissue containing osteoid and primitive woven bone rimmed by osteoblasts. In contrast to osteoid osteoma, trabecular maturation, the degree of calcification, and overall architectural patterns vary greatly in osteoblastoma.40
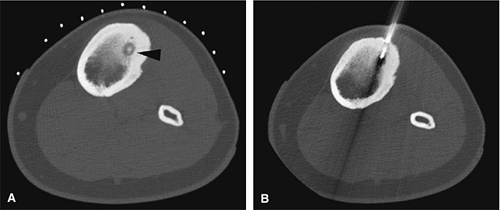 FIGURE 14-11 ● (A) CT images from a radiofrequency ablation show osteoid osteoma nidus in the anterior tibia (arrowhead) with surrounding cortical thickening. (B) Radiofrequency probe is positioned within the nidus for treatment. |
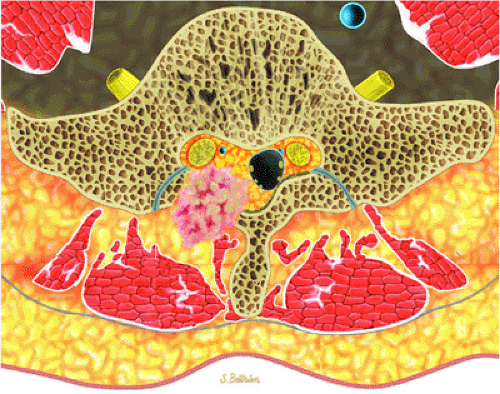 FIGURE 14-12 ● Osteoblastoma of the spine. Axial graphic illustration shows expansile tumor in red arising from the posterior elements. |
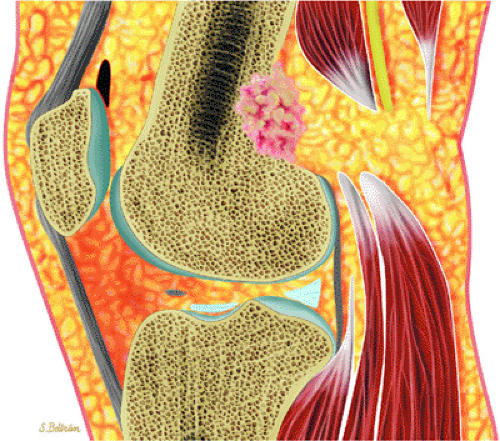 FIGURE 14-13 ● Sagittal graphic illustration shows cortical osteoblastoma of the distal femur in red. |
Characteristic MR findings include the following:
Signal intensity may be heterogeneous or homogeneous on T2-weighted images (Fig. 14-14).
Fluid–fluid levels can be seen in osteoblastomas (Fig. 14-15).53
A diffuse inflammatory response involving bone and adjacent soft tissue has been reported in a case of vertebral osteoblastoma.54 CT may be more accurate for the identification of small foci of matrix calcification (Fig. 14-16).
Local excision involves marginal or intralesional resection with curettage.8
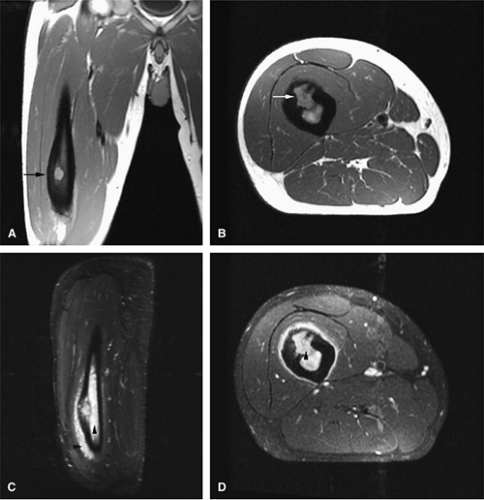 FIGURE 14-14 ● Cortical osteoblastoma of the femoral diaphysis. Coronal (A) and axial (B) T1-weighted images show osteoblastoma isointense to muscle with adjacent cortical thickening (arrows). Reactive bone marrow edema is hyperintense on sagittal (C) and axial (D) fat-suppressed T2-weighted fast spin-echo images (arrowheads). |
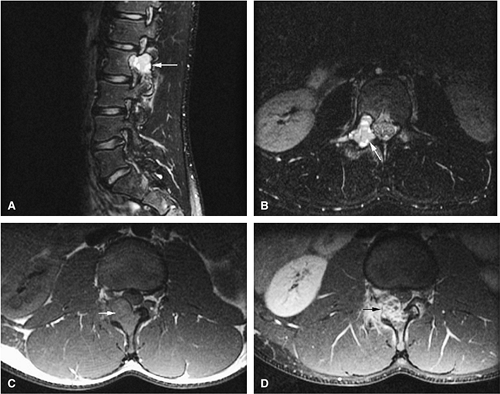 FIGURE 14-15 ● Osteoblastoma arising in the posterior elements of the L2 vertebra is demonstrated on sagittal (A) and axial (B) fat-suppressed T2-weighted fast spin-echo images. Fluid–fluid levels are present (arrows). The tumor is isointense to muscle (arrow) on the axial T1-weighted image (C) and demonstrates enhancement (arrow) following intravenous injection of gadolinium (D). Note the mass effect upon the spinal canal from the tumor. |
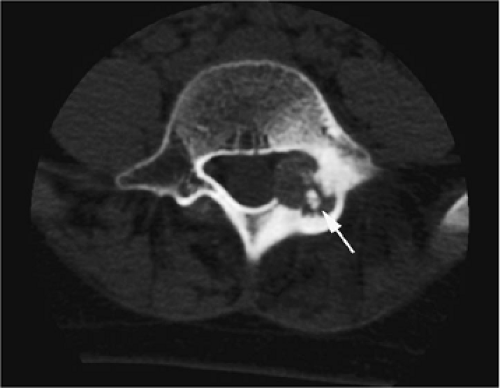 FIGURE 14-16 ● Internal calcifications (arrow) are identified on an axial CT image in this osteoblastoma arising in the left posterior elements of the L5 vertebra. |
Benign Chondroblastic Lesions
Pearls and Pitfalls
Benign Chondroblastic Lesions
On T2-weighted and STIR images, chondroid matrix is markedly hyperintense.
Enchondromas can be confused with bone infarcts. Infarcts show central fat signal and serpiginous borders.
Syndromes associated with multiple enchondromas have an increased risk of malignant transformation.
Osteochondromas show continuity with the marrow cavity of host bone.
Osteochondromas have their own growth plate and stop growing with skeletal maturity.
MR imaging is useful in determining the thickness of the cartilage cap.
Chondroblastomas involve the epiphyses/epiphysis equivalents.
Enchondroma
Enchondromas are benign intramedullary lesions composed of circumscribed lobules of hyaline cartilage that occasionally exhibit flecks of calcification (Fig. 14-17). Tumor cellularity may be increased in children and adolescents, but this does not imply chondrosarcoma. Radiologic findings are critical for accurate diagnosis.55 Approximately 40% to 65% of solitary enchondromas occur in the hands, and approximately 25% occur in the long tubular bones.40,55 Multiple enchondromatosis (Ollier—s disease) was originally described in 1899. This rare, nonhereditary disorder is characterized by multiple asymmetric chondromatous lesions (Fig. 14-18). In childhood, these lesions predispose the bone to fracture; in adulthood, there is an increased risk of malignant transformation.56 Multiple enchondromas with associated soft-tissue hemangiomas are seen in Maffucci—s syndrome, a nonhereditary disorder with a high predisposition for malignant transformation (Fig. 14-19).57 Lesions that continue to grow after the cessation of normal body growth should raise the suspicion of malignant transformation.
MR imaging is useful in identifying enchondromas, which are well defined and demonstrate low signal intensity on T1-weighted images. The following findings are characteristic:
Satellite cartilaginous foci are often seen in association with enchondromas.
Chondroid elements demonstrate marked hyperintensity on T2-weighted or STIR images (Figs. 14-20 and 14-21).
In the multiple enchondromas of Ollier—s disease, the foci of cartilaginous tissue or matrix are seen as areas of low to intermediate signal intensity on T1-weighted images and high signal intensity on T2-weighted images. This appearance is secondary to the long T1 and T2 relaxation times of chondroid tissue. Enchondromas in Ollier—s disease may show aggressive features such as cortical irregularities, and there is an increased incidence of malignant degeneration (Fig. 14-22).
In Maffucci—s syndrome soft-tissue hemangiomas can be seen on T2-weighted images as high-signal-intensity tubular structures, consistent with slow flow in vascular channels.
Enchondromas are common in the tubular bones of the hands and feet (Fig. 14-23).
Lack of central fat signal intensity on T1-weighted images
Peripheral borders that are not as serpiginous as those seen in infarcted tissue
Central areas of increased signal intensity on T2-weighted images
In juxtacortical or periosteal chondroma, soft-tissue calcification may mimic myositis ossificans (Figs. 14-24 and 14-25). A localized increase in signal intensity on T2-weighted images may occur without underlying involvement of the adjacent bone.60
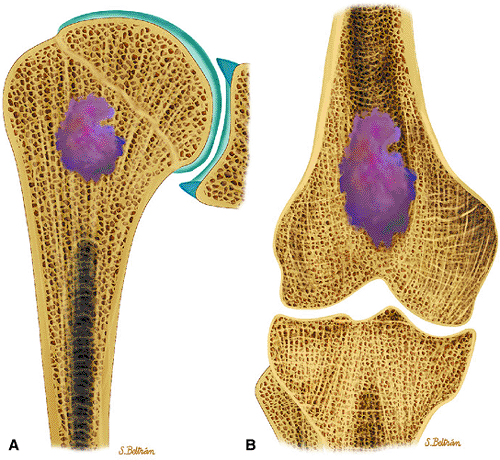 FIGURE 14-17 ● Coronal graphic illustration of the humerus (A) and femur (B) shows a well-defined lobulated metaphyseal enchondroma in purple. |
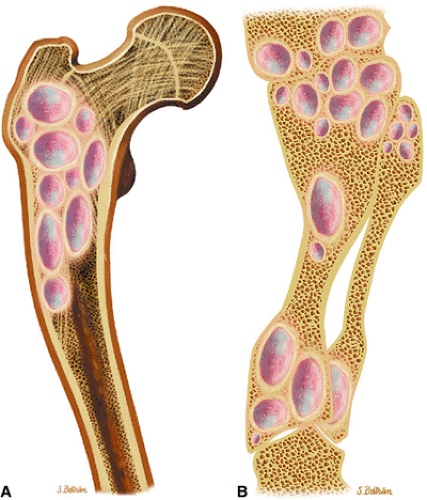 FIGURE 14-18 ● Ollier—s disease of the lower extremity. Coronal graphic illustration of the femur (A) and lower leg (B) shows deformity with multiple enchondromas. |
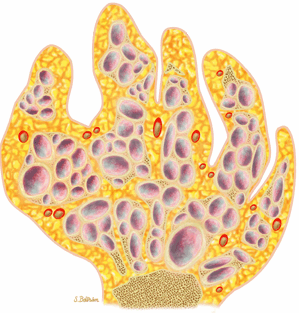
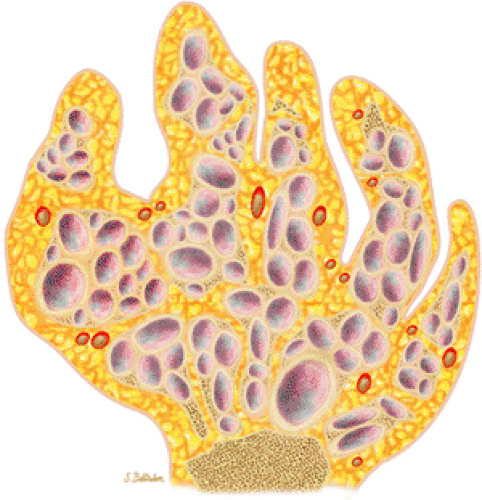 FIGURE 14-19 ● Maffucci—s syndrome of the hand. Coronal graphic illustration shows marked deformity of the hand with multiple enchondromas in purple and hemangiomas in red. |
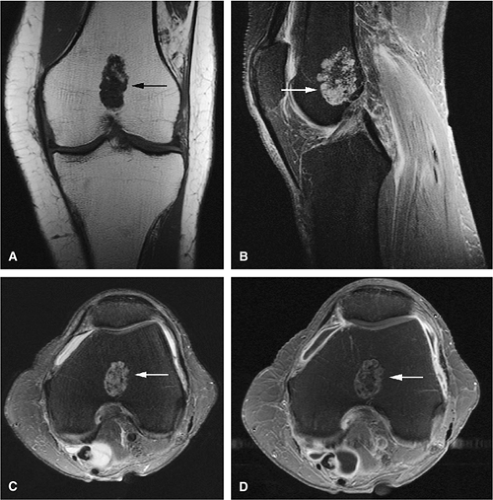 FIGURE 14-20 ● Benign enchondroma of the distal femur (arrows) demonstrates low signal intensity on a coronal T1-weighted image (A) and high signal intensity on sagittal (B) and axial (C) fat-suppressed T2-weighted fast spin-echo images. (D) Serpiginous enhancement is demonstrated on a contrast-enhanced axial fat-suppressed T1-weighted image. |
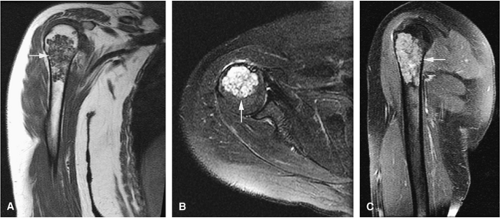 FIGURE 14-21 ● (A) Coronal T1-weighted image shows a low-signal-intensity proximal humeral enchondroma (arrow). (B) On an axial fat-suppressed T2-weighted fast spin-echo image, the chondroid matrix is hyperintense (arrow). (C) Sagittal fat-suppressed T1-weighted image after administration of intravenous gadolinium demonstrates enhancement of the lesion (arrow). |
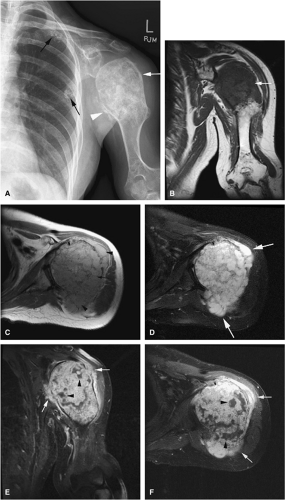 FIGURE 14-22 ● Ollier—s disease with sarcomatous degeneration. (A) An anteroposterior radiograph demonstrates deformity of the humerus with large enchondroma (white arrow). Periosteal reaction (white arrowhead) is present. Multiple enchondromas are identified within the ribs (black arrows). (B) Coronal T1-weighted image shows a large enchondroma of the proximal humerus (arrow). (C) Axial proton density-weighted images show a large enchondroma of the proximal humerus (arrow) with cortical destruction and associated soft-tissue mass (arrowheads). (D) Axial fat-suppressed T2-weighted fast spin-echo image shows hyperintense cartilage matrix. There is disruption of the cortex with associated soft-tissue mass (arrows). (E) Coronal and (F) axial fat-suppressed T1-weighted images after administration of intravenous gadolinium demonstrate heterogeneous enhancement of the lesion and cortical destruction with soft-tissue mass (arrows). Nonenhancing areas of necrosis are present within the lesion (arrowheads). |
It is difficult to differentiate enchondroma from low-grade chondrosarcoma on the basis of signal intensity alone. The presence of a positive bone scan in the absence of pain cannot be used as a criterion for malignant transformation of enchondromas. Nonaggressive features include the absence of a soft-tissue mass and absence of interval growth on serial MR studies. Treatment of atypical or symptomatic enchondromas includes marginal or intralesional resection.8 Autologous or allograft bone grafting is often required to repair defects in large and weight-bearing bones.
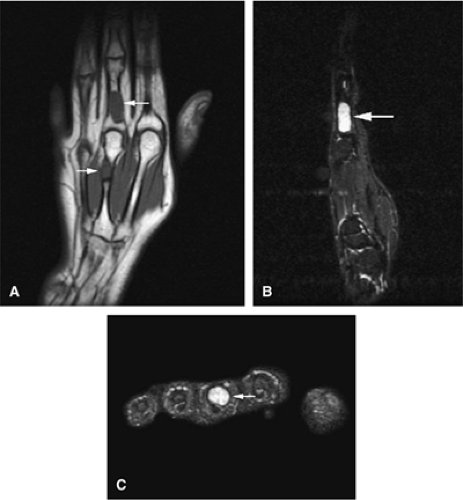 FIGURE 14-23 ● Expansile enchondromas (arrows) of the third proximal phalanx and metacarpal are seen on coronal T1-weighted (A) and sagittal (B) and axial (C) fat-suppressed T2-weighted fast spin-echo images. |
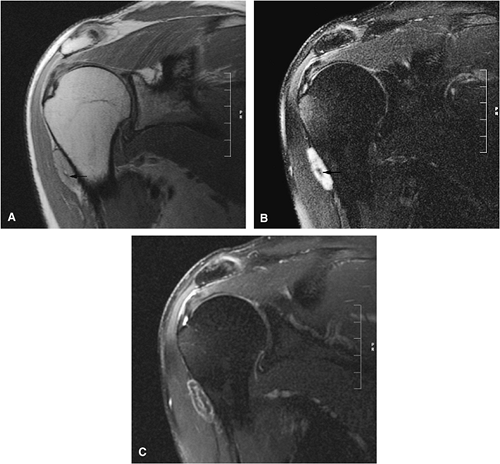 FIGURE 14-24 ● Periosteal (i.e., juxtacortical) chondroma located in the proximal humerus is seen on coronal proton density-weighted (A), fat-suppressed T2-weighted fast spin-echo (B), and contrast-enhanced (C) images. Central osseous tissue is low in signal intensity on the proton density and fat-suppressed T2-weighted sequences (arrows). |
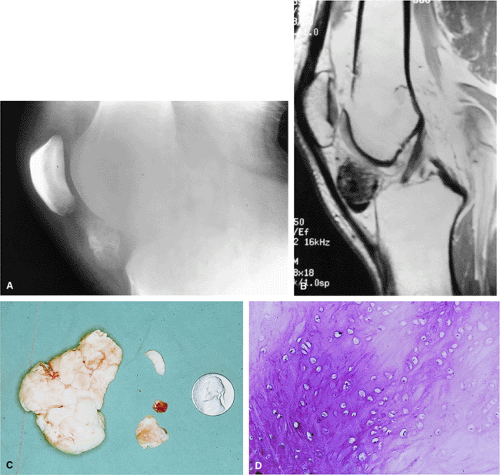 FIGURE 14-25 ● (A) Radiograph of the knee of a young adult male with a heavily calcified juxta-articular chondroma in the infrapatellar fat pad. (B) T1-weighted sagittal image demonstrates the low-signal character of this heavily calcified chondroid lesion just beneath the patellar ligament. (C) Gross appearance of the resected specimen, with the upper faceted surface representing its prior articulation with the femoral condyle. (D) Low-power photomicrograph of benign-appearing chondrocytes in a heavily calcified chondroid matrix. |
Osteochondroma
Osteocartilaginous exostosis (osteochondroma) is one of the most common bone tumors in children. Solitary osteochondroma is a frequent lesion, and opinions differ as to whether it represents a true neoplasm or a developmental physeal growth defect.55 The vast majority of these lesions present in patients younger than 20 years of age. With the exception of a proliferative cartilage cap, the spongiosa and cortex in exostosis are continuous with the adjacent shaft (Fig. 14-26). Osteochondromas have their own growth plate and stop growing with skeletal maturity. The thickness of the cartilaginous cap correlates with the age of the patient.55 In children or adolescents, the cap may be as thick as 3 cm. In adults, however, the cap is thinner, presumably secondary to wear and tear. Findings of a cartilage cap thicker than 1 cm, an irregular cartilaginous cap, renewed growth with pain in an adult, or a combination of these raises the possibility of chondrosarcomatous transformation.40,55,61,62 Such malignant transformation is rare (<1%) in solitary osteochondroma but has been reported with increased frequency in cases of multiple hereditary exostoses.
Osteochondromas are metaphyseal-based tumors that usually involve the long bones (Fig. 14-27). When flat bones are involved, the lesion may present with a more cauliflower or expansile configuration. On MR imaging, the following findings are characteristic:
Benign osteochondromas are isointense to normal marrow (Figs. 14-28 and 14-29).
The intact cartilage cap demonstrates intermediate signal intensity on T1-weighted images and high signal intensity on T2-weighted images.
With malignant degeneration, the signal intensity of the exostosis decreases on T1-weighted images and
increases on T2-weighted images. Disruption of the high-signal-intensity cartilaginous cap may also be observed with aggressive tumor invasion.
Fat-suppressed T2-weighted fast spin-echo sequences are useful in defining the thickness of the cartilaginous cap (as mentioned earlier, it may be as thick as 3 cm in adolescents and <1 cm in adults). Dispersed calcifications in the cartilaginous cap, as well as increased thickness of the cap, are features of malignant transformation that can be identified on MR scans.
MR imaging is superior to CT in demonstrating inflammatory changes that accompany enlargement of the bursa exostotica covering the cartilaginous cap (Fig. 14-30). This bursa is hypointense on T1-weighted images and hyperintense on T2, fat-suppressed T2-weighted fast spin-echo, or STIR sequences. Gadolinium administration causes enhancement of the periphery of the bursa exostotica only.
Growth deformity is associated with multiple hereditary exostoses (Fig. 14-31).63
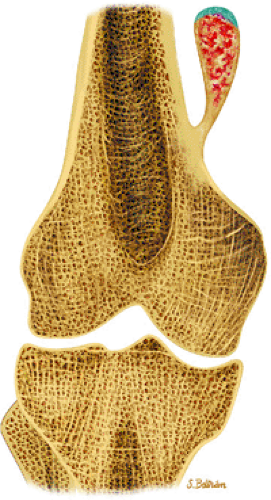 FIGURE 14-26 ● Coronal graphic illustration demonstrates an osteochondroma arising from the distal femur. Note the continuity of the lesion with the marrow cavity of the host bone. Calcifications within the osteochondroma are shown in red and the cartilage cap is shown in blue. |
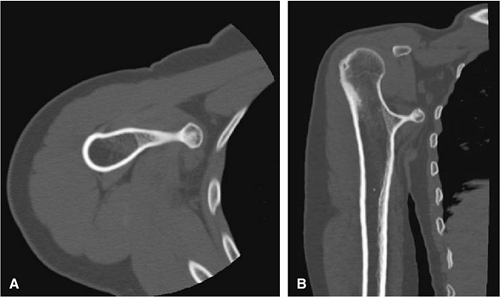 FIGURE 14-27 ● A metaphyseal osteochondroma arising from the proximal humerus with continuity of marrow and cortex is demonstrated on axial (A) and coronal (B) CT images. |
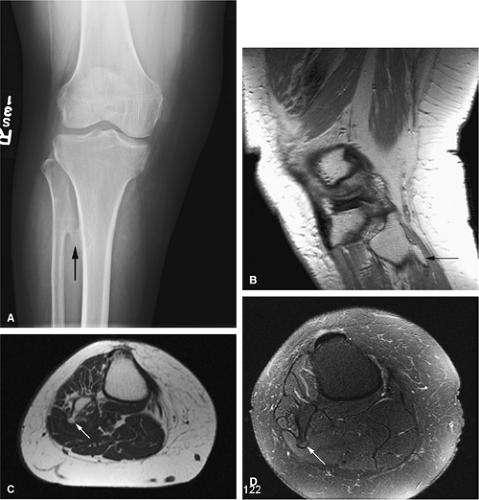 FIGURE 14-28 ● A small osteochondroma arising from the proximal fibula (arrows) is demonstrated on an anteroposterior radiograph (A), a sagittal proton density-weighted image (B), and axial T1-weighted (C) and fat-suppressed T2-weighted fast spin-echo (D) images of the knee. |
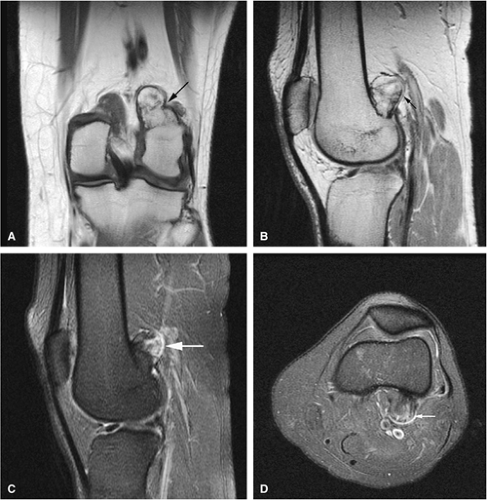 FIGURE 14-29 ● A sessile osteochondroma of the posterior distal femur (arrows) can be seen on coronal T1-weighted (A), sagittal proton density-weighted (B), and sagittal (C) and axial (D) fat-suppressed T2-weighted images. |
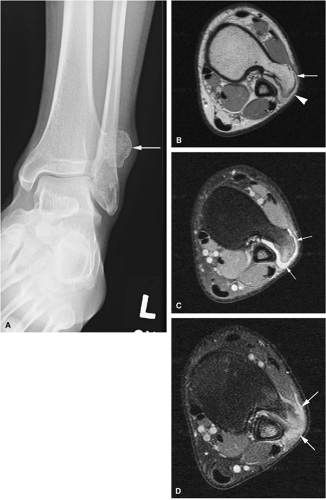 FIGURE 14-30 ● Bursa exostotica associated with a tibial osteochondroma. (A) Anteroposterior radiograph shows an osteochondroma arising from the distal tibia (arrow). (B) The osteochondroma (arrow) demonstrates continuity with the medulla cavity at the tibia. The bursa exostotica (arrowhead) is hyperintense on a proton density-weighted axial image. (C) On a fat-suppressed T2-weighted fast spin-echo image, the bursa exostotica is hyperintense (arrows). (D) Peripheral enhancement (arrows) is seen on a fat-suppressed T1-weighted axial image after administration of intravenous gadolinium. |
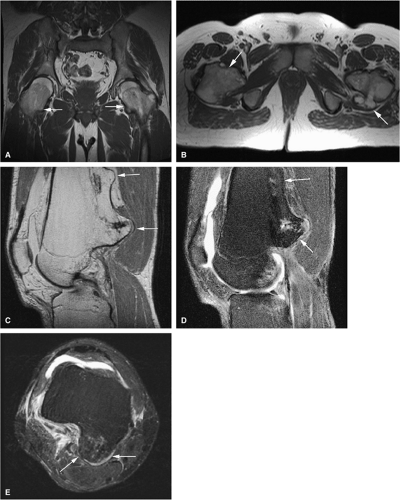 FIGURE 14-31 ● Undertubulation of the hips and knees in a patient with multiple hereditary exostoses. Exostoses (arrows) are seen on coronal (A) and axial (B) T1-weighted images of the hip. Sagittal proton density (C) and sagittal (D) and axial (E) fat-suppressed T2-weighted fast spin-echo images of the knee also demonstrate exostoses (arrows). |
Geirnaerdt et al. have described a pattern of septal enhancement with gadolinium-enhanced MR imaging that is helpful in identifying transformation of osteochondromas to low-grade chondrosarcomas.7 The enhancing curvilinear septa are thought to correlate histologically with fibrovascular septa around and between lobules of paucicellular cartilage and cystic mucoid tissue. Osteochondromas without signs of malignant transformation show a peripheral enhancement of fibrovascular tissue covering the nonenhanced hyaline cartilage cap without evidence of fibrovascular septa. Despite the presence of septa in low-grade chondrosarcoma, these patterns of enhancement are not observed in high-grade chondrosarcomas. Crim and Seeger point out that these findings have not been validated in a sufficient number of patients to conclude that septal enhancement is a specific sign for low-grade chondrosarcoma.64 In fact, fibrovascular septa are uncommon in grade 1 chondrosarcoma. Additional studies need to be performed to more precisely determine the benefit of gadolinium enhancement in the diagnosis of grade 1 chondrosarcomas.
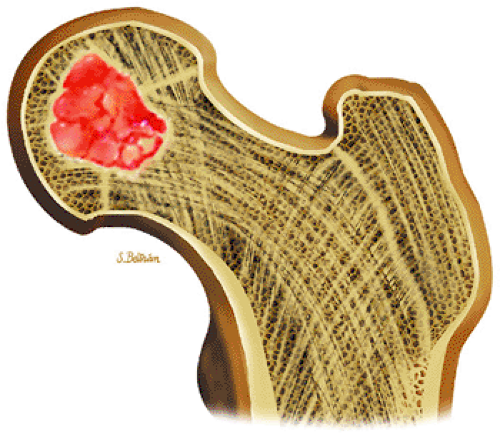 FIGURE 14-32 ● Chondroblastoma of the proximal femur. A well-defined lobulated lesion involving the femoral epiphysis is shown in red. |
Symptomatic osteochondromas can be treated with simple resection of the base and cartilaginous tissue, including the perichondrium surrounding the cap.
Chondroblastoma
Chondroblastoma is a benign epiphyseal cartilage tumor that generally arises in a long tubular bone and occurs most frequently in the second decade of life (Fig. 14-32).65 Joint effusion may accompany periarticular bone involvement. Histologic findings include a cellular proliferation of chondroblasts with irregularly dispersed multinucleated osteoclast giant cells.65 In 50% of cases, benign peripheral sclerosis, intralesional punctate lace-like calcifications, and chondroid are present (Fig. 14-33). Older lesions may exhibit necrosis, resorption, or reparative fibrosis with metaplastic osseous areas. These features all contribute to the variability seen in this lesion.
On MR images, benign chondroblastomas demonstrate a well-defined area of low to intermediate signal intensity on T1-weighted images and heterogeneity with increased signal
intensity on T2-weighted images (Figs. 14-34 and 14-35). Typically, the long-bone epiphyses of the humerus, tibia, or femur are affected. MR imaging can also be used to identify eccentric locations and the associated sclerotic border.66 Other MR findings include the following:
intensity on T2-weighted images (Figs. 14-34 and 14-35). Typically, the long-bone epiphyses of the humerus, tibia, or femur are affected. MR imaging can also be used to identify eccentric locations and the associated sclerotic border.66 Other MR findings include the following:
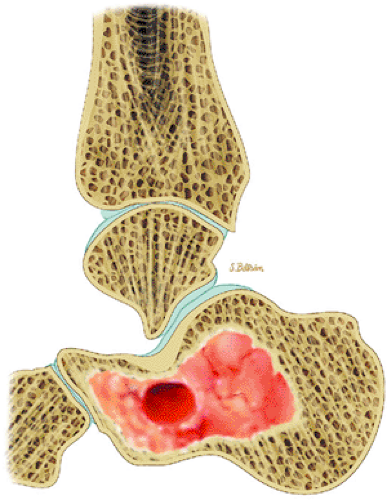 FIGURE 14-33 ● A chondroblastoma of the calcaneus is shown in red on a sagittal graphic illustration. Areas of calcification are shown in white and a hemorrhagic cyst is shown in red. |
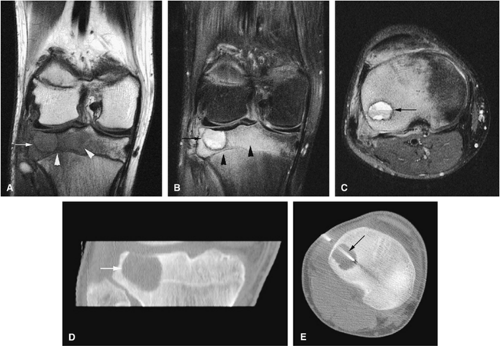 FIGURE 14-34 ● Extensive marrow edema (arrowheads) in reaction to an epiphyseal-based chondroblastoma of the tibia (arrows) demonstrates low signal intensity on a coronal T1-weighted image (A) and hyperintensity on a coronal STIR image (B). Axial STIR image (C) demonstrates fluid–fluid levels within the lesions (arrow). (D) A coronal CT image shows a well-defined lytic defect in the tibial plateau (arrow). (E) An axial CT image obtained during radiofrequency ablation of the tumor shows the radiofrequency probe (arrow) within the chondroblastoma. |
Epiphyseal and metaphyseal marrow edema associated with periosteal reaction is a frequent finding, seen in up to 57% of cases of long-bone involvement.67 MR imaging is sensitive to this extensive reactive marrow edema, which demonstrates decreased signal intensity on T1-weighted images and increased signal intensity on T2-weighted or STIR images.
Fluid–fluid levels can be seen in chondroblastomas.53
T2-weighted images are useful in demonstrating the lobular chondroid internal architecture and fine lobular margins of the lesion.68
Treatment involves biopsy followed by curettage. Intralesional curettage may be combined with freezing with liquid nitrogen or application of phenol. Bony defects require autogenous or allogenic local graft and, depending on the degree of subchondral erosions, reconstruction of joint surfaces.8 Chondroblastomas have been successfully treated with CT-guided percutaneous radiofrequency ablation (Fig. 14-34E).69
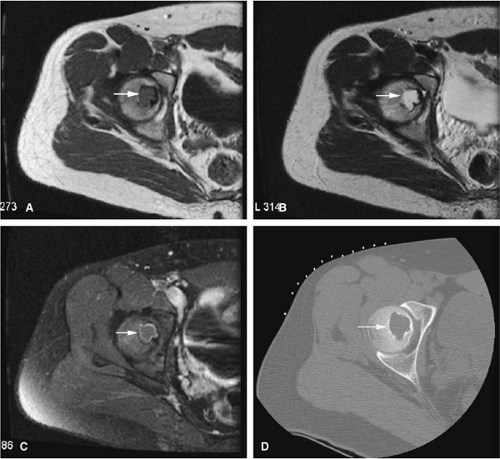 FIGURE 14-35 ● (A) On an axial T1-weighted image, a chondroblastoma of the femoral epiphysis (arrow) demonstrates intermediate signal intensity. (B) On an axial T2-weighted image, the chondroblastoma demonstrates increased signal intensity (arrow). (C) Contrast-enhanced axial fat-suppressed T1-weighted image shows mild peripheral enhancement (arrow). (D) Corresponding axial CT image shows a well-defined lytic lesion in the femoral epiphysis (arrow). |
Benign Fibrous and Related Lesions
Pearls and Pitfalls
Benign Fibrous and Related Lesions
Fibrous lesions demonstrate low signal intensity on T1- and intermediate to high signal intensity on T2-weighted images.
Central fat signal can be seen during involution of lesions.
Periosteal desmoids likely occur from traction on inserting muscle groups and should not be biopsied.
Fibroxanthoma
Fibroxanthoma, fibrous cortical defect, and nonossifying fibroma are terms used to describe histologically similar lesions composed of spindle-shaped fibroblasts, giant cells, and foam (xanthomatous) cells.
Fibrous Cortical Defect
Fibrous cortical defects, histologically identical to nonossifying fibromas, demonstrate low to intermediate signal intensity on T1-weighted images and low to intermediate signal intensity on fat-suppressed T2-weighted fast spin-echo images (Fig. 14-36). The increased signal intensity observed on T2-weighted images is secondary to T2 prolongation in the varied cellular constituents (e.g., fibrous stroma, multinucleated giant cells, foam cells, cholesterol crystals, stromal red blood cells in hemorrhage).40 Fibrous cortical defects have a predilection for the diaphyses of long bones.8
Nonossifying Fibroma
Nonossifying fibromas are frequently found in the long bones of children and are thought to represent one end of the spectrum of benign cortical defects
with encroachment on the medullary cavity (Fig. 14-37). Histologically, both nonossifying fibromas and fibrous cortical defects are composed of spindle-shaped fibroblasts arranged in an interlacing pattern. Unlike the fibrous cortical defect, nonossifying fibromas are more commonly found in the metaphyseal area.8 On T1-weighted images, these lesions are usually low in signal intensity and have a lobulated contour with an eccentric epicenter. T2, fat-suppressed T2-weighted fast spin-echo, or STIR images may demonstrate areas of hyperintensity (Fig. 14-38). Nonossifying fibromas may also display a central area of fat signal intensity isointense to adjacent marrow, especially during healing or involution. The Jaffe-Campanacci syndrome is characterized by multiple nonossifying fibromas with extraskeletal congenital anomalies such as café-au-lait spots, mental retardation, hypogonadism or cryptorchidism, and cardiovascular malformations (Fig. 14-39).
with encroachment on the medullary cavity (Fig. 14-37). Histologically, both nonossifying fibromas and fibrous cortical defects are composed of spindle-shaped fibroblasts arranged in an interlacing pattern. Unlike the fibrous cortical defect, nonossifying fibromas are more commonly found in the metaphyseal area.8 On T1-weighted images, these lesions are usually low in signal intensity and have a lobulated contour with an eccentric epicenter. T2, fat-suppressed T2-weighted fast spin-echo, or STIR images may demonstrate areas of hyperintensity (Fig. 14-38). Nonossifying fibromas may also display a central area of fat signal intensity isointense to adjacent marrow, especially during healing or involution. The Jaffe-Campanacci syndrome is characterized by multiple nonossifying fibromas with extraskeletal congenital anomalies such as café-au-lait spots, mental retardation, hypogonadism or cryptorchidism, and cardiovascular malformations (Fig. 14-39).
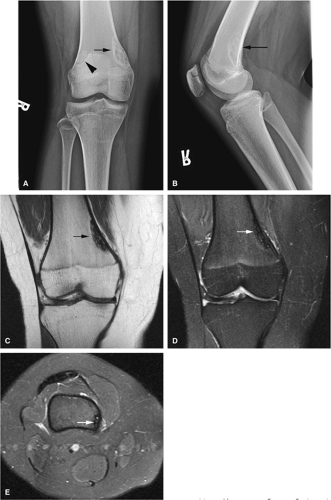 FIGURE 14-36 ● Anteroposterior (A) and lateral (B) radiographs show a fibrous cortical defect with a sclerotic border (arrows) in the posterior femoral cortex. A bipartite patella is incidentally noted on the anteroposterior radiograph (arrowhead). The defect demonstrates low signal on coronal T1-weighted (C) and coronal (D) and axial (E) fat-suppressed T2-weighted images (arrows). |
Gadolinium has been used to enhance the peripheral border in fibrous metaphyseal defects.70 Benign fibrous histiocytomas, also histologically similar to nonossifying fibromas, are present in an older population and may be associated with symptoms of bone pain and local recurrence after treatment.66 Asymptomatic fibrous cortical defects and nonossifying fibromas do not require treatment.8 A pathologic fracture may occur through a nonossifying fibroma.
Ossifying Fibroma
Ossifying fibromas are benign fibro-osseous lesions that most commonly arise in the facial bones
of young females.40 These lesions are well demarcated and therefore amenable to surgical curettage and enucleation. The histologic features of this lesion consist of random trabecular woven bone or dystrophic calcification set in a fibrous stroma.
of young females.40 These lesions are well demarcated and therefore amenable to surgical curettage and enucleation. The histologic features of this lesion consist of random trabecular woven bone or dystrophic calcification set in a fibrous stroma.
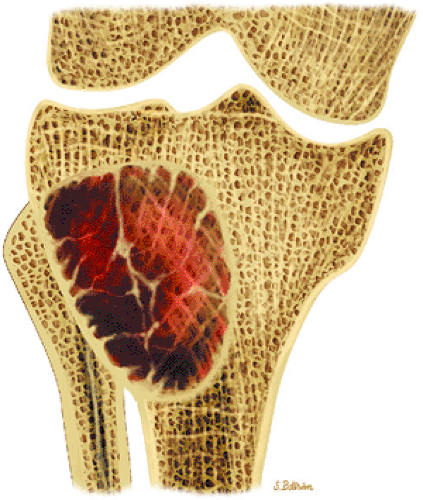 FIGURE 14-37 ● Coronal graphic illustration demonstrates a well-defined nonossifying fibroma of the proximal tibia in reddish-brown. Note the sclerotic scalloped borders. |
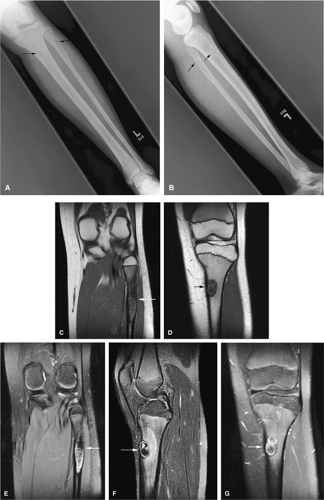 FIGURE 14-38 ● Anteroposterior (A) and lateral (B) radiographs show nonossifying fibromas in the proximal tibia and fibula (arrows). Coronal T1-weighted images (C and D) demonstrate the low-signal-intensity sclerotic border (arrows). Corresponding coronal (E) and sagittal (F) fat-suppressed T2-weighted fast spin-echo images show areas of hyperintensity (arrows). A contrast-enhanced fat-suppressed T1-weighted image (G) shows mild peripheral enhancement (arrow). |
Periosteal Desmoid
The periosteal desmoid is a fibrous proliferation of the periosteum involving the posteromedial cortex of the medial femoral condyle. The sclerotic saucer-shaped lesion is usually hypointense on T1- and T2-weighted images. A distal femoral cortical irregularity, called linea aspera, is seen in a similar age group (10–20 years of age) and may be related to traction of the adductor magnus aponeurosis. This lesion may in fact represent a variant of the periosteal desmoid (Fig. 14-40). Biopsy should not be performed on periosteal desmoids, and they require no treatment.
Hyman et al. used MR imaging to identify an excavation of the distal femoral metaphysis corresponding to the origin of the medial head of the gastrocnemius muscle.71 Stress-induced remodeling was inferred by the presence of inflammation along the floor of the excavation. The high-signal-intensity edema associated with the inflammation could be mistaken for a malignant bone tumor on T2-weighted images.
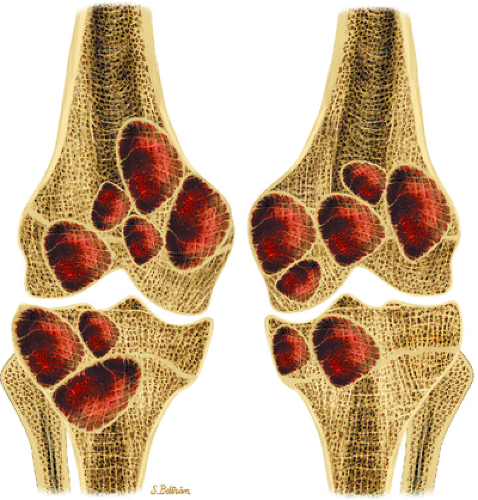 FIGURE 14-39 ● Coronal graphic illustration of the knees shows multiple bilateral nonossifying fibromas in a patient with Jaffe-Campanacci syndrome. Patients with this syndrome also have extraskeletal abnormalities, such as café-au-lait spots, mental retardation, and hypogonadism. |
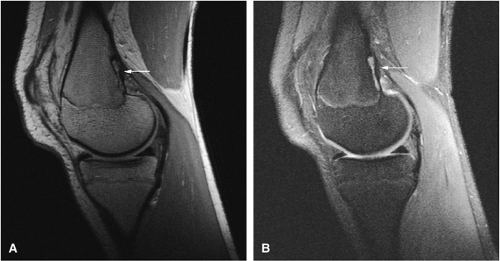 FIGURE 14-40 ● Femoral cortical irregularity distal to the linea aspera (arrows). This area of cortical roughening is usually located medially, along the posterior femoral cortex, as shown on a sagittal proton density-weighted image (A) and a fat-suppressed T2-weighted image (B). Both the periosteal desmoid and distal femoral cortical irregularity may resemble a fibrous cortical defect. |
Fibrous and Osteofibrous Dysplasia
Both monostotic fibrous dysplasia and osteofibrous dysplasia demonstrate low signal intensity on T1-weighted images and intermediate to increased signal intensity on T2-weighted images (Fig. 14-41). The lesions are bordered by a thick, low-signal-intensity sclerotic border, and the homogeneous increased signal intensity seen on T2-weighted images is less than that of fluid (Fig. 14-42). The femoral neck is a common location for monostotic fibrous dysplasia. In 10% to 20% of patients the skull and facial bones are involved (Fig. 14-43). The lesions in polyostotic fibrous dysplasia are similar, but it is a more aggressive condition. The shepherd—s crook deformity is
caused by a pathologic fracture at the femoral neck (Fig. 14-44). Treatment of fibrous dysplasia involves cortical grafting or implant fixation to stabilize the long bone.8
caused by a pathologic fracture at the femoral neck (Fig. 14-44). Treatment of fibrous dysplasia involves cortical grafting or implant fixation to stabilize the long bone.8
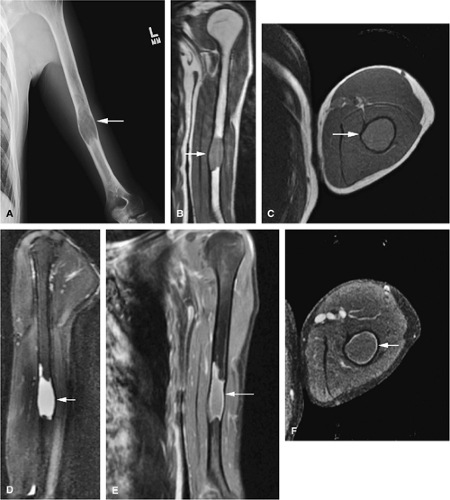 FIGURE 14-41 ● Monostotic fibrous dysplasia of the humerus. Anteroposterior radiograph (A) demonstrates an expansile lesion involving the humeral diaphysis (arrow). Fibrous tissue expansion of the medullary cavity is intermediate in signal intensity (arrows) on coronal T1-weighted image (B). Fibrous tissue expansion of the medullary cavity is intermediate in signal intensity on axial (C) T1-weighted image (arrow) and high in signal intensity (arrow) on a sagittal fat-suppressed T2-weighted fast spin-echo image (D). Fat-suppressed coronal (E) and axial (F) T1-weighted images following the intravenous administration of gadolinium demonstrate peripheral enhancement (arrows). |
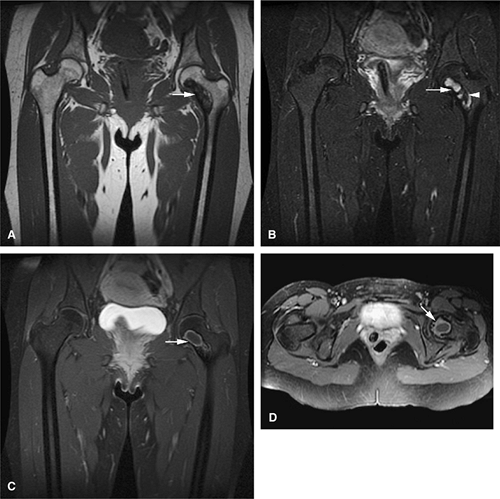 FIGURE 14-42 ● Monostotic fibrous dysplasia of the left femoral neck, a common location, demonstrates low signal intensity on a coronal T1-weighted image (A) and increased signal intensity on a fat-suppressed T2-weighted fast spin-echo image (B) (arrows). Note the areas of lower signal intensity on the fat-suppressed T2-weighted image (arrowhead). Coronal (C) and axial (D) fat-suppressed T1-weighted images following the intravenous administration of gadolinium demonstrate peripheral enhancement (arrows). |
The intracortical cystic lesions of osteofibrous dysplasia (Kempson-Campanacci lesion) may mimic adamantinoma and demonstrate heterogeneity on T2-weighted images. Osteofibrous dysplasia is a benign lesion with a predilection for the tibia in children, affecting the proximal to mid-segment of the anterior tibial cortex. Anterior bowing, cortical disruption, and medullary cavity involvement may occur (Fig. 14-45). Anterior tibial cortical disruption may be associated with reactive muscle edema and present with anterior compartment-like symptoms (Fig. 14-46). Fat-suppressed T2-weighted fast spin-echo or STIR sequences are sensitive to these soft-tissue changes.
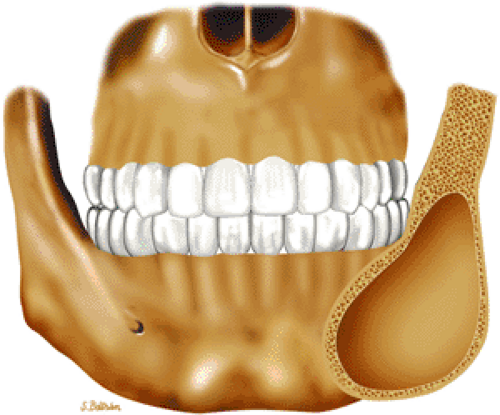 FIGURE 14-43 ● Fibrous dysplasia of the facial bones. Coronal graphic illustration shows an expansile, well-defined lesion involving the angle of the mandible. |
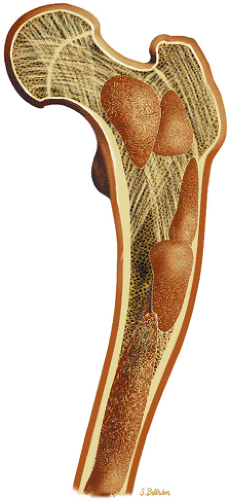 FIGURE 14-44 ● Coronal graphic illustration shows bowing deformity of the proximal femur (shepherd—s crook deformity). Note multiple lucent lesions of polyostotic fibrous dysplasia involving the femur. |
 FIGURE 14-45 ● Osteofibrous dysplasia of the tibia is shown in blue on a sagittal graphic illustration. Surrounding sclerosis is shown in light brown. Note the anterior bowing of the tibia, often seen in osteofibrous dysplasia. |
 FIGURE 14-46 ● Osteofibrous dysplasia with cortical destruction and reactive edema within the tibialis anterior muscle group. This lesion presented with symptoms of anterior compartment syndrome. (A) T1-weighted and (B) fat-suppressed T2-weighted fast spin-echo coronal images. (C) T1-weighted, (D) fat-suppressed T2-weighted fast spin-echo (arrow), and (E) STIR axial images (arrow). |
 FIGURE 14-47 ● Unicameral bone cyst of the calcaneus. Sagittal graphic illustration demonstrates a well-defined lytic lesion with intact adjacent cortex. |
Benign Tumors and Non-Neoplastic Lesions
Pearls and Pitfalls
Benign Tumors and Non-Neoplastic Lesions
Unicameral bone cysts demonstrate fluid signal on MR imaging without evidence of enhancement.
Unicameral and aneurysmal bone cysts can be treated with CT-guided percutaneous injections.
Fluid–fluid levels are characteristic of aneurysmal bone cysts.
Secondary aneurysmal bone cysts can be seen in a variety of benign and malignant tumors.
Intraosseous hemangiomas are characterized by fat signal intensity.
Intraosseous lipomas follow the signal intensity of fat on all pulse sequences.
Langerhans cell histiocytosis is a “great imitator” of various benign and malignant lesions.
Unicameral Bone Cyst
In patients younger than 16 years of age, unicameral bone cysts are most likely to occur in the proximal humerus or femur, in proximity to the cartilaginous growth plate, and they may recur following surgical removal. Involvement of the calcaneus is more common in older patients (Fig. 14-47). Malignancy in a solitary unicameral bone cyst has been reported, but it is extremely rare. Treatment includes steroid injection (Fig. 14-48) or curettage and bone grafting.8
The unicameral bone cyst has a characteristic MR appearance:
On T1-weighted images, it is well defined and demonstrates low signal intensity secondary to simple fluid within the cyst.
On T2-weighted images, the fluid contents demonstrate uniformly increased signal intensity (Fig. 14-49).
Internal hemorrhage may alter T1 and T2 signal characteristics.
A low-signal-intensity peripheral border representing reactive sclerosis often demarcates this lesion.66
Although fracture may occur as a complication, there should be no associated soft-tissue mass.
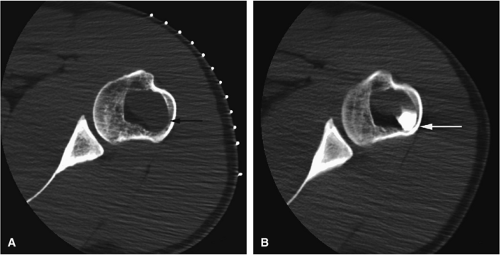 FIGURE 14-48 ● (A) Axial CT images from a percutaneous CT-guided steroid injection demonstrate a well-defined lytic lesion in the humeral metaphysic (arrow). (B) Corticosteroid mixed with iodinated contrast is seen within the lesion following therapy (arrow). |
Aneurysmal Bone Cyst
The aneurysmal bone cyst is an expansile, blood-filled lesion that is osteolytic on conventional radiographs or CT (Fig. 14-50). In the hip or pelvis, aggressive cortical expansion and soft-tissue extension may simulate a malignant process or pseudotumor. Aneurysmal bone cysts, which occur in children and young adults (approximately 80% occur in patients younger than 20 years of age), are most commonly found in the posterior osseous elements of the vertebrae (Fig. 14-51) and the shafts of the long bones.72 They are reported to involve the femur in 13% of cases and the innominate bone in 9% of cases. Aneurysmal bone cysts
contain varying amounts of blood, fluid, and fibrous tissue. In many cases, they arise from preexisting bone lesions such as a giant cell tumor, osteoblastoma, chondroblastoma, fibrous dysplasia, or chondromyxoid fibroma.72 Histologic features include blood-filled channels supported by a fibrous septum, which contains multinucleated giant cells and osteoid. Careful microscopic assessment is required to rule out the elusive telangiectatic variant of osteosarcoma, which may mimic an aneurysmal bone cyst both clinically and radiographically.72,73,74
contain varying amounts of blood, fluid, and fibrous tissue. In many cases, they arise from preexisting bone lesions such as a giant cell tumor, osteoblastoma, chondroblastoma, fibrous dysplasia, or chondromyxoid fibroma.72 Histologic features include blood-filled channels supported by a fibrous septum, which contains multinucleated giant cells and osteoid. Careful microscopic assessment is required to rule out the elusive telangiectatic variant of osteosarcoma, which may mimic an aneurysmal bone cyst both clinically and radiographically.72,73,74
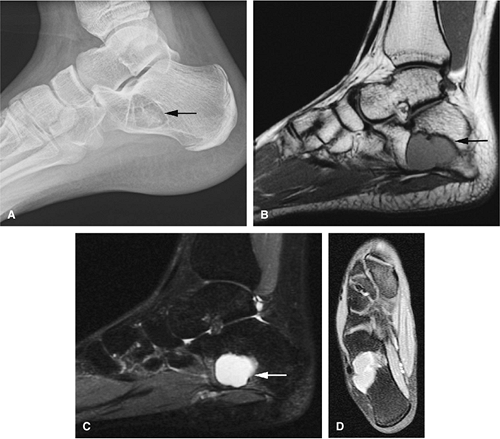 FIGURE 14-49 ● Unicameral bone cyst (arrow) of the calcaneus, a common location. (A) Lateral radiograph demonstrates a well-defined lytic lesion (arrow). The cystic contents demonstrate low to intermediate signal on a sagittal T1-weighted image (B) and high signal on a sagittal fat-suppressed T2-weighted fast spin-echo image (C). (D) No enhancement is visualized on an axial fat-suppressed T1-weighted image following the intravenous administration of gadolinium. |
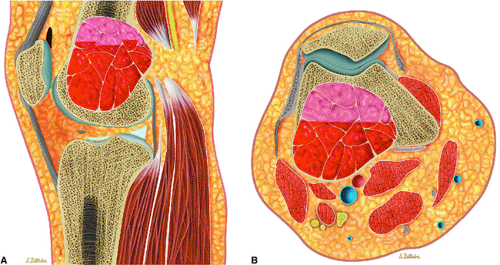 FIGURE 14-50 ● Aneurysmal bone cyst of the distal femur. (A) Sagittal and (B) axial graphic illustrations show an expansile blood-filled lesion with fluid–fluid levels in red. |
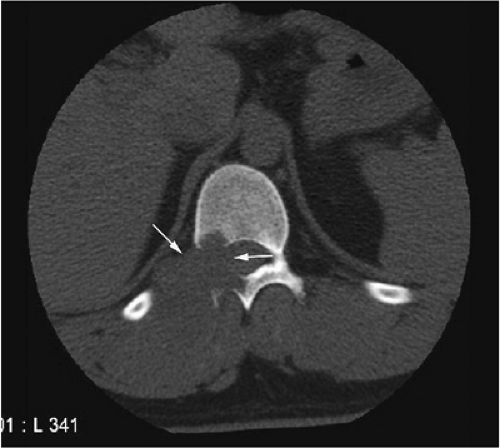 FIGURE 14-51 ● Aneurysmal bone cyst of the spine. An axial CT image of the lower thoracic spine demonstrates a lytic expansile lesion arising from the posterior elements of a thoracic vertebral body (arrows). |
The favored theory regarding the pathogenesis of aneurysmal bone cysts suggests an altered vascular flow resulting in local circulatory failure.72 According to the Armed Forces Institute of Pathology (AFIP), aneurysmal bone cysts occur secondary to hemorrhagic “blowout” in a preexisting lesion.75 In the AFIP classification, juxtacortical lesions are grouped with cystic subperiosteal giant cell tumors or subperiosteal myositis ossificans. Central lesions, attributed to secondary changes in preexisting lesions, are identified by the predominant lesion or tumor histology. Intramedullary lesions, without any associated preexisting lesion, are thought to represent giant cell tumors of bone.
On MR imaging, aneurysmal bone cysts tend to be circumscribed but heterogeneous, with areas of both low and high signal intensity.76 The following findings are typical:
The expansile lesion may have internal septations, fluid–fluid levels, and areas of bright signal intensity on both T1- and T2-weighted images, depending on the chronicity of the associated hemorrhage (Figs. 14-52 and 14-53).77
The fluid–fluid level probably represents layering of uncoagulated blood within the lesion.78Related posts:

Stay updated, free articles. Join our Telegram channel

Full access? Get Clinical Tree


