Marrow Imaging
Miriam A. Bredella
David W. Stoller
There is a range of advantages and disadvantages to the variety of imaging techniques used in bone marrow assessment:
Conventional radiographic techniques are insensitive to many marrow infiltrations and tumors and are limited in providing accurate bone marrow characterization. As a result, there is frequently significant trabecular or cancellous destruction before disease progression is detected on standard radiographs.
Computed tomography (CT), although accurate for detecting gross metastatic disease of the spine, has limited sensitivity in imaging primary and metastatic marrow neoplasms. Changes in the CT attenuation value of medullary bone can be nonspecific and do not occur until pathology is well established.
Radionuclide bone scanning, the standard method for screening the skeleton for metastatic disease, is relatively insensitive to certain marrow neoplasms, such as leukemia, lymphoma, and myeloma. In addition, very aggressive metastatic tumors may yield false-negative findings on radionuclide scans.
Positron emission tomography (PET) using 2-F18-fluoro-2-deoxy-D-glucose (FDG) has a high sensitivity for the identification of early bone marrow infiltration by malignant neoplasms.1,2
Magnetic resonance (MR) imaging has the major benefit of imaging bone marrow directly. Multiplanar MR imaging provides the excellent spatial and contrast resolution necessary to differentiate the signal intensities of fatty (yellow) marrow elements from hematopoietic (red) marrow elements. MR imaging has thus become the diagnostic gold standard for diseases that involve or target the bone marrow.
Normal Bone Marrow
Pearls and Pitfalls
Normal Bone Marrow
Be aware of normal variations of red marrow patterns and recognize them as normal.
Distribution of red marrow can vary from person to person but is usually symmetric in the same person.
Subchondral red marrow can be seen in the proximal epiphyses of the humerus and femur.
T1-weighted and STIR sequences are most useful in detecting marrow infiltrative processes.
Normal red marrow signal is equal to or higher than muscle or disk on T1-weighted images.
Abnormal marrow signal is equal to or lower than muscle or disk on T1-weighted images.
Consider whole-body MR imaging for metastatic or myeloma survey and for staging of malignant neoplasms and lymphoma.
The normal distribution and MR appearance of bone marrow changes with age.3,4,5,6 An understanding of these variations is important in examining MR patterns in appendicular skeletal locations and determining whether they are potential disease processes or normal variations of marrow. The general status of marrow in adults is best assessed on MR images in the coronal plane of the pelvis and sagittal plane of the spine, unless symptoms indicate disease elsewhere.
Structure, Function, and Development
The bone marrow is the site of production of circulating blood elements (i.e., granulocytes, erythrocytes, monocytes, platelets, and uncommitted lymphocytes). Sustained cellular production is dependent on stem cells, which exhibit properties of both continuous self-replication and differentiation into specific cell lines. The tremendous flexibility of stem cells in the production of blood cellular elements is related to their proliferative activity, which is dependent on the microenvironment (i.e., cell-to-cell interaction) and on humoral feedback.7,8 The earliest stem cells give rise to more restricted stem cells, which exhibit less multipotentiality and decreased ability for self-replication. With further differentiation, committed progenitors are formed and mature along a single hematopoietic pathway. In the presence of colony-stimulating factors, these progenitor cells can be grown in vitro to form cell colonies known as colony-forming units.9
The marrow cavity is divided into compartments by plates of bony trabeculae. There are two types of marrow, red and yellow.
Red (hematopoietic) marrow is hematopoietically active bone marrow located within the spaces defined by the trabeculae. It is semifluid in consistency and is composed of the various hematopoietic stem cells and their progeny in assorted stages of granulocytic, erythrocytic, and megakaryocytic development. Uncommitted lymphocytes, as well as lymphoid nodules, are also present in the red marrow. The hematopoietic cellular elements are supported by reticulum cells and fat cells. Red marrow contains approximately 40% water, 40% fat, and 20% protein.6 The vascular system consists of centrally located nutrient arteries that send out branches that terminate in capillary beds within the bone. Postcapillary venules re-enter the marrow cavity and coalesce to form venous sinuses. Hematopoietic cell production follows the vascular arrangement, forming active hematopoietic islands between the sinusoids. Bone marrow lacks lymphatic channels.10,11
Hematopoietically inactive marrow, or marrow not involved in blood cell production, is referred to as yellow marrow. Because yellow marrow is predominantly composed of fat, it is sometimes called fatty marrow. It contains approximately 15% water, 80% fat, and 5% protein.
Red to Yellow Marrow Conversion
Hematopoiesis begins in utero, at approximately 19 gestational days, within the yolk sac. By week 16 of gestation, the main sites of fetal hematopoiesis are the liver and spleen. After week 24 of gestation, marrow becomes the main organ of hematopoiesis. At birth, active hematopoiesis (i.e., red marrow) is present throughout the entire skeleton, including the epiphyses (Fig. 13.1). Normal physiologic conversion of red to yellow marrow occurs during growth in a predictable and orderly fashion12 and is complete by 25 years of age, when the adult pattern is established (Fig. 13.2). Although distribution of red marrow varies from person to person, it is usually symmetric in the same person.
The cellularity of red marrow varies with age and site. In the newborn, red marrow cellularity approaches 100%. In the adult, fat cells generally occupy approximately 50% of active red marrow. However, the cellularity of marrow also varies with site. For example, at 50 years of age, the average cellularity is 75% in the vertebrae, 60% in the sternum, and 50% in the iliac crests.11,12 In the adult, red marrow is primarily concentrated
in the appendicular and axial (i.e., spinal) skeletons. The prevalence of fatty marrow within the spine increases with advancing age. In osteoporosis, fat replacement is associated with loss of cancellous (i.e., trabecular) bone. Early in the normal ossification process, yellow marrow replaces the hyaline cartilage template in the epiphysis and apophysis.
in the appendicular and axial (i.e., spinal) skeletons. The prevalence of fatty marrow within the spine increases with advancing age. In osteoporosis, fat replacement is associated with loss of cancellous (i.e., trabecular) bone. Early in the normal ossification process, yellow marrow replaces the hyaline cartilage template in the epiphysis and apophysis.
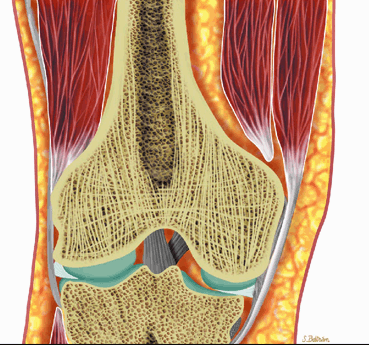
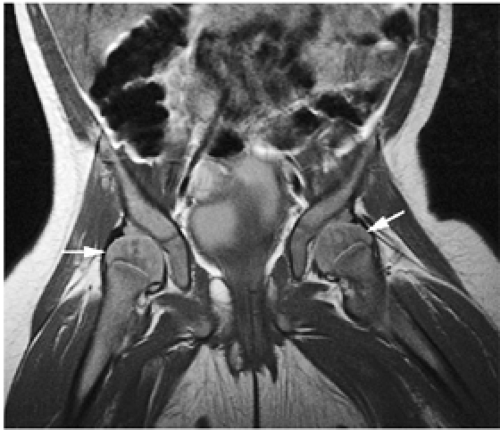 FIGURE 13.1 ● Normal red marrow in an infant. Coronal T1-weighted image demonstrates normal red marrow involving the entire skeleton, including the epiphyses (arrows). |
 FIGURE 13.2 ● Bone marrow conversion from birth to adulthood. Graphic illustration demonstrating marrow distribution as a function of age with conversion of red marrow to yellow marrow. |
Reconversion of Yellow to Red Marrow
Reconversion of yellow to red marrow occurs in the reverse order from that seen in the normal, physiologically maturing skeleton. In other words, it starts in the axial skeleton and proceeds in a proximal-to-distal direction in the appendicular skeleton. For example, hematopoiesis occurs in the proximal metaphysis in the premature skeleton; therefore, reconversion of long bones occurs first in the proximal metaphysis and then in the distal metaphysis. The process of reconversion of yellow to red is triggered by the body—s demand for increased blood cell production, which may be caused by stress, anemia, or marrow replacement. The extent of reconversion depends on the duration and severity of the initiating cause. Relatively extensive reconversion is seen in long-standing chronic anemias such as sickle cell anemia or thalassemia major (Fig. 13.3).13 This process favors sites of residual red marrow stores.
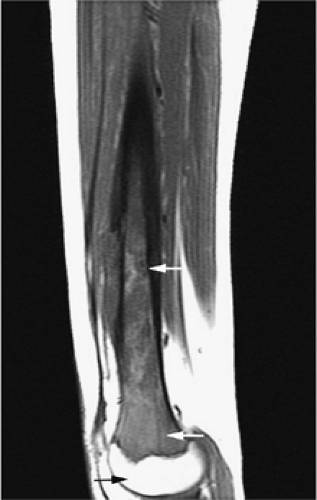 FIGURE 13.3 ● Reconversion of yellow marrow to red marrow in a patient receiving chemotherapy for Ewing sarcoma. This sagittal T1-weighted image demonstrates red marrow involving the metaphysis and diaphysis (white arrows), whereas yellow marrow remains present in the epiphysis (black arrow). |
MR Appearance of Normal Marrow
In yellow marrow, hydrogen protons exist in hydrophobic side groups with short T1 relaxation times.14,15 The bright signal intensity of yellow marrow reflects the shortened T1 relaxation time of fat. The differences in signal intensities of yellow and red marrow result primarily from differences in their proportional amounts of water and fat; the proportions are approximately equal in red marrow, but there is significantly more fat (80%) in yellow marrow.6 The role of protein, which constitutes 20% of red marrow and 5% of yellow marrow, in modifying signal intensity is less clear, because protein may exist either in a bound state, with a long T1 relaxation time, or in solution, with a short T1 relaxation time.14,16
The normal MR appearance of red and yellow marrow includes the following features:
On T1-weighted and conventional T2-weighted images, yellow marrow demonstrates the bright signal intensity of fat.
Yellow marrow is low signal intensity on short inversion time recovery (STIR) images, in which signal from fat is nulled (Fig. 13.4). The signal intensity of fat marrow is also reduced on fat-suppressed T2-weighted spin-echo or fat-suppressed T2-weighted fast spin-echo sequences,17 and it appears darker when using fat-suppression techniques with sequences having longer repetition times (TR) and echo times (TE).
Red marrow demonstrates low signal intensity on T1-weighted images, reflecting its increased water content, and intermediate signal intensity with progressive T2 weighting.
Normal red marrow demonstrates T1 signal that is equal to or higher than adjacent muscle or intervertebral disks.
Red and yellow marrow contrast differences become less distinct on heavily T2-weighted protocols with TR greater than 2,500 msec.
With suppression of the signal from fat on STIR images, areas of red marrow demonstrate higher signal intensity than areas of yellow marrow.
As discussed earlier, the maturing skeleton undergoes a process of red to yellow marrow conversion beginning in the hands and feet and progressing to the peripheral and then central skeleton.4,6 In the long bones of the appendicular skeleton, red marrow conversion occurs first in the diaphysis and progresses to the distal and then proximal metaphysis18 (Fig. 13.5). In the femoral diaphysis, high-signal-intensity fatty marrow is observed as early as 3 months of age, with marrow heterogeneity at 12 months, and homogeneous high signal intensity after 5 years of age.19 In the adult, the proximal two thirds of the femur and humerus contain a higher concentration of red marrow stores (Fig. 13.6), accounting for the appearance on T1-weighted images of low-signal-intensity inhomogeneity against a background matrix of fatty marrow of bright signal intensity.20 Uniform fatty marrow within the long bones of the humerus or femur, without any red marrow inhomogeneity, is within the spectrum of normal findings. Marrow heterogeneity in the pelvis tends to be most prominent in the acetabulum from birth to 24 years of age. In other locations, marrow signal intensity increases with age.21 In the sacrum, the lateral masses have a higher fat content and a more heterogeneous signal intensity than the vertebral bodies.22 In
addition, the sacral lateral masses demonstrate brighter signal intensity in male than in female subjects.
addition, the sacral lateral masses demonstrate brighter signal intensity in male than in female subjects.
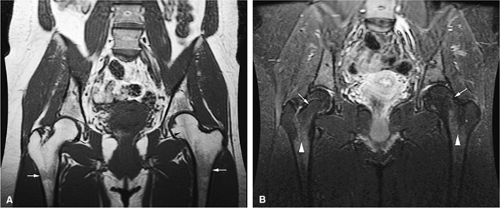 FIGURE 13.4 ● (A) Coronal T1-weighted image shows normal yellow marrow of the proximal femurs (black arrows). Residual red marrow in the femoral metaphyses is of intermediate signal (white arrows). (B) Yellow marrow is dark on the corresponding coronal STIR image (arrows). Areas of red marrow demonstrate higher signal intensity than areas of yellow marrow (arrowheads). |
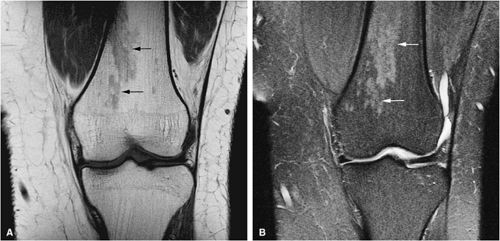 FIGURE 13.5 ● (A) Residual metaphyseal red marrow is seen as patchy regions of low signal intensity (black arrows) on a T1-weighted coronal image. (B) The red marrow is hyperintense on the corresponding fat-suppressed T2-weighted fast spin-echo image (white arrows). |
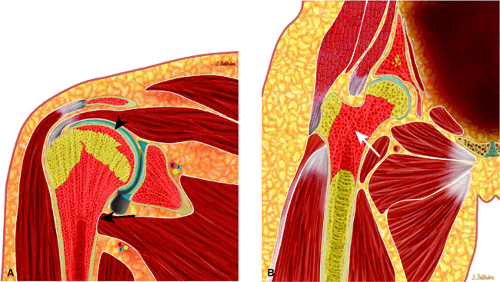 FIGURE 13.6 ● Normal red marrow. Coronal graphic illustrations of the shoulder (A) and hip (B) demonstrate the normal appearance of residual red marrow in the humeral (black arrow) and femoral (white arrow) metaphyses. Note the curvilinear distribution of red marrow involving the medial humeral head (black arrowhead), a normal finding. |
Mirowitz23 described extension of hematopoietic marrow (residual or reconverted) within the humeral epiphysis. This site, proximal to the humeral metaphysis, does not usually contain hematopoietic marrow,23 although its presence has also been noted in the proximal femoral epiphysis.24 Although hematopoietic bone marrow is not usually visualized within the epiphysis of long bones in adults, these findings are considered normal. Females are more likely to demonstrate epiphyseal hematopoietic marrow, a finding that correlates with a more prominent pattern of hematopoietic marrow within the proximal humeral metaphysis. A curvilinear distribution of marrow usually involves the medial humeral head (see Fig. 13.6A), and central epiphyseal hematopoietic marrow, in a patchy or globular pattern, is less common. Small differences in the amount and distribution of red marrow from side to side are normal, but marked asymmetry is suspicious for a marrow-infiltrating disease process. Focal islands of yellow marrow are common in the spine around the central venous channels in the vertebral bodies (Fig. 13.7).
Marrow Imaging Techniques
Spin-Echo and Fast Spin-Echo Imaging
Since both benign and malignant disorders that target the marrow have long T1 and T2 values and high proton density, imaging protocols for marrow characterization use T1-weighted spin-echo sequences. T2-weighted spin-echo sequences have less contrast in the range of commonly used TRs (i.e., approximately 2,000 msec), and long TR and TE times (i.e., TR values of 2,000–3,000 msec and TE values greater than 80 msec) would be necessary to optimize contrast. However, since many lesions become isointense with marrow on intermediate-weighted sequences, T1-weighted images with TR values between 400 and 700 msec and short TEs (<30 msec) are required.
Lower contrast, as well as artifacts caused by moving high-signal-intensity fat, may degrade the diagnostic quality of conventional T1- and T2-weighted spin-echo images. Conventional MR imaging may also be of limited value when contrast is intrinsically low due to small differences in signal between tumors and adjacent fat, especially on long TR/TE sequences. The clinical usefulness of marrow MR imaging can be substantially expanded by combining T1-weighted spin-echo and STIR sequences. Fat-suppressed T2-weighted or fat-suppressed T2-weighted fast spin-echo techniques, however, have primarily replaced conventional non–fat-suppressed T2-weighted sequences in evaluating marrow pathology.17 Fast spin-echo imaging acquires multiple lines of K-space during a single TR. This makes it possible to keep imaging time relatively short when acquiring high-resolution T2-weighted images with ultralong TRs.25 With fast spin-echo pulse sequences, the initial 90° pulse is followed by the acquisition of 2 to 16 echoes. The echo-train length represents the number of echoes selected. Echo space is the time between each echo. Acquisition time is decreased by increasing the echo train. Because of the high fat signal intensity intrinsic to this sequence, fat suppression must be added to increase the sensitivity of this technique for routine use in bone marrow imaging. The blurring effect of fast spin-echo sequences is decreased with shorter echo-train lengths, longer TEs, and increased matrix resolution.
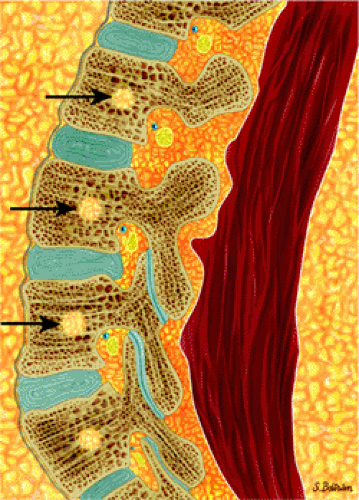 FIGURE 13.7 ● Sagittal graphic illustration of the lumbar spine shows normal marrow heterogeneity with foci of fatty marrow in the vertebral bodies (arrows). |
STIR Imaging
The STIR technique is highly T1-weighted. The initial 180° RF excitation pulse is followed by a standard spin-echo pulse sequence at a given inversion time (TI). The strength of the signal that is returned from the spin-echo sequence is proportional to the absolute magnitude of the Z component of the bulk magnetization vector at the instant of the 90° pulse; therefore, a TI can be determined for which fat, which has a short T1, will not emit a signal.
This type of inversion recovery technique (with a short TI) was initially used to eliminate the subcutaneous fat signal responsible for motion and breathing artifacts. It also suppresses the signal from normal medullary fat, which allows the signal emanating from abnormal tissues to be more easily
detected; it has therefore proven to be highly sensitive for diseases within the medullary space of bone. The following STIR characteristics give rise to the clinical advantages:
detected; it has therefore proven to be highly sensitive for diseases within the medullary space of bone. The following STIR characteristics give rise to the clinical advantages:
Additive T1 and T2 contrast
Marked suppression of the high signal from fat
Twice the magnetization range of spin-echo sequences
These characteristics produce extraordinarily high contrast that makes the lesion more conspicuous while preserving the low signal-to-noise ratio. By selecting inversion times that occur at the null point during the recovery of signal after an inverting 180° RF pulse, the signal from structures of known TI relaxation times can be selectively suppressed.
The STIR sequence described above suppresses the signal from fat, which is the predominant component of marrow in normal adults. T1 is prolonged in most pathologic conditions affecting the marrow, and the T1 of fatty marrow is short; therefore, there is excellent contrast on STIR images, a considerable advantage over routine spin-echo imaging.
The following findings are characteristic of STIR images:
Fat is black.
Combinations of red and yellow marrow are light gray (i.e., intermediate).
Most marrow tumors are bright white.
Although red marrow demonstrates increased signal intensity on STIR images, most pathologic conditions involving marrow replacement or infiltration generate greater signal intensities. Fibrous tissue, calcification, and hemosiderin deposits are low in signal intensity, whereas fluid, edema, or recent hemorrhage are bright. Muscle remains intermediate in signal intensity.
STIR sequences reflect the age-dependent differences in the percentage of hematopoietic marrow.
The fast spin-echo STIR technique decreases imaging time significantly and produces diagnostic accuracy comparable to that of conventional STIR sequences.25 Both fat-suppressed T2-weighted fast spin-echo and fast spin-echo STIR sequences used in conjunction with T1-weighted images represent the key imaging protocols for optimizing marrow tissue contrast.
Gradient-Echo Recall Imaging
Gradient-echo recall techniques have become increasingly popular, primarily because of their ability to increase the rate of data acquisition and decrease scan times. Parameters for gradient echo recall include the following:
The initial excitation pulse is an RF pulse that typically possesses a flip angle of less than 90°. If a 90° flip angle is used, the Z component of the bulk magnetization vector is zero after the excitation pulse, and a period of time on the order of T1 is needed for the Z component of the bulk magnetization vector to recover and to allow a second pulse sequence to generate significant signal. If the excitation pulse is less than 90°, however, the Z component of the bulk magnetization vector is not decreased to zero, and the subsequent excitation pulse can be separated from the first by a TR significantly less than T1. In addition, the resultant signal is maximized by using free induction decay for data acquisition instead of a standard SE, with its associated long TE and signal drop-off.
To balance phase shifts from the readout frequency gradient so that all phase shifts are only those specifically introduced by the phase and encoding gradients, the initial readout gradient is negative and cancels phase shifts introduced by the positive component of the frequency-encoded gradient during acquisition of the signal. A reversal occurs between the negative and positive gradient; thus, the term gradient reversal techniques is used.
By using partial flip angles, TR values can be markedly shortened. Because image acquisition time is directly proportional to the value of TR, marked time savings over SE techniques can be attained. However, because the contrast parameters sampled by the gradient-echo technique are predominantly T2*, the high contrast between soft tissues normally obtained by spin-echo techniques is not routinely seen on gradient-echo images. It is possible to select parameters to provide contrast somewhat similar to standard spin-echo imaging.
Gradient-echo techniques are sensitive to magnetic field inhomogeneities, chemical-shift frequencies, and magnetic susceptibility; therefore, they are prone to motion and distortion artifacts of tissue interfaces with different magnetic susceptibilities. Advantages of gradient-echo techniques include:
Effective T2 weighting
High resolution
Adequate signal-to-noise ratio without the need for interslice spacing
These advantages make this a useful complement to T1 spin-echo imaging. In addition, 3D Fourier transform volume acquisitions, which allow up to 120 images to a slice thickness of 0.7 mm, can be retrospectively reformatted. Susceptibility effects can be used to identify calcium or areas of hemorrhage.
The following findings are characteristic on gradient-echo recall images:
The low-signal-intensity contrast of gradient-echo images is not secondary to fat suppression, as with STIR images; therefore, many marrow neoplasms or infiltrative disease processes do not demonstrate increased signal intensity when compared with corresponding STIR images.
Red marrow stores do not demonstrate increased signal intensity on gradient-echo images and may be difficult to differentiate from fatty marrow.
A high proportion of trabecular bone in areas such as the epiphysis may further modify gradient-echo contrast (decreasing effective transverse relaxation times), resulting in decreased signal intensity in these areas.26
Chemical-Shift Imaging
Chemical-shift imaging is used to produce images that emphasize either the water or fat component of marrow by temporal separation of their respective returning MR signals.27 Red and yellow marrow differentiation is thus possible on T1-weighted
images. Differences in resonant frequencies of fat and water protons (3.5 ppm or 75–150 Hz) allow for temporal dephasing after RF pulse excitation. This property is used to develop water and fat images by emphasizing in-phase or out-of-phase tissue properties, thus suppressing fat or water signal.
images. Differences in resonant frequencies of fat and water protons (3.5 ppm or 75–150 Hz) allow for temporal dephasing after RF pulse excitation. This property is used to develop water and fat images by emphasizing in-phase or out-of-phase tissue properties, thus suppressing fat or water signal.
Magnetic Resonance Survey Evaluation
The protocol for an MR survey examination for marrow evaluation uses T1-weighted coronal images of the pelvis and proximal femurs, which are adult sites of red marrow concentration. These images are acquired with large (40 cm) fields of view to include assessment of lumbosacral spine marrow. Coronal STIR images are obtained to null fat signal and identify abnormal T1 or T2 prolongation. Fat-suppressed T2-weighted fast spin-echo sequences may be used when thin slice or multiplanar imaging is required in a limited period of time.
Components of an MR survey include:
Axial T1-weighted, fat-suppressed T2-weighted fast spin-echo or STIR images may be obtained at specific sites of suspected pathologic processes and are important in determining cross-sectional marrow involvement. T1-weighted images are particularly valuable in evaluating blastic processes, which are low in signal on STIR images.
Gadolinium-enhanced axial images may improve the visibility of lesions, especially in cases with soft-tissue or cord involvement.
Sagittal T1-weighted and STIR images are routinely acquired to evaluate suspected spinal malignancies.
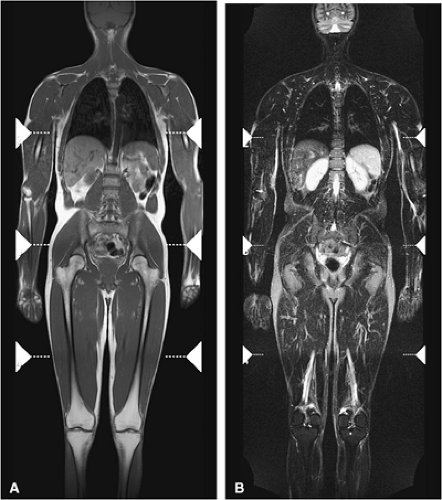 FIGURE 13.8 ● Whole-body MR imaging using coronal T1-weighted (A) and coronal STIR (B) sequences. Whole-body MRI is a sensitive and fast technique for evaluating the entire skeleton for abnormalities. |
Whole-Body MR Imaging
Whole-body fast MR imaging protocols have recently been shown to be an effective and time-efficient means of evaluating the entire skeleton for metastases, multiple myeloma, and staging of head and neck cancers and lymphoma.28,29,30,31 Studies comparing whole-body STIR MR imaging with bone scintigraphy in patients with suspected metastatic disease have shown that MR imaging is more sensitive than bone scintigraphy in lesion detection.31,32 Using fast MR sequences, whole-body MR imaging has been shown to be superior to bone scan in detecting lesions in the extremities, pelvis, and spine and provides additional important information about tumor morphology, tumor extension, and neurologic complications. Whole-body MR imaging is also used to detect response to therapy.33 Recent protocols have been shown to significantly decrease acquisition times,34,35,36 and most adults may be completely imaged from head to toe using a standard body coil (Fig. 13.8). In
comparing whole-body MR imaging using a rolling table platform with bone scintigraphy, excellent correlation between the two modalities in lesion detection has been demonstrated, and the examination time was 40 minutes or less.35
comparing whole-body MR imaging using a rolling table platform with bone scintigraphy, excellent correlation between the two modalities in lesion detection has been demonstrated, and the examination time was 40 minutes or less.35
Whole-body MR imaging can also be used to evaluate patients who present with metastatic disease and an unknown primary malignancy. Studies have shown that although whole-body MR imaging did not find the primary malignancy in all cases, it was competitive with other methods for detection of an unknown primary malignancy, including clinical examination, serology, conventional chest radiographs, bone scintigraphy, and CT.32,37
Bone Marrow Pathology
Malignant Disorders
Leukemia
Pearls and Pitfalls
Leukemia
Marrow involvement is usually diffuse in acute leukemia.
Relapse can present with patchy areas of marrow infiltration.
Abnormal marrow is darker than adjacent disk or muscle on T1-weighted images.
Be aware of post-therapy marrow changes (edema, fibrosis, fatty infiltration), which can simulate residual or metastatic disease.
Patients treated with G-CSF often develop reconversion from fatty to hematopoietic marrow.
Acute Leukemias
Acute leukemias are the 20th most common cause of cancer deaths at all ages and as a group represent the most common malignant disease in childhood. This aggressive group of disorders arises at the primitive stem cell level and is usually classified as either lymphocytic or myelogenous in type, based on the cytologic features of the blast cell. Further classification of the leukemic blasts, based on immunologic markers, cytogenetics, and electron microscopy, provides useful prognostic and therapeutic information. Eighty percent of patients with acute lymphocytic (lymphoblastic) leukemia are children, and 90% of patients with acute myelogenous leukemia are adults.38,39
The majority of acute leukemias arise de novo, although they may represent the final stage of a progression from a preleukemic state (i.e., myelodysplasia) or the end stage of a chronic myeloproliferative disorder such as chronic myelogenous leukemia. The distinguishing feature of the acute phase is the uncontrolled growth of poorly differentiated blast cells. These cells rapidly accumulate in the marrow, suppressing the normal marrow elements and resulting in the commonly observed clinical symptoms of fatigue, weakness, infections, and hemorrhage.
Marrow involvement in acute leukemia is typically diffuse (Fig. 13.9) and is characterized by monotonous infiltration of immature cells in a hypercellular marrow. In occasional cases of myeloblastic leukemia, particularly in very old patients, the marrow is normocellular or even hypocellular.12 Leukemic expansion in the marrow may elicit symptoms of skeletal tenderness or swelling of the larger joints.6 Transverse radiolucent bands involving the metaphyses can be seen in 40% to 53% of patients with acute lymphocytic leukemia. These “leukemic lines” represent leukemic infiltrates (Fig. 13.10).
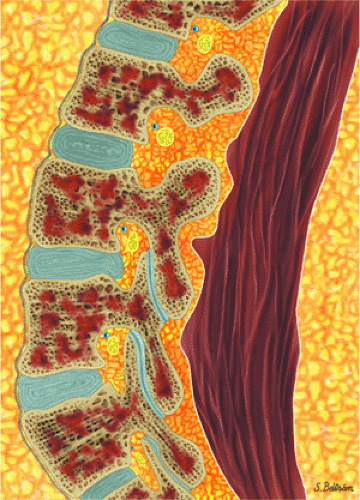 FIGURE 13.9 ● Sagittal graphic illustration shows diffuse leukemic bone marrow infiltration of the lumbar spine (shown in brown). |
Clinical Assessment
Clinical assessment of leukemia involves posterior iliac crest aspiration for bone marrow biopsy and peripheral blood smear analysis. Peripheral disturbances in hematopoiesis are often nonspecific and frequently occur prior to significant increases in marrow blast cells. In relapse, acute leukemia may present with focal or irregular areas of infiltration, which may represent surviving rests of treated tumor cells. This appearance is more patchy and irregularly marginated than that usually seen with focal metastatic disease.
MR Appearance
In both children and adults, leukemic marrow involvement is homogeneous, diffuse, and symmetric (Figs. 13.11 and 13.12).
Focal infiltration is more commonly seen in myelogenous leukemia (Fig. 13.13). The following findings are typical:
Focal infiltration is more commonly seen in myelogenous leukemia (Fig. 13.13). The following findings are typical:
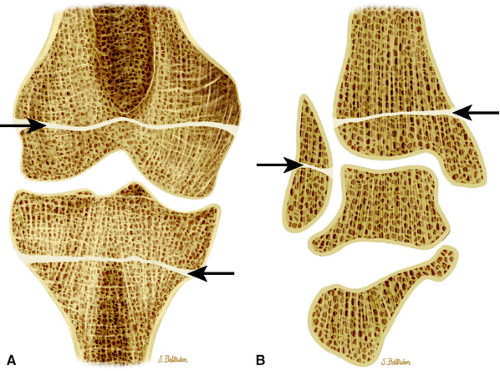 FIGURE 13.10 ● Coronal graphic illustrations of the knee (A) and ankle (B) show transverse lucent metaphyseal bands due to leukemic infiltration. “Leukemic lines” are seen in 40% to 53% of patients with acute lymphocytic leukemia. |
On T1-weighted images, leukemic hypercellularity is seen as low-signal-intensity replacement of higher-signal-intensity marrow fat (Fig. 13.14).
Due to the greater proportion of hematopoietic marrow in children, there is an overlap in the appearance of normal low-signal-intensity cellular hematopoietic marrow and low- to intermediate-intensity hypercellular leukemic marrow.
Quantitative measurements of T1 relaxation times have shown prolongation in patients with leukemia and
leukemia in relapse.40,41,42,43 These assessments, however, are not specific for the diagnosis of leukemia. Prolongation of the T1 relaxation time is also seen in metastatic rhabdomyosarcoma or neuroblastoma. Normal bone marrow has a T1 relaxation time of 350 to 650 msec. At initial diagnosis of leukemia or in leukemia in relapse, T1 relaxation times of 750 msec have been identified. Further studies are needed to confirm the clinical significance of differences in T1 values among initial diagnosis, remission, and relapse.44
Conventional T2-weighted images may show increases in signal intensity in acute leukemia. Unlike the situation with metastatic disease, however, T2-weighted images may not be sensitive to leukemic hypercellularity.
Quantitative measurement of T2 relaxation times in leukemia has not shown any significant difference from control marrow.
Chemical-shift imaging has also been used to identify pathologic marrow. Relative changes in the fat fraction show the greatest potential for understanding changes in bone marrow signal intensity and changes occurring with relapse.41,45 Chemical-shift imaging may be more useful in adult patients because of the greater difference in the fat and water fraction of bone marrow.
STIR techniques offer superior contrast for demonstrating increased signal intensity in leukemic marrow, exceeding that displayed by normal hematopoietic cells. Nulling of fat signal intensity facilitates the detection of both focal and diffuse leukemic infiltrates (Fig. 13.15).
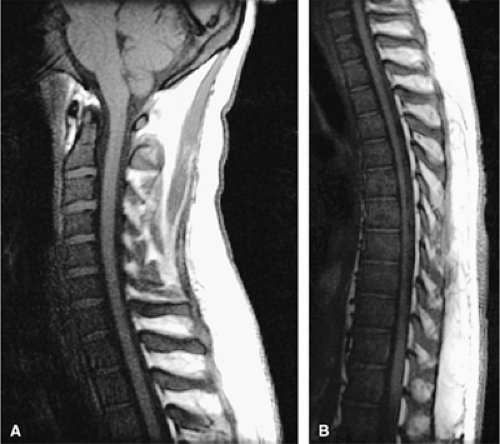 FIGURE 13.11 ● Diffuse low-signal-intensity leukemic infiltration of marrow occurs in acute lymphocytic leukemia, as seen on T1-weighted sagittal images of the cervical (A) and thoracolumbar (B) spine. |
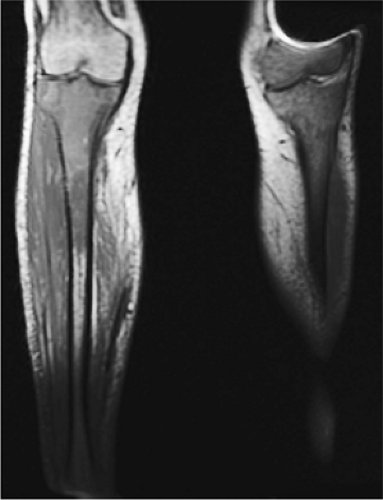 FIGURE 13.12 ● Abnormal low-signal-intensity marrow of the bilateral lower extremities due to leukemic infiltration, seen on a coronal T1-weighted image. Note extension of leukemic infiltrates into the epiphyses. |
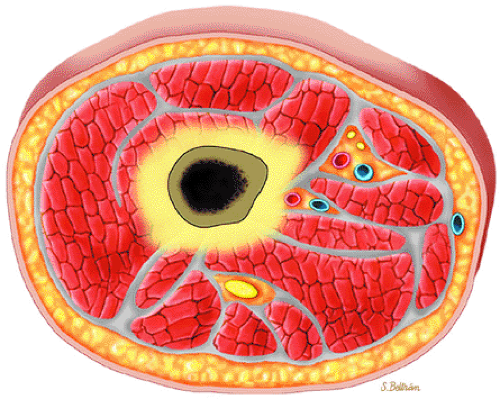 FIGURE 13.13 ● Axial graphic illustration demonstrates focal abnormal bone marrow of the femoral metaphysis with surrounding edema. |
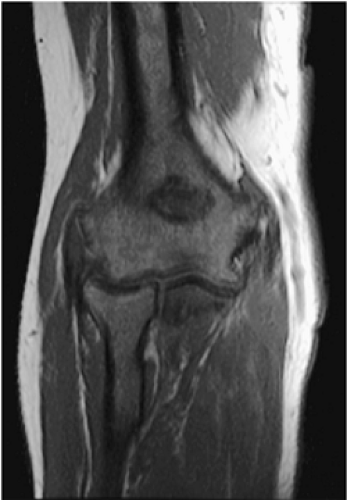 FIGURE 13.14 ● Low-signal-intensity leukemic infiltrates extending into the epiphysis are seen on this T1-weighted coronal image of the elbow. Extension of marrow inhomogeneity crossing the physis is an abnormal finding that may be seen in acute myelogenous leukemia. |
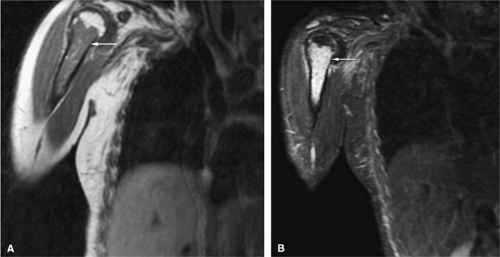 FIGURE 13.15 ● In a patient with acute lymphocytic leukemia, marrow infiltration demonstrates low signal intensity on a coronal T1-weighted image of the upper arm (A). The marrow infiltration is of high signal intensity on the corresponding coronal STIR image (B) (arrows). |
Post-Chemotherapy Appearance of Marrow
Patients with acute leukemia or chronic myelogenous leukemia in blast crisis are treated aggressively with myelotoxic drugs. This treatment results in cellular depletion (i.e., hypoplasia) of the marrow, accompanied by edema and fibrin deposition. Total depletion of the marrow may occur in a month or less, depending on the schedule of chemotherapy treatments and the sensitivity of the leukemic cells. As leukemic depletion progresses, fat cells (i.e., yellow marrow) regenerate. Normally, this phase of hypoplasia is followed by regeneration of hematopoietic elements (i.e., red marrow). Occasionally, however, extensive post-chemotherapy fibrosis develops. The fibrosis can be focal or widespread and may be accompanied by bone formation.46,47
Chemotherapy produces a spectrum of MR changes in normal and leukemia marrow, including metastatic disease. These changes include:
Marrow hypoplasia, characterized by the appearance of fatty marrow, demonstrates high signal intensity on T1-weighted images and intermediate signal intensity on T2-weighted images.
With chemical-shift imaging, it is possible to demonstrate sequential increases in bone marrow fat fractions in patients in clinical remission during chemotherapy treatment for acute leukemia.48
Marrow fibrosis demonstrates low signal intensity on T1- and T2-weighted images.
Reconversion of normal fatty marrow to hematopoietic marrow is seen as areas of decreased signal intensity on T1-weighted images and intermediate to mildly increased signal intensity on STIR images. When reconversion takes place adjacent to an area of signal intensity from fat in treated marrow, there is a reversal of the initial imaging signal intensity characteristics from pretreatment bone marrow to post-chemotherapy marrow (Fig. 13.16). Immediately after chemotherapy, marrow edema may falsely exaggerate the extent of disease progression. Follow-up examination can be performed to document a more accurate baseline.
In acute myeloid leukemia, MR imaging can demonstrate changes in bulk T1 during treatment that correlate with changes in bone marrow cellularity. However, these findings do not predict a favorable response to treatment.49
Chronic Leukemias
In contrast to acute leukemias, the malignant cell line in chronic leukemias has a limited capacity for differentiation and function in the initial stages of the disease process. As the disease progresses, thrombocytopenia and granulocytopenia develop, as they do in patients with acute leukemia. Compared with acute leukemias, the chronic leukemias are characterized by a long course with prolonged survival. As mentioned, chemotherapy, which is used aggressively in acute myelogenous leukemia and produces significant bone marrow hypoplasia or aplasia, has a secondary role in the management of chronic leukemias, which tend to have a more indolent course.
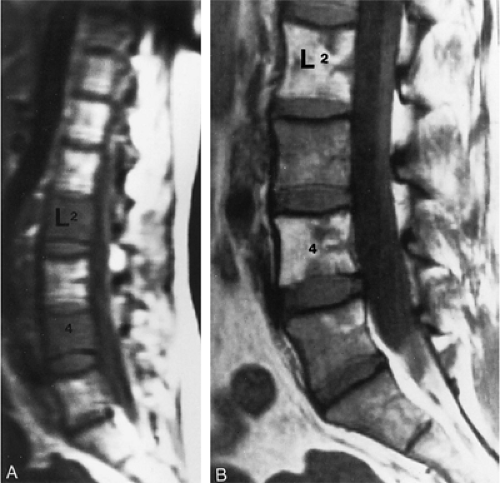 FIGURE 13.16 ● Marrow response to chemotherapy. T1-weighted images of the lumbar spine before chemotherapy (A) and after chemotherapy (B) for metastatic colon carcinoma. Metastatic disease demonstrates low signal intensity at L2 and L4 prior to chemotherapy. High-signal-intensity fatty replacement can be seen after chemotherapy. Adjacent uninvolved vertebral bodies also show a flip-flop in signal intensity as the red marrow is activated. |
Chronic Lymphocytic Leukemia
Chronic lymphocytic leukemia represents the most common form of leukemia in the United States; it is twice as common as chronic myelogenous leukemia. Ninety percent of patients with chronic lymphocytic leukemia are more than 50 years of age, and the disease shows a male predilection.50 Lymph node involvement is present in the majority of patients. Chronic lymphocytic leukemia is characterized by abnormal clones of immunologically incompetent lymphocytes. Patients may be asymptomatic or the disease may be stable at the time of diagnosis; in this case, treatment with alkylating agents is withheld. Although bone marrow analysis is not required to establish the diagnosis, examination reveals a hypercellular marrow with morphologically mature lymphocytes.
Myeloproliferative Disorders
The myeloproliferative disorders, a form of chronic leukemia, are a group of syndromes characterized by abnormal proliferation of bone marrow cell lines, which all arise from a common pluripotential stem cell. These stem cells produce the progenitor erythroid, granulocytic, monocytic, and megakaryocytic cell lines. The myeloproliferative syndromes include polycythemia vera, primary myelofibrosis with myeloid metaplasia, essential thrombocythemia, and chronic myelogenous leukemia. All of these disorders result in new clones that have a proliferative advantage over the normal marrow cells, which they gradually replace, and all have genetic instability, which predisposes to the development of an acute leukemia. The probability of progression to acute leukemia is greatest in chronic myelogenous leukemia, leading to chronic myelogenous leukemia in blast crisis.51
The diagnostic features of chronic myelogenous leukemia are the Philadelphia chromosome marker (a translocation between chromosomes 9 and 22) and decreased leukocyte alkaline phosphatase activity in circulating granulocytes. Chronic myelogenous leukemia in blast crisis represents 20% of acute leukemias and usually occurs in the fourth decade of life. Histopathologically, the bone marrow shows granulocytic hyperplasia with marked hypercellularity, an increased myeloid to erythroid cell ratio, and variable fibrosis (Fig. 13.17).50,52 Splenomegaly, which is sometimes massive, is found in nearly all cases. Chemotherapy does not increase survival time in chronic myelogenous leukemia, and induction of remission is not possible without bone marrow transplantation.
Splenomegaly, a leukoerythroblastic peripheral smear, and fibrotic marrow with occasional osteosclerosis characterize agnogenic myeloid metaplasia with primary myelofibrosis.53 The marrow fibrosis commonly results in a dry aspirate. Bone marrow biopsy demonstrates hypercellularity with an increased number of megakaryocytes, increased fibrosis, and decreased fat content. The cause of the myelofibrosis appears to be related to growth factor and factor IV produced by abnormal megakaryocytes.54 Vascular clumps of hematopoietic cells are found in distended marrow sinusoids. Increased hemosiderin may be present, secondary to repeated blood transfusions used to correct associated anemia or loss of iron uptake due to lack of effective erythropoiesis.
Secondary causes of myelofibrosis are numerous and include metastatic carcinoma, leukemia, lymphomas, tuberculosis, Gaucher disease, Paget—s disease, irradiation, and toxin exposure.51
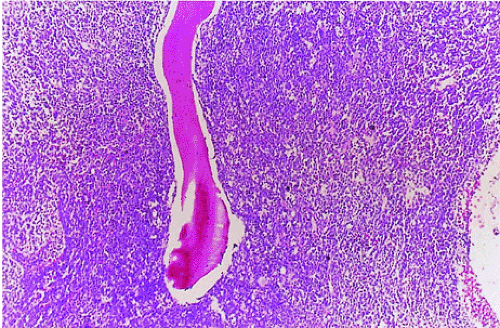 FIGURE 13.17 ● Chronic myelogenous leukemia. Hypercellular marrow consisting largely of myeloid precursors (H & E; original magnification × 100). |
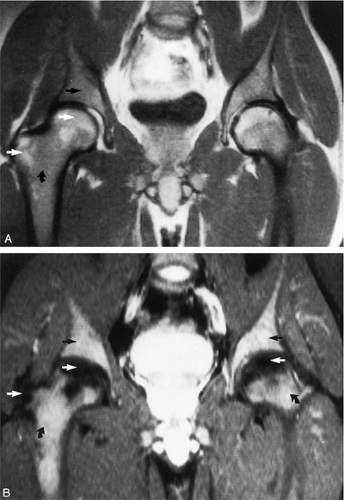 FIGURE 13.18 ● In chronic myelogenous leu-kemia, diffuse marrow involvement infiltrates regions of previous red marrow stores in the femurs (curved arrows) and acetabulum (straight black arrows) and demonstrates low signal intensity on a T1-weighted image (A) and high signal intensity on a corresponding STIR image (B). The sites where yellow marrow is spared (the greater trochanter and femoral epiphysis) demonstrate high signal intensity on the T1-weighted image and low signal intensity (from the nulled fat signal) on the STIR sequence (white arrows). |
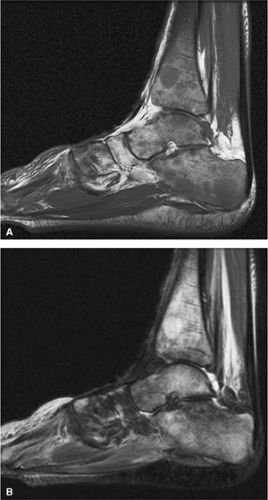 FIGURE 13.19 ● Diffuse marrow infiltration of the ankle in a patient with chronic myelogenous leukemia. Sagittal T1-weighted image (A) shows diffuse low-signal leukemic infiltration, which is bright on the corresponding sagittal STIR image (B). |
MR Appearance
Most chronic leukemias tend not to involve yellow marrow areas and in adults are characterized by a moderate to marked decrease in red marrow signal on T1-weighted images. Since red to yellow marrow conversion is complete in adults, leukemic involvement is more likely to be identified in the axial skeleton, pelvis, and proximal femurs (Fig. 13.18). In children, leukemic involvement is more likely to be identified in the more peripheral sites of red marrow stores, such as the metaphysis, with diaphyseal or epiphyseal extension. Marrow cellularity can also be noninvasively assessed with MR imaging.
The following MR findings are characteristic:
In the acute phase of chronic leukemia, particularly in chronic myelogenous leukemia patients in blast crisis, there is almost complete replacement of both red and yellow marrow areas. The decreased signal on T1-weighted sequences represents replacement of marrow fat by tumor cells, which have a significantly longer T1 relaxation time. On STIR images, tumor cells appear as areas of white on a black or gray background (Fig. 13.19).
Severe anemias or other marrow-invasive processes may have a similar MR appearance. Multiple myeloma is more variable but is generally less symmetrical, more patchy, and irregular in distribution.55,56
In primary myelofibrosis, T1-weighted images show patchy marrow involvement with low signal intensity on T1- and T2-weighted images (Fig. 13.20). With STIR techniques, the imaging characteristics of areas of involvement are identical to those of normal hematopoietic marrow (i.e., intermediate to mild increased signal intensity).57,58,59
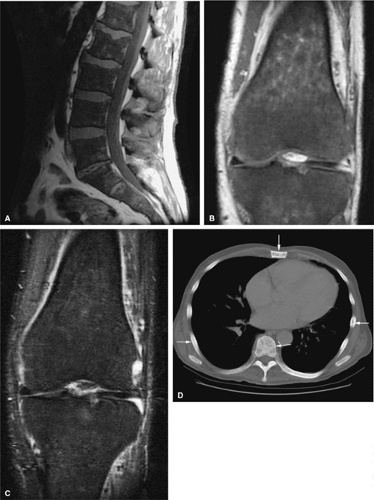 FIGURE 13.20 ● Extensive myelofibrosis following chemotherapy for leukemia. (A) The bone marrow exhibits diffuse marrow fibrosis, which is of low signal intensity on a sagittal T1-weighted image of the lumbar spine. Low-signal-intensity myelofibrotic marrow is seen on these coronal T1-weighted (B) and fat-suppressed T2-weighted (C) images of the knee. (D) Abnormal sclerosis of the spine, sternum, and ribs is seen on the axial CT image (arrows). |
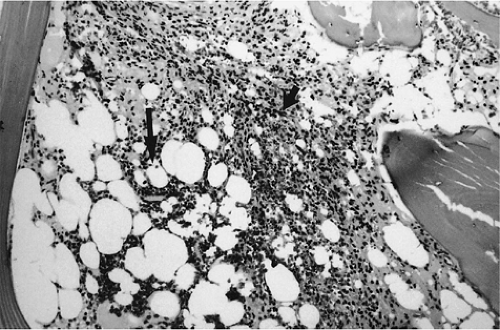 FIGURE 13.21 ● Bone marrow cellularity is low (i.e., 40:60 cell-to-fat ratio) in hairy cell leukemia. Mononuclear cells (short arrow) enveloped in reticulin form solid areas and infiltrate between the remaining fat cells (large arrow) (H & E; original magnification × 100). |
Hairy Cell Leukemia
Hairy cell leukemia, representing 2% of all leukemias, is a form of chronic leukemia that evolves from B lymphocytes.50 It typically occurs in men and classically presents as pancytopenia with splenomegaly. The distribution of marrow involvement is irregular and patchy, with a propensity for focal marrow involvement. Focal or extensive involvement with reticulin limits productive marrow aspirations. Bone core biopsy, the definitive diagnostic procedure, reveals mononuclear cells in clusters or sheets within a fine reticulin mesh in a patchy or diffuse pattern. The marrow may be hypercellular or hypocellular (Fig. 13.21).60
Hairy cells are reactive to tartrate-resistant acid phosphatase, which distinguishes hairy cell leukemia from other lymphoproliferative malignancies.61 MR imaging demonstrates both a patchy lymphoma-like marrow pattern and a second pattern with a diffuse marrow infiltrate that resembles the distribution of chronic myelogenous leukemia (Fig. 13.22).62
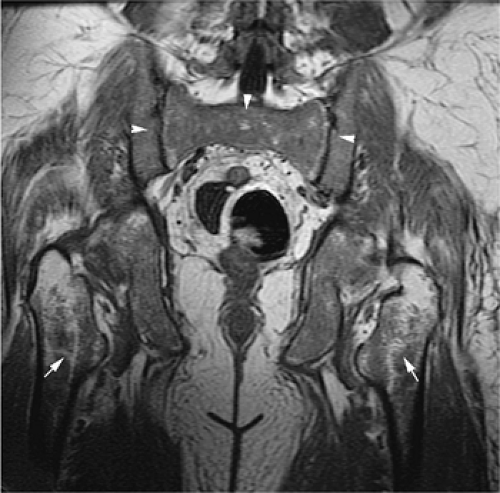 FIGURE 13.22 ● The patchy (arrows) and diffuse (arrowheads) pattern of leukemic marrow infiltration in hairy cell leukemia demonstrates low signal intensity on a coronal T1-weighted image of the pelvis. |
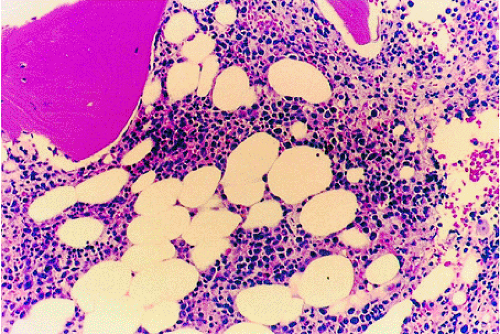 FIGURE 13.23 ● Idiopathic neutropenia after colony-stimulating factor therapy. Immature myeloid precursors can be seen in the interstitial space (H & E; original magnification × 400). |
Hematopoietic Growth Factors
Recent advances in biomolecular research have contributed to the isolation and molecular cloning of the colony-stimulating factors, which are capable of stimulating bone marrow hematopoietic progenitor cells. Recombinant granulocyte macrophage–colony-stimulating factor (GM-CSF) and granulocyte–colony-stimulating factor (G-CSF) have been used to stimulate neutrophil production in many clinical situations, including aplastic anemia, myelodysplasia, idiopathic neutropenia (Fig. 13.23), and cyclic neutropenia. These drugs have also been used following myelotoxic chemotherapy for disorders such as pediatric musculoskeletal tumors and breast carcinomas.63,64 The hematopoietic growth factors predominately induce granulocytosis. Changes in bone marrow in patients treated with GM-CSF and G-CSF include increased marrow cellularity with a significant prominence of myeloid precursors, an appearance that may histologically mimic a myeloproliferative disorder.65,66
Reconversion from fatty to hematopoietic marrow may simulate diffuse bone marrow disease by showing hypointensity on T1-weighted images and diffuse hyperintensity on STIR sequences (Fig. 13.24). MR marrow changes usually follow increases in peripheral blood neutrophil levels. The
proximal femoral metaphysis and spine are common sites of marrow reconversion.33,67
proximal femoral metaphysis and spine are common sites of marrow reconversion.33,67
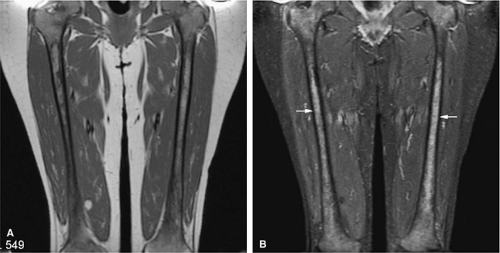 FIGURE 13.24 ● Abnormal bone marrow signal following administration of G-CSF. There is diffuse low signal on a coronal T1-weighted image of the thighs (A), which is hyperintense on the corresponding STIR image (B). G-CSF produces STIR hyperintensity, which can simulate diffuse marrow malignancies or leukemia (arrows). Bone marrow biopsy may be recommended in this situation. |
Bone Marrow Transplantation
Over the past decade, the treatment of hematologic malignancies, including the use of maximum-dosage multiagent chemotherapy or radiation therapy, has become progressively more intensive. However, maximally intensive multiagent chemotherapeutic regimens result in significant side effects, notably lethal bone marrow cytotoxicity. Bone marrow transplantation is an attempt to circumvent this side effect by providing stem cells to repopulate normal marrow elements. Marrow available for transplantation is of three types:68
Syngeneic (i.e., from an identical twin)
Allogeneic (i.e., from an HLA-matched donor)
Autologous (i.e., from the patient)
In addition to leukemia treatment, autologous bone marrow transplantation can be used in the management of solid neoplasms such as ovarian tumors, testicular tumors, breast cancers, small cell carcinoma of the lung, Hodgkin disease, and non-Hodgkin lymphoma. Preliminary results are encouraging, and increased use of bone marrow transplantation, in conjunction with aggressive chemotherapy, is anticipated.69
Procedure
Related posts:

Stay updated, free articles. Join our Telegram channel

Full access? Get Clinical Tree


