The Hip
David W. Stoller
Thomas Sampson
Miriam Bredella
The hip—consisting of the acetabulum, femoral articulation, supporting soft tissue, muscle, and cartilage structures—is a functionally and structurally complex joint. Disease processes involving the hip joint include trauma, osteonecrosis, arthritis, infection, and neoplasia, conditions that are frequently not detected by conventional radiographic techniques until they have reached an advanced clinical stage. The various imaging modalities have different strengths and weaknesses in facilitating diagnosis. Plain films, for example, are limited in assessment of soft tissues and articular structures. Contrast arthrography is useful in evaluation of the joint spaces and for sampling of synovial fluid in cases of infection. Computed tomography (CT), by reformatting axial scans with sufficient bone detail to generate sagittal and coronal images, provides a multiplanar three-dimensional (3D) perspective on hip disease.1
Magnetic resonance (MR) imaging has also been successfully used to evaluate pathologic processes in the hip.2,3 The excellent spatial and contrast resolution provided by MR imaging facilitates early detection and evaluation of femoral head osteonecrosis, definition of hyaline articular cartilage damage in arthritis, identification of joint effusions, and characterization of osseous and soft tissue tumors about the hip. With direct, noninvasive MR imaging of bone marrow, fractures and infiltrative diseases can be identified earlier than with radiographic studies. In addition, the cartilaginous epiphysis in an infant or child, which is not visible on routine radiographs, can be demonstrated on MR images. The use of surface coils, including pelvic phased-array coils, produces more anatomic detail in imaging of the joint capsule and acetabular labrum.
Imaging Protocols for the Hip
Pearls and Pitfalls
Imaging Protocols
A phased array torso, cardiac, or dedicated hip coil is required to evaluate femoroacetabular impingement using high-resolution images.
FS PD FSE images in the coronal axial and sagittal planes are used to identify anterior and lateral acetabular labral tears.
Axial oblique images are used to estimate the alpha angle in the nonspherical femoral head in cam-type femoroacetabular impingement.
MR arthrography is an optional adjunct and is not a replacement for routine FS PD FSE imaging.
With the body coil used in most MR examinations of the hip, and with a large (32- to 40-cm) field of view (FOV), both hips are seen and can be compared. Phased-array torso coils improve the signal-to-noise ratio (SNR) while still providing visualization of both hips.4 A phased-array torso, cardiac, or dedicated hip coil is used to provide high-resolution images of the symptomatic or affected hip. High-resolution images are acquired at FOVs of 14 to 18 cm.5
T1- or proton density (PD)-weighted images can be acquired in the axial, sagittal, or coronal planes. Examinations are performed with a 512 × 256 or 256 × 256 acquisition matrix, using 1 or 2 excitations (NEX). Thin (3- to 4-mm) sections are obtained either contiguously or with a minimal interslice gap. Three-millimeter sections are preferred in pediatric patients, or when precise assessments are required to display articular cartilage surfaces and the labrum.
Fat-suppressed PD-weighted fast spin-echo (FS PD FSE) images are routinely acquired to evaluate trauma, arthritis, infection, and neoplasia. If FS PD FSE imaging is not adequate or available, short TI inversion recovery (STIR) and FSE STIR sequences are useful in identifying bone marrow pathology and muscle hemorrhage and edema.6,7,8 Coronal, sagittal, and axial surface coil imaging is useful in identifying capsular and labral abnormalities at FOVs of 14 to 18 cm.
Axial oblique images parallel to the femoral neck are used to assess femoroacetabular impingement (FAI). On these scans the relationships of the femoral neck, the dysplastic femoral bump, and the femoral head are visualized on the same image. Unilateral small FOVs (14 to 18 cm) are used to evaluate the acetabular and femoral head chondral surfaces. The changes seen in FAI can also be assessed on unilateral high-resolution coronal plane and radial images that display the acetabular chondral surface, the chondrolabral junction, and the acetabular labrum (Fig. 3.1). The lateral labrum is best visualized on coronal images, although changes seen in the anterior and posterior labrum require verification on axial and sagittal images. Radial imaging is not required but can be helpful in evaluating anterior labral tears, which may be difficult to appreciate on coronal images. Routine radial images are not needed with proper correlation of axial and sagittal images.
FS PD FSE imaging is accurate in identifying areas of synovial thickening and is sensitive to intralabral, intrasubstance chondral changes and to subchondral edema. MR arthrography9 may be used to supplement routine FS PD FSE images. An additional FS T1-weighted coronal image is used to appreciate surface chondral contour and labral morphology. Capsular distention improves visualization of loose bodies. T2* gradient-echo contrast, although not routinely used, is the most sensitive and specific technique for the evaluation of chondrocalcinosis and calcium pyrophosphate dihydrate deposition disease. Gradient-echo techniques may be used selectively to appreciate trabecular architecture changes in osteomyelitis and to depict subchondral trabecular changes adjacent to the site of femoral impingement in FAI.
Related Muscles
The hip muscles10 can be grouped according to their function as follows:
The flexor muscles, including the iliopsoas, rectus femoris and sartorius
The extensor muscles, including the gluteus maximus and the hamstring muscles (the biceps femoris, semimembranosus, and semitendinosus)
The abductor muscles, including the gluteus medius and minimus
The adductor muscles, including the adductor brevis, longus, and magnus muscles, the pectineus, and the gracilis
The muscles of external rotation, including the obturator internus and externus, the superior and inferior gemellus, the quadratus femoris, and the piriformis
The muscles of internal rotation, including the gluteus medius and minimus (secondary function), the tensor fasciae latae, the semimembranosus, the semitendinosus, the posterior pectineus, and the adductor magnus
They may also be grouped by regional location, as follows:
The muscles of the iliac region, including the psoas major (Fig. 3.2), psoas minor (Fig. 3.3), and iliacus (Fig. 3.4)
The anterior muscles of the thigh, including the sartorius (Fig. 3.5), the rectus femoris (Fig. 3.6), the vastus lateralis (Fig. 3.7), the vastus medialis (Fig. 3.8), and the vastus intermedius (Fig. 3.9). The vastus lateralis, vastus medialis, vastus intermedius, and rectus femoris are the quadriceps muscles.
The medial muscles of the thigh, including the gracilis (Fig. 3.10), the pectineus (Fig. 3.11), the adductor longus (Fig. 3.12), the adductor brevis (Fig. 3.13), and the adductor magnus (Fig. 3.14)
The muscles of the gluteal region, including the gluteus maximus (Fig. 3.15), the gluteus medius (Fig. 3.16), the gluteus minimus (Fig. 3.17), the tensor fasciae latae
(Fig. 3.18), the piriformis (Fig. 3.19), the obturator internus (Fig. 3.20), the gemellus superior (Fig. 3.21) and gemellus inferior (Fig. 3.22), the quadratus femoris (Fig. 3.23), and the obturator externus (Fig. 3.24)
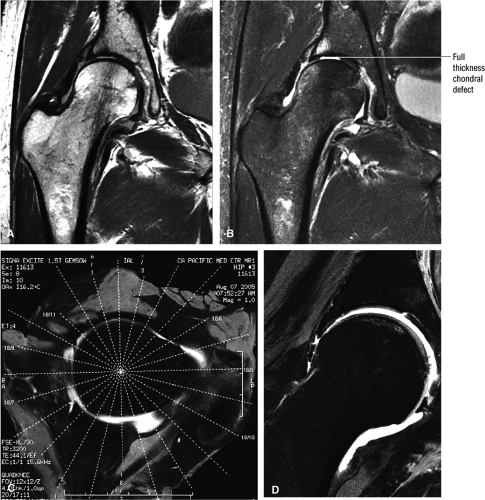 FIGURE 3.1 ● (A, B) Coronal plane images of the hip using a phased-array surface coil. Subtle acetabular sclerosis is identified on the coronal PD FSE image (A), and the full-thickness acetabular roof chondral defect is conspicuous on the FS PD FSE images (B and D). Although PD-weighted images are used more frequently than T1-weighted images, subchondral sclerosis is more apparent on T1-weighted contrast. (C) Radial image locations are prescribed from this FS PD FSE axial image centered on the femoral head. (D) High-resolution coronal FS PD FSE image (MR arthrogram) showing the potential to separate chondral surfaces of the acetabulum and femoral head. |
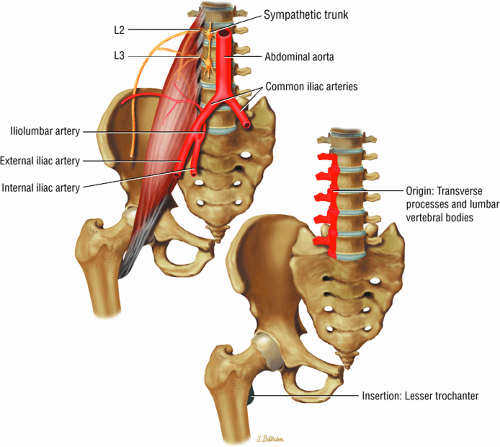 FIGURE 3.2 ● PSOAS MAJOR The psoas major flexes the femur (thigh) and vertebral spine on the pelvis when the leg is fixed. The psoas major and iliacus form the iliopsoas muscle group. Iliopsoas muscle tendon strain is the result of forceful contraction of the iliopsoas when the thigh is fixed or in the extended position. |
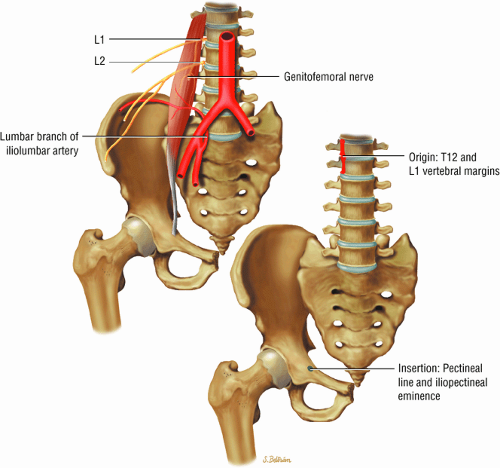 FIGURE 3.3 ● PSOAS MINOR The psoas minor flexes the pelvis on the spine and assists the psoas major in flexing the spine. The psoas minor may be absent in 40% of individuals. |
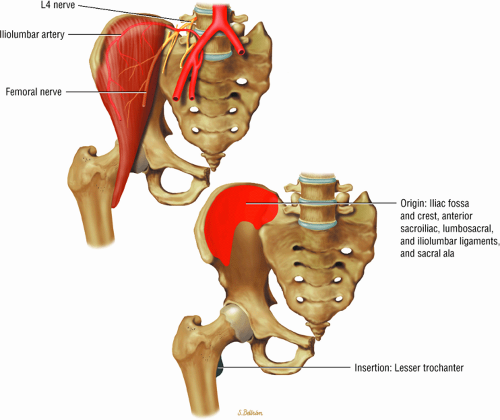 FIGURE 3.4 ● ILIACUS The iliacus muscle flexes the femur (thigh) and tilts the pelvis anteriorly when the leg is fixed. |
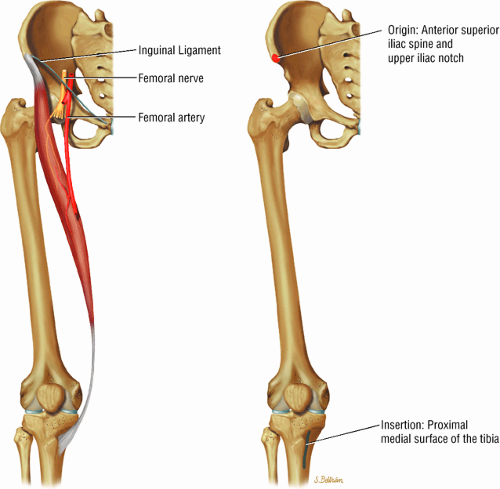 FIGURE 3.5 ● SARTORIUS The sartorius flexes and externally rotates the hip and flexes the leg on the thigh. The anterior superior iliac spine at the origin of the sartorius is a common location for an avulsion fracture. These injuries are usually seen in athletes (sprinters, jumpers, soccer players, and football players). |
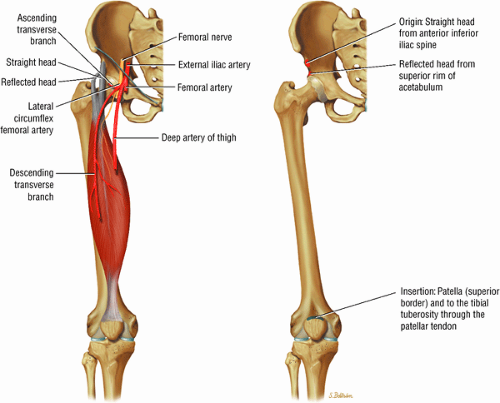 FIGURE 3.6 ● RECTUS FEMORIS The rectus femoris flexes the thigh (hip) and extends the leg (knee). Of the four quadriceps muscles (the vastus lateralis, vastus medialis, vastus intermedius, and rectus femoris), only the rectus femoris has an origin that crosses the hip joint. Soccer, football, and basketball players and track and field athletes are at risk for distal musculotendinous junction injuries and proximal intrasubstance tears of the musculotendinous junction of the indirect head of the rectus. |
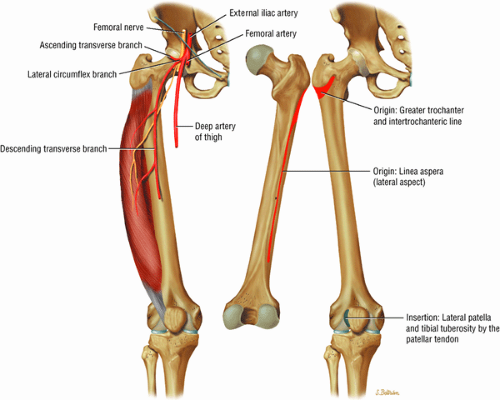 FIGURE 3.7 ● VASTUS LATERALIS The vastus lateralis extends the leg and flexes the thigh (hip) and is one of the quadriceps muscles (vastus lateralis, vastus medialis, vastus intermedius, and rectus femoris). Quadriceps muscle fibers are predominantly type II and are adapted for rapid forceful activity. The vastus lateralis obliquus (VLO) fibers of the vastus lateralis muscle interdigitate with the lateral intermuscular septum and insert onto the patella. In a lateral retinacular release, the VLO may be selectively sectioned without involving the main vastus lateralis tendon proper. |
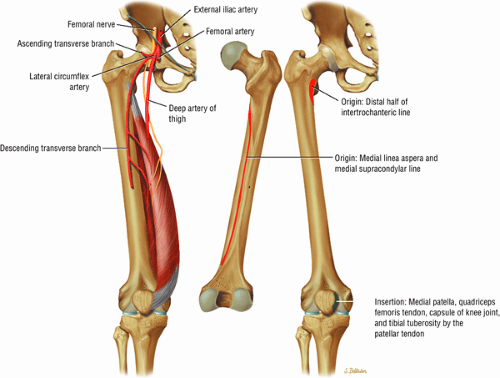 FIGURE 3.8 ● VASTUS MEDIALIS The vastus medialis extends the leg and pulls the patella medially. The quadriceps muscle group includes the vastus lateralis, the vastus medialis, the vastus intermedius, and the rectus femoris. The quadriceps muscles converge distally, forming the quadriceps tendon, which inserts on the proximal pole of the patella. The vastus medialis assists in preventing patellar dislocations and may be weak in patellofemoral disorders. Therefore, vastus medialis obliquus injuries are frequently associated with transient patellar dislocation. |
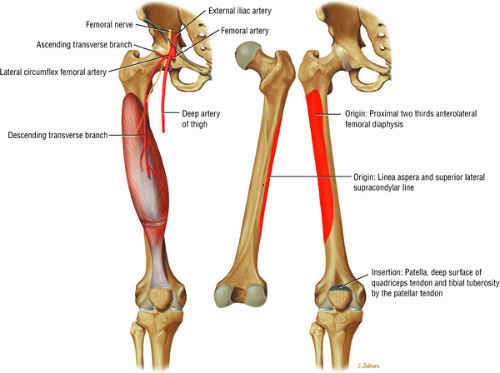 FIGURE 3.9 ● VASTUS INTERMEDIUS The vastus intermedius extends the leg and covers the articularis genu. Quadriceps (vastus lateralis, vastus medialis, vastus intermedius, and rectus femoris) injuries, including strains and tendon ruptures, result from eccentric muscle contractions. The articularis genu muscle represents a few separate muscle fibers deep to the vastus intermedius and is responsible for contracting the knee joint capsule superiorly in extension. |
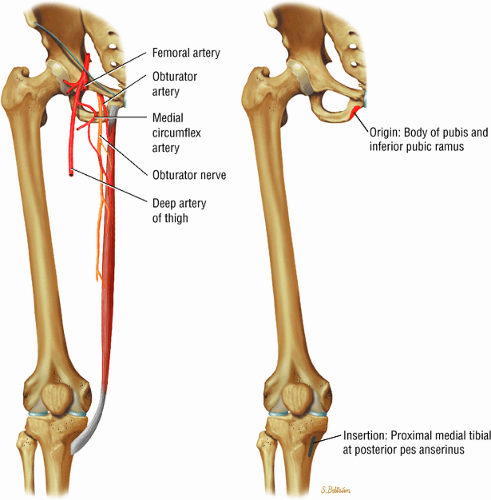 FIGURE 3.10 ● GRACILIS The gracilis muscle adducts the thigh and flexes and internally rotates the leg and can be used for anterior cruciate ligament reconstructions. The gracilis is the one muscle of the medial aspect adductors of the thigh that does not attach to the linea aspera of the femur (as opposed to the adductor longus, magnus, and brevis and pectineus muscles). |
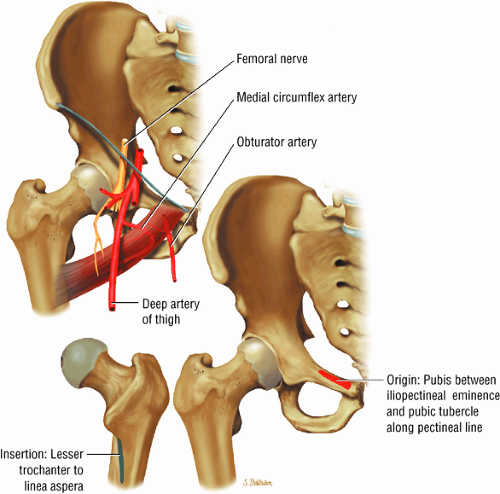 FIGURE 3.11 ● PECTINEUS The pectineus muscle adducts, flexes, and medially rotates the thigh. The adductor muscles, the pectineus, and the gracilis represent the muscles of the medial aspect of the thigh. |
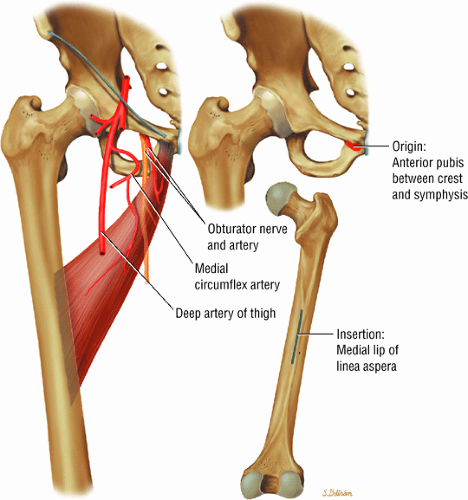 FIGURE 3.12 ● ADDUCTOR LONGUS The adductor longus adducts and assists in the flexion of the thigh. The adductor group muscles (longus, magnus, and brevis) originate at the symphysis pubis and inferior pubic ramus and insert on the linea aspera of the femur. |
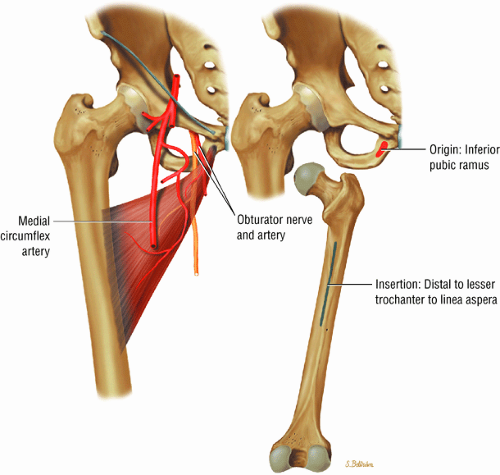 FIGURE 3.13 ● ADDUCTOR BREVIS The adductor brevis muscle adducts and assists in flexing the thigh. |
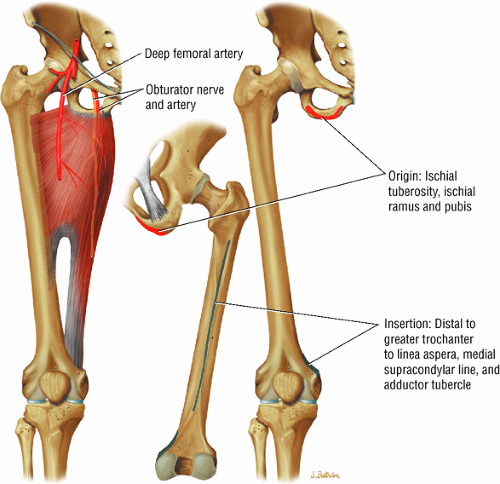 FIGURE 3.14 ● ADDUCTOR MAGNUS The adductor magnus adducts the femur (thigh). The proximal portion flexes the thigh and the distal portion extends it. |
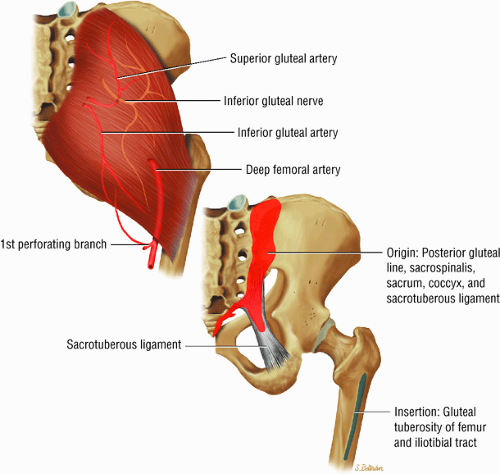 FIGURE 3.15 ● GLUTEUS MAXIMUS The gluteus maximus extends the thigh and assists in adduction and lateral rotation of the femur (thigh). Trunk extension is accomplished by action on its insertion. |
MR Anatomic Atlas of the Hip
Coronal Images
The coronal plane (Fig. 3.28) is used in the evaluation of the acetabular labrum, the hip joint space, and the subchondral acetabular and femoral marrow. Acetabular and femoral head articular cartilage may be more difficult to separate on coronal images than on sagittal images:
The fibrocartilaginous limbus, or acetabular labrum, is visualized as a low-signal-intensity triangle interposed between the superolateral aspect of the femoral head and the inferolateral aspect of the acetabulum.
The joint capsule is visualized as a low-signal-intensity structure circumscribing the femoral neck. In the presence of fluid, the capsule distends and the lateral and medial margins become convex.
Anterior coronal images demonstrate that the articular cartilage of the femoral head can be seen medially at the ligamentum teres insertion site. The reflected head of the rectus femoris is shown lateral to the proximal portion of the iliofemoral ligament.
Anteriorly, the iliopsoas muscle and tendon are in a 7-o—clock position relative to the femoral head.
The low-signal-intensity iliofemoral ligament is present on the lateral aspect of the femoral neck, near the greater trochanter.
The superior acetabular labrum is located deep to the proximal portion of the iliofemoral ligament along the lateral inferior margin of the acetabulum. The orbicular zone may be identified as a small outpouching on
the medial aspect of the junction of the femoral head and neck.
The intraarticular femoral fat pad is located between the medial femoral head and the acetabulum and displays increased signal intensity on T1-weighted images.
The obturator externus muscle crosses the femoral neck on posterior coronal images.
Inhomogeneity of marrow signal intensity in the acetabulum, ilium, and ischium is a normal finding on T1-weighted images, representing normal red and yellow marrow inhomogeneity.
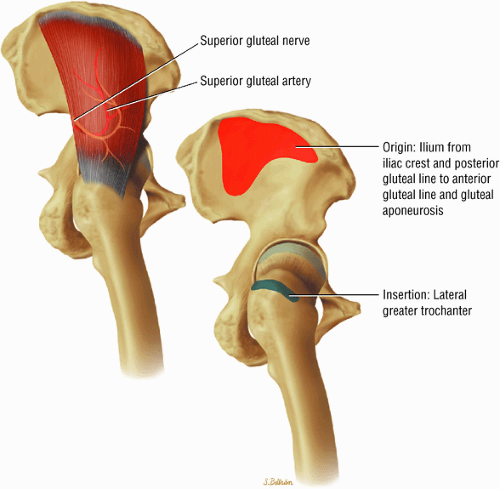 FIGURE 3.16 ● GLUTEUS MEDIUS The gluteus medius abducts and medially rotates the thigh when the extremity is extended. |
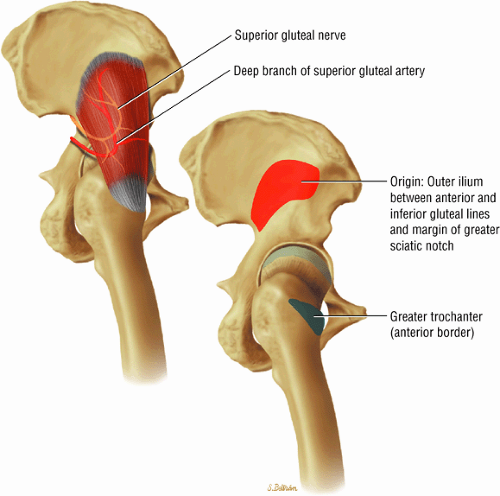 FIGURE 3.17 ● GLUTEUS MINUMUS The gluteus minimus abducts and medially rotates the thigh when the extremity is extended. |
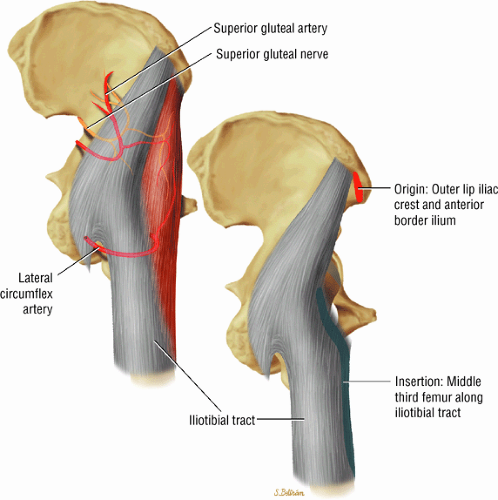 FIGURE 3.18 ● TENSOR FASCIAE LATAE The tensor fasciae latae assists in flexion, abduction, and medial rotation of the femur (thigh) and counteracts the posterior pull of the gluteus maximus on the iliotibial tract. |
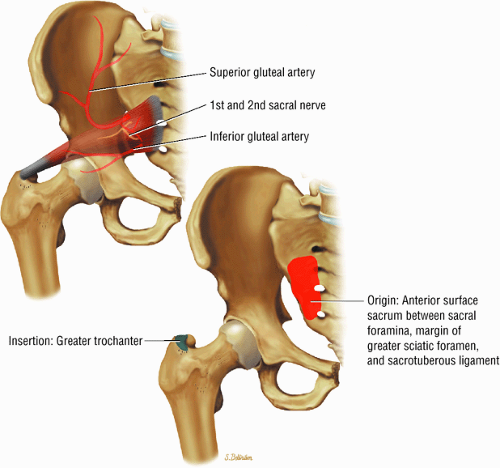 FIGURE 3.19 ● PIRIFORMIS The piriformis rotates the femur (thigh) laterally and abducts the thigh in flexion. |
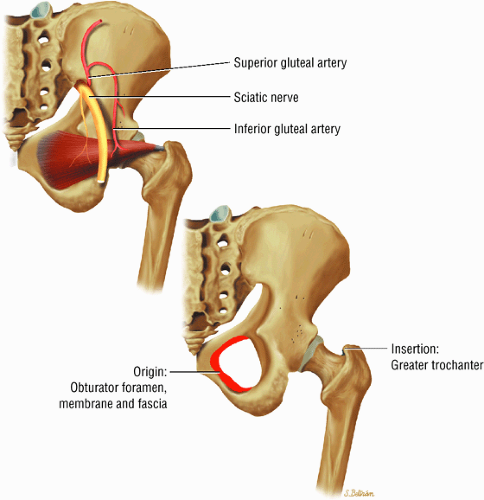 FIGURE 3.20 ● OBTURATOR INTERNUS The obturator internus rotates the femur (thigh) laterally and abducts the femur in flexion. |
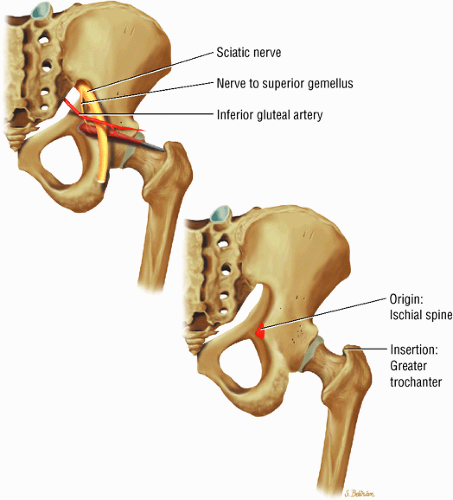 FIGURE 3.21 ● GEMELLUS SUPERIOR The gemellus superior rotates the femur (thigh) laterally. |
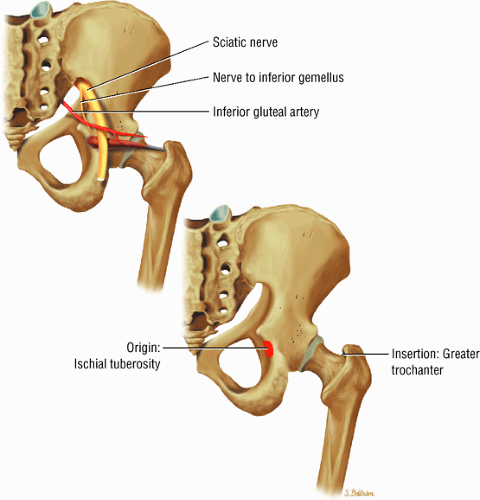 FIGURE 3.22 ● GEMELLUS INFERIOR The gemellus inferior rotates the femur (thigh) laterally. |
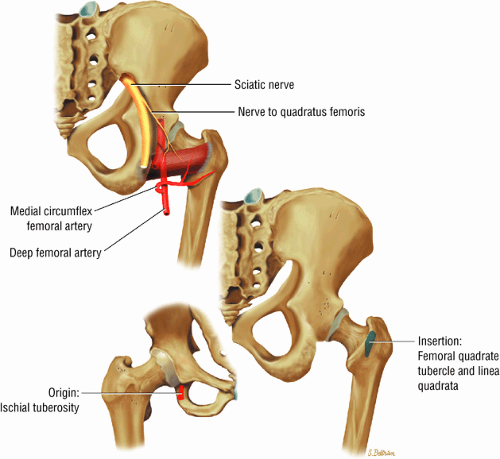 FIGURE 3.23 ● QUADRATUS FEMORIS The quadratus femoris adducts and rotates the femur (thigh) laterally. |
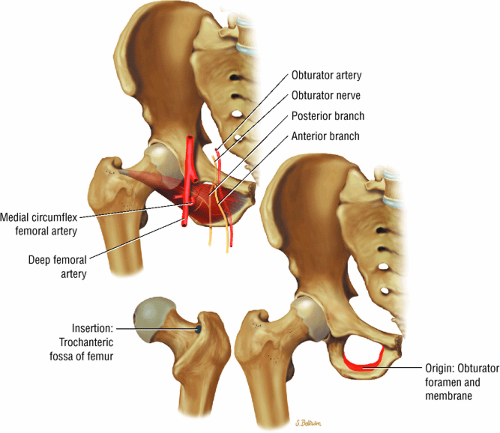 FIGURE 3.24 ● OBTURATOR EXTERNUS The obturator externus adducts and rotates the femur (thigh) laterally. |
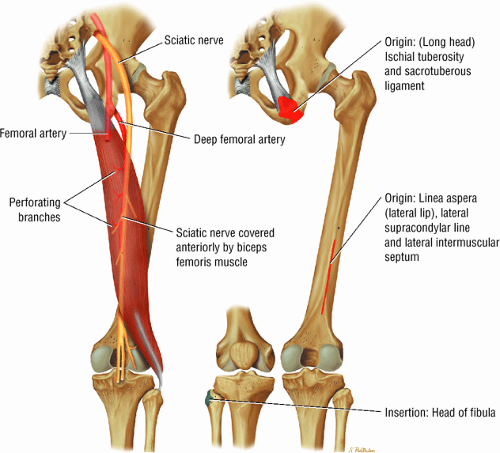 FIGURE 3.25 ● BICEPS FEMORIS The biceps femoris extends the thigh and flexes the leg in external rotation of the tibia, contributing to lateral stability of the knee. The muscles of the hamstring group (biceps femoris, semimembranosus, and semitendinosus), except for the short head of the biceps femoris, all cross the hip and the knee joint. Musculotendinous junctions extend the entire length of the muscle and serve as potential sites for strains. The short head is innervated by the peroneal branch of the sciatic nerve; the other hamstring muscles derive innervation from the tibial branch of the sciatic nerve. |
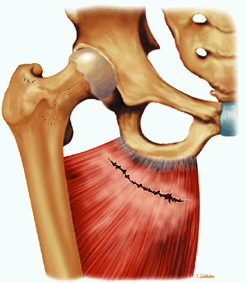
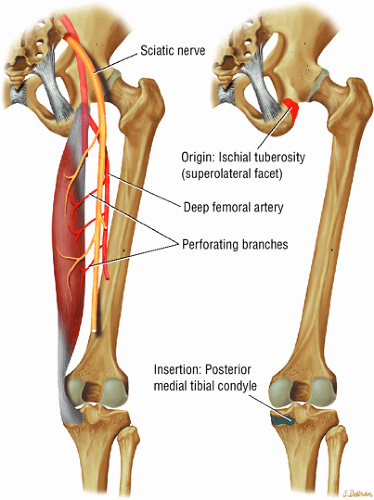 FIGURE 3.26 ● SEMIMEMBRANOSUS The semimembranosus extends the thigh and flexes the leg. It is part of the hamstring muscle group (biceps femoris, semimembranosus, and semitendinosus) in the posterior thigh. Except for the short head of the biceps, the origins of the hamstring tendons are from the ischial tuberosity and are involved in ischial avulsion fractures in the young athlete. |
Axial Images
The axial plane (Fig. 3.29) displays the relationship between the femoral head and the acetabulum and the supporting musculature. Axial images made at the level of the acetabular roof may show a partial volume effect with the femoral head. Signal intensity inhomogeneity within the acetabulum is secondary to a greater distribution of red (hematopoietic) marrow stores:
The hip musculature demonstrates intermediate signal intensity on T1-weighted images. The gluteal muscles—the gluteus medius laterally, the gluteus minimus deep, and the gluteus maximus posteriorly—can be differentiated from one another by high-signal-intensity fat along fascial divisions. The tensor fasciae latae muscle is seen anterior to the gluteus medius and is bordered anteriorly by subcutaneous fat. The iliopsoas muscle group is anterior to the femoral head in a 12-o—clock position. The sartorius muscle is the most anterior, and the rectus femoris is positioned between the more lateral tensor fasciae latae and the medial iliopsoas. The obturator internus muscle is visualized medial to the anterior and posterior acetabular columns.
The sciatic nerve, located directly posterior to the posterior column of the acetabulum, demonstrates intermediate signal intensity. It exits the pelvis through the greater sciatic foramen (the greater sciatic foramen is bordered by the ilium, the rim of the greater sciatic notch, the sacrotuberous ligament, and the sacrospinous ligament) inferior to the piriformis muscle.
Entrapment of the sciatic nerve at this location may be associated with the piriformis syndrome. Asymptomatic hypertrophy of the piriformis muscle in this syndrome is best appreciated on axial images. The piriformis originates from the anterior sacrum and greater sciatic notch and inserts on the upper border of the greater trochanter. The piriformis divides the greater sciatic foramen into superior and inferior portions.
The external iliac vessels, which are of low signal intensity, are medial to the iliopsoas muscle and anterior to the anterior acetabular column.
The low-signal-intensity tendon of the rectus femoris blends with the low-signal-intensity cortex of the anterior inferior iliac spine. The tendon of the reflected head of the rectus femoris muscle is anterolateral to the iliofemoral ligament and follows the contours of the lateral acetabulum.
At the level of the femoral head, the more distal femoral artery and vein are visualized.
The femoral head articular cartilage demonstrates intermediate signal intensity, and the anterior and posterior fibrocartilaginous acetabular labrum may also be identified at this level. The acetabular labrum is triangular, with the apex oriented laterally.
At the level of the greater trochanter and femoral neck, the obturator internus is identified medial to the pubis and ischium.
The iliofemoral ligament is of low signal intensity and blends with the dark (i.e., low signal intensity) cortex of the anterior femoral neck.
The sciatic nerve, lateral to the ischial tuberosity, is encased in fat between the quadratus femoris muscle anteriorly and the gluteus maximus muscle posteriorly.
The iliotibial tract can be seen peripherally as a thin, low-signal-intensity band surrounded by high-signal-intensity fat on the medial and lateral surfaces.
The low-signal-intensity obturator vessels are encased in high-signal-intensity fat and can be identified posterolateral to the pubic bone, between the pectineus and obturator internus muscles.
The adductor muscles anteromedially, the obturator externus and the quadratus femoris muscles medially, the ischial tuberosity attachment of the long head of the biceps femoris, and the semitendinosus tendons posteriorly can be visualized at the level of the proximal femur.
The ischiofemoral ligament is identified anterior to the quadratus femoris, medial to the ischium, and applied to the posterior hip capsule.
The sacrotuberous ligament is seen posteromedial to the ischium.
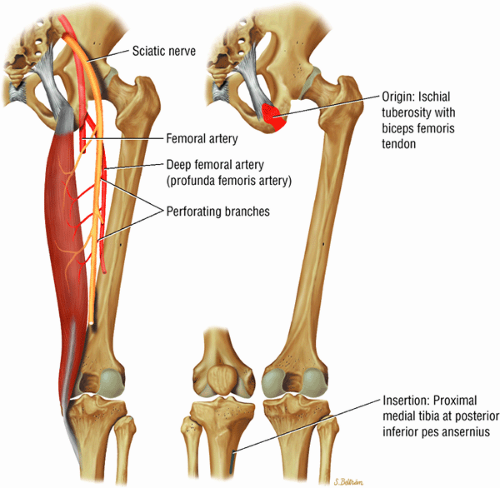 FIGURE 3.27 ● SEMITENDINOSUS The semitendinosus, which is part of the hamstring muscle group, extends the thigh and flexes the leg. It may be used for anterior cruciate ligament reconstructions, posterolateral knee reconstructions, and tenodesis for patellar subluxation. It is the most posteromedial tendon on axial knee images at the joint line. Hip hyperflexion and simultaneous knee extension is a mechanism of injury for proximal hamstring injuries in adults and apophyseal avulsions in young skeletally immature athletes. |
Sagittal Images
Lateral sagittal images (Fig. 3.30) display the gluteus medius muscle and the tendon attachment to the greater trochanter. The ilium, the anterior inferior iliac spine, the acetabular roof, and the femoral head are seen on the same sagittal section. The intermediate-signal-intensity hyaline cartilage of the femoral head and acetabulum can be separately defined, and the posterior gluteal and anterior rectus femoris muscles are displayed in the long axis:
The tendon of the obturator externus is anterior and inferior to the greater trochanter.
The piriformis tendon is situated between the iliofemoral ligament anteriorly and the gluteus medius tendon posteriorly.
The iliofemoral ligament extends inferiorly, directly anterior to the anterior acetabular labrum.
The iliopsoas muscle and tendon course obliquely anterior to the iliofemoral ligament, anterior to the femoral head.
The ischiofemoral ligament is closely applied to the surface of the posterior femoral head, anterior to the inferior gemellus muscle and obturator internus tendon.
The femoral physeal scar is seen as a horizontal band of low signal intensity in an anterior-to-posterior orientation.
Distally, the vastus musculature is seen anterior to the proximal femoral diaphysis, and the biceps femoris is viewed posteriorly. The sciatic nerve can be followed longitudinally between the anterior quadratus femoris and the posterior gluteus maximus. The low-signal-intensity attachment of the sartorius to the anterosuperior iliac spine is shown anteriorly on sagittal images. The low-signal-intensity iliopsoas tendon spans the hip joint anteriorly, crossing to its insertion on the lesser trochanter. The adductor muscle group is displayed inferior to and medial to the iliopsoas tendon and the pectineus muscle.
On medial sagittal images, the acetabulum encompasses 75% of the femoral head, and the low-signal-intensity transverse acetabular ligament bridges the uncovered anterior inferior gap. On extreme medial images through the hip joint, the ligamentum teres may be seen within the acetabular fossa. At this level, the ischial tuberosity can be seen posterior and inferior to the acetabular fossa.
Imaging Checklist for the Hip
The femur is examined in all three planes for the presence of osteonecrosis, fractures, or edema. The cartilage surfaces covering the femur and acetabulum are also inspected for cartilage fissures, fraying, thinning, or defects. Chondral debris or loose bodies, if present, are identified within the joint recesses. The labrum, which covers the anterior, superior, and posterior acetabulum, is assessed for tears, detachment, fraying, and degeneration. The acetabulum is evaluated for an abnormally shallow contour suggestive of dysplasia. The muscles and tendons about the hip are examined for the presence of tears or strain. Also, the areas overlying the greater trochanter and medial iliopsoas tendon are inspected for trochanteric bursitis and iliopsoas bursitis, respectively. The remainder of the pelvic bones, including the symphysis pubis, the superior and inferior pubic rami, the ilium, the sacroiliac joints, and the sacrum, are then examined on large-FOV coronal images.
Coronal Plane Checklist
1. Femur and Acetabulum
The femoral head is inspected for fractures, avascular necrosis (AVN), or edema from any number of causes, including transient osteoporosis of the hip, subchondral fractures, or overlying chondral degeneration (Fig. 3.31). The femoral neck, the greater and lesser trochanters, and the acetabulum are also examined for fractures. In the setting of recent-onset atraumatic hip pain, the differential diagnosis for diffuse bone marrow edema seen throughout the femoral head includes a subchondral (insufficiency) fracture, transient osteoporosis of the hip, infection, and avascular necrosis. On T1- and T2-weighted images, a subchondral fracture appears as a dark trabecular fracture line just deep to the subchondral plate at the superior margin of the femoral head. The subchondral fracture line may be extremely small and difficult to find. To avoid a misdiagnosis of transient osteoporosis, a careful search for a subtle subchondral trabecular fracture line should be performed whenever prominent edema is visualized in the femoral head.
In addition, the shape of the acetabulum is examined for evidence of a shallow contour or decreased acetabular coverage of the femoral head, suggestive of developmental dysplasia. It is not uncommon to find unilateral mild adult developmental dysplasia, and comparison with the opposite hip on large-FOV coronal images is useful in the detection of subtle
asymmetry in acetabular contour. Acetabular dysplasia is associated with labral tears and early osteoarthritis (OA), a condition known as lateral rim syndrome. Even a mildly abnormal shallow acetabulum predisposes to the development of premature degenerative chondral changes and labral tears. A shallow acetabulum is best visualized on anterior coronal images. Marrow signal throughout the pelvis and femur is often heterogeneous, as the pelvis is a common reservoir for red marrow.
asymmetry in acetabular contour. Acetabular dysplasia is associated with labral tears and early osteoarthritis (OA), a condition known as lateral rim syndrome. Even a mildly abnormal shallow acetabulum predisposes to the development of premature degenerative chondral changes and labral tears. A shallow acetabulum is best visualized on anterior coronal images. Marrow signal throughout the pelvis and femur is often heterogeneous, as the pelvis is a common reservoir for red marrow.
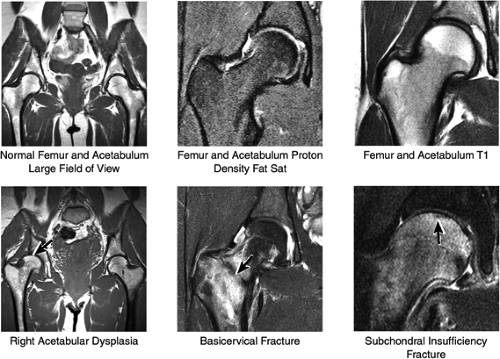 FIGURE 3.31 / Femur and Acetabulum. |
2. Cartilage Surfaces
Cartilage covers not only the articular surface of the acetabulum but also the femoral head to the level of the femoral head-neck junction (sparing only the fovea on the medial femoral head). Cartilage surfaces are examined for the presence of thinning, fibrillation, fissuring, or defects. The subjacent bone is also examined for evidence of subchondral cystic change and edema (Fig. 3.32). In the presence of chondral degeneration, the remainder of the joint space, which extends inferiorly to the junction of the femoral neck and trochanter, is examined for loose bodies. Commonly, early chondral degeneration is initially visualized in the anterior superior quadrant of the hip, accompanied by bone marrow edema in the anterior superior acetabulum and tearing of the anterior superior labrum.
In FAI, cartilage loss and subchondral edema involving the anterior and lateral acetabulum, as well as associated labral tearing, are accompanied by hypertrophic changes and subcortical cystic change at the anterolateral femoral head-neck junction. The latter of these findings has been referred to as a dysplastic bump. This combination of findings is most likely due to repetitive microtrauma of the lateral femoral head-neck junction as the femur swings up and abuts the lateral acetabulum during flexion with internal rotation.
3. Labrum
The normal labrum is seen as a dark-signal triangle covering the articular cartilage at the lateral peripheral margin of the acetabulum (Fig. 3.33). By viewing successive anterior-to-posterior coronal images, the anterior superior, superior, and posterior superior labra are visualized. Interpretation of MR findings in the acetabular labrum is comparable to examination of the labrum in the shoulder. Normally the dark-signal-intensity triangle of the labrum is seen firmly attached to the acetabulum. Linear or irregular fluid signal extending through the substance of the labrum indicates a labral tear. Labral tears are also characterized by fluid signal undermining the attachment between the labrum and the acetabulum (indicative of partial or complete detachment) and by expansion of the labrum by fluid signal, often extending to the surface of the labrum and into a paralabral cyst. Complete absence of the labrum, often with replacement by a large bony acetabular spur, suggests longstanding chronic labral tearing with eventual resorption of the torn and degenerated labrum. Labral tears usually involve the anterior half of the labrum but may also involve the labrum circumferentially, and they occasionally affect the posterior labrum alone.
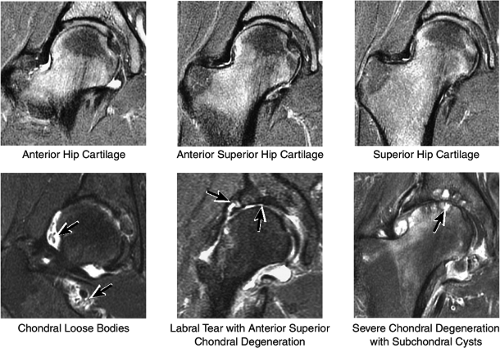 FIGURE 3.32 / Hip Cartilage. |
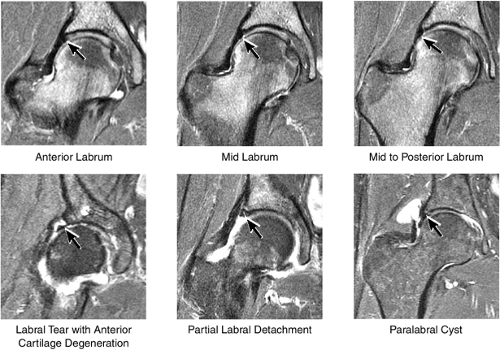 FIGURE 3.33 / Labrum. |
When present, paralabral cysts are strongly suggestive of an adjacent labral tear. Paralabral cysts, which range in size from a few millimeters to several centimeters, may manifest as a single cyst extending a neck back to the labrum, as a multiloculated cyst, or occasionally as a collection of tiny cysts (each measuring a few millimeters) lining up in an arc along the circumference of the labrum.
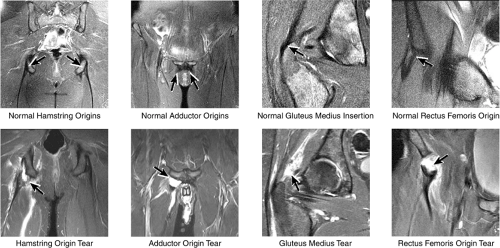 FIGURE 3.34 / Muscle and Tendon Insertions. |
The inferior portion of the acetabulum is not covered by the labrum; in its place, the transverse ligament spans the inferior aspect of the acetabulum.
4. Muscle and Tendon Insertions
As described earlier, there are four major muscle groups about the hip (Fig. 3.34). The anterior muscle group includes the sartorius, rectus femoris, and iliopsoas. The medial group, the adductors, includes the gracilis, pectineus, adductor longus, adductor brevis, and adductor magnus. The lateral group includes the tensor fasciae latae and the gluteus maximus, medius, and minimus, as well as the obturator internus and externus, the gemelli, and the quadratus femoris. The posterior group, the hamstring muscles, includes the biceps femoris, semimembranosus, and semitendinosus.
Laterally, the gluteus minimus and medius insert anteriorly and posteriorly, respectively, on the greater trochanter. Medially, the adductor muscles can be strained, partially torn, or completely avulsed (with bony avulsion fragments) from the inferior pubic ramus. Posteriorly, the hamstring tendon origin at the ischium is a frequent site of tendinosis, tears, and bony avulsion, particularly in high-level athletes. Anteriorly, the rectus femoris and sartorius may be avulsed from their insertions on the anterior inferior and anterior superior iliac spines, respectively. This injury is seen most often in children and adolescent athletes.
5. Greater Trochanter
The insertions of the gluteus medius and minimus tendons are the major structures to be evaluated at the greater trochanter (Fig. 3.35). The gluteus medius tendon inserts posterosuperiorly on the greater trochanter and the gluteus minimus tendon inserts anterosuperiorly. The trochanteric bursa lies alongside the lateral margin of the greater trochanter, and distention of this bursa with fluid (compatible with bursitis) is evaluated on coronal and axial images. Mild trochanteric bursal inflammation from friction over the greater trochanter is common, particularly in elderly patients, and is visualized as mild fluid signal interdigitating around the distal gluteus medius and minimus tendons. Trochanteric bursitis is commonly accompanied by tendinosis, strain, or tears of the gluteus medius and minimus tendons at their insertion on the greater trochanter. Tears and strain of these tendons, particularly in older patients, can mimic pain from fractures. The gluteus medius and minimus tendons have been referred to as the “rotator cuff” of the hip, and tendinosis and partial tearing of these tendons are extremely common in middle-aged and older patients.
6. Other Pelvic Bones
Large-FOV coronal images that include both hips are optimal for evaluating the other pelvic bones and articulations (Fig. 3.36). On images throughout the anterior pelvis, the symphysis pubis is examined for osseous spurring, the pubic rami are examined for fractures (insufficiency, stress, or posttraumatic),
and the ilium is analyzed for marrow-signal abnormalities, tumor, and fractures. The sacroiliac joints are examined for arthritis, posttraumatic changes, and infection. The sacrum is also a common location for both posttraumatic and insufficiency fractures.
and the ilium is analyzed for marrow-signal abnormalities, tumor, and fractures. The sacroiliac joints are examined for arthritis, posttraumatic changes, and infection. The sacrum is also a common location for both posttraumatic and insufficiency fractures.
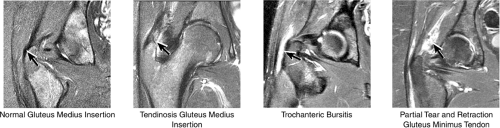 FIGURE 3.35 / Greater Trochanter. |
Axial Plane Checklist
1. Labrum
The anterior and posterior labrum are best visualized on axial images (Fig. 3.37). Abnormalities of the superior labrum can also be detected.
2. Cartilage Surfaces
The cartilage covering the medial and superolateral femoral head is well depicted, and the cartilage covering the anterior and posterior acetabular articular surfaces is also visualized (Fig. 3.38). Normally there is no cartilage covering the articular side of the medial acetabulum, which is the location for the acetabular fossa (filled with fat). In the setting of chondral degeneration, loose bodies are vigorously sought within the joint.
3. Femur and Acetabulum
Axial images are used for further evaluation of the extent of AVN involving the femoral head (Fig. 3.39). Fractures of the femur and acetabulum are also further characterized. Osteomyelitis involving the central marrow cavity of the femur is also optimally visualized. The dysplastic bump and subcortical cystic changes within the superoanterior femoral head-neck junction, associated with FAI, are also depicted.
4. Muscles and Tendons
The gluteus medius and minimus tendon insertions are seen nearly in cross-section, allowing further localization and characterization of tendon tears and strains (Fig. 3.40). The adductors, the rectus femoris, the sartorius, and the iliopsoas are also imaged in cross-section. The insertion of the distal obturator internus and externus tendons on the medial posterior aspect of the greater trochanter is also visualized. The origin of the hamstring tendon from the ischium is also visualized in cross-section. The piriformis muscle and its relationship to the sciatic nerve posterior to the acetabulum are well demonstrated, which makes axial-plane images excellent for the identification of anatomic abnormalities contributing to suspected piriformis syndrome.
5. Iliopsoas and Trochanteric Bursae
The iliopsoas tendon and muscle are evaluated as they course anterior to the acetabulum and hip joint (Fig. 3.41). The iliopsoas bursa (normally not seen if not distended with fluid) is located medial to the iliopsoas tendon and anterior to the hip joint. This bursa can become inflamed and distended with fluid with repetitive hip flexion, as part of a snapping hip syndrome,
or secondary to communication with the hip joint. Trochanteric bursitis suspected on coronal images is confirmed on axial images.
or secondary to communication with the hip joint. Trochanteric bursitis suspected on coronal images is confirmed on axial images.
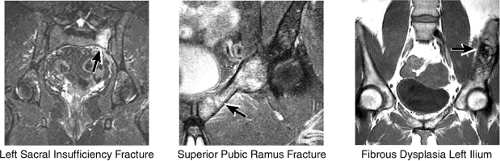 FIGURE 3.36 / Pelvic Bones. |
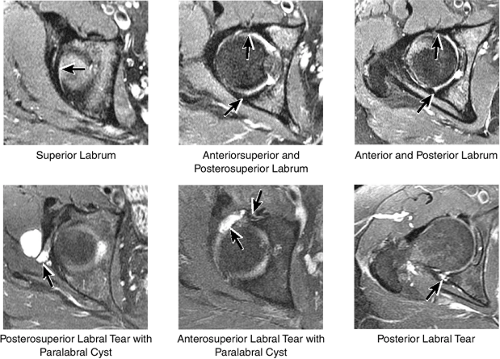 FIGURE 3.37 / Labrum. |
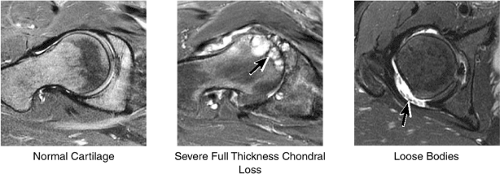 FIGURE 3.38 / Cartilage. |
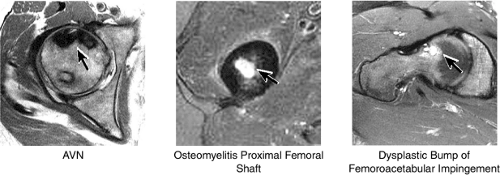 FIGURE 3.39 / Femur. |
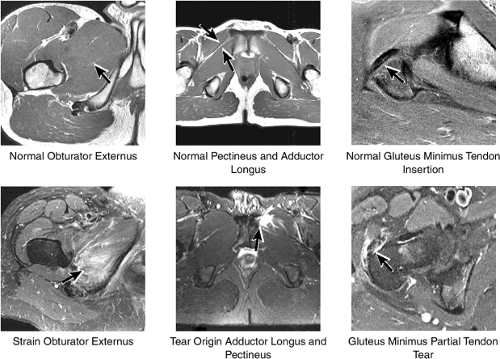 FIGURE 3.40 / Muscles. |
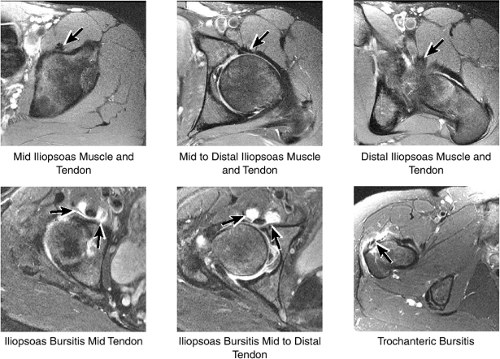 FIGURE 3.41 / Iliopsoas. |
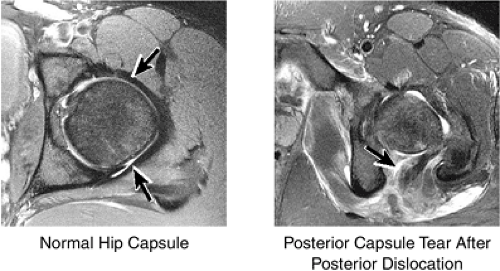 FIGURE 3.42 / Hip Capsule. |
6. Joint Capsule
The capsule surrounding the hip joint comprises the iliofemoral ligament anteriorly and the ischiofemoral ligament posteriorly (Fig. 3.42). The capsule is examined for the presence of rupture, particularly in patients who have suffered hip dislocations.
Sagittal Plane Checklist
1. Labrum
Anterior superior labral tears and detachments are well displayed on sagittal plane images (Fig. 3.43). Anterior superior labral pathology is commonly accompanied by anterior superior chondral degeneration. The entire course of the labrum from anterior to posterior is evaluated. Normal fluid interposed between the anterior labrum and capsule may mimic a
labral tear; to avoid this pitfall, suspected labral tears should be confirmed in all three planes.
labral tear; to avoid this pitfall, suspected labral tears should be confirmed in all three planes.
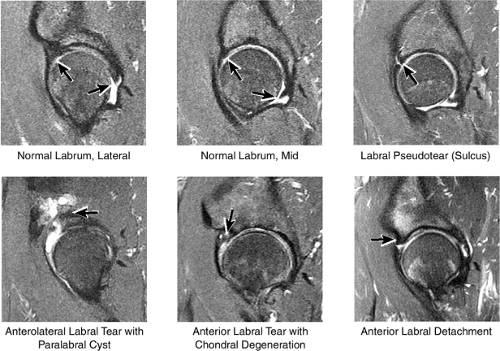 FIGURE 3.43 / Labrum. |
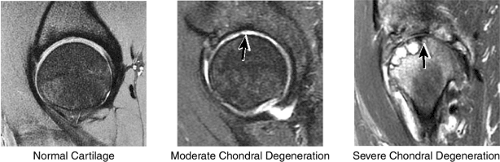 FIGURE 3.44 / Cartilage. |
2. Cartilage Surfaces
The sagittal plane affords an additional opportunity to evaluate the femoral head and acetabular cartilage surfaces and associated subchondral changes (Fig. 3.44).
3. Femur and Acetabulum
Fractures, AVN, edema, or intraosseous masses involving the femur and acetabulum are also visualized in the sagittal plane (Fig. 3.45). Triangulation on axial and coronal images is used for further characterization of abnormalities.
4. Muscle and Tendon Insertions
The medial muscle and tendon group, including the obturator internus and externus, the superior and inferior gemelli, and the quadratus femoris, is visualized in cross-section, allowing localization of pathologic changes to specific muscles within this group (Fig. 3.46). The iliopsoas tendon and associated iliopsoas bursitis are also well displayed. The distal insertions of the gluteus minimus and medius tendons onto the greater trochanter are examined for tears and tendinosis.
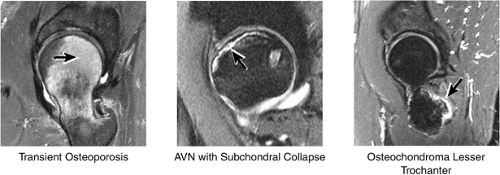 FIGURE 3.45 / Femur and Acetabulum. |
Sample MRI Report, Right Hip
History
Chronic right hip pain. Evaluate for avascular necrosis.
Findings
There is a linear oblique tear and partial detachment of the anterior superior labrum (Fig. 3.47A, coronal image). The tear extends into the superior labrum (Fig. 3.47B, axial image), and there is a septated, lobulated 2.5-cm paralabral cyst adjacent to the anterior superior labrum (Fig. 3.47C, coronal image). In addition, there is severe complete to near-complete chondral loss involving the anterior and superior femoral head and acetabular articular surfaces (Fig. 3.47D, sagittal image), with prominent subjacent subchondral cystic change within the anterior acetabulum (Fig. 3.47E, sagittal image). There is a small dysplastic bump along the anterolateral femoral head-neck junction with mild subcortical bone marrow edema (Fig. 3.47F, axial image).
The findings are compatible with femoroacetabular impingement, with moderately severe degenerative arthritis. There is a small to moderate joint effusion with reactive synovitis (Fig. 3.47G, coronal image). There is no evidence of a loose body within the joint or of acetabular dysplasia.
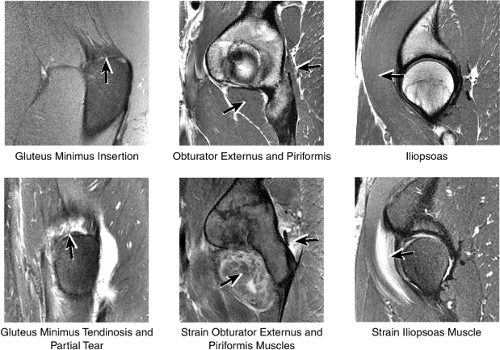 FIGURE 3.46 / Muscles. |
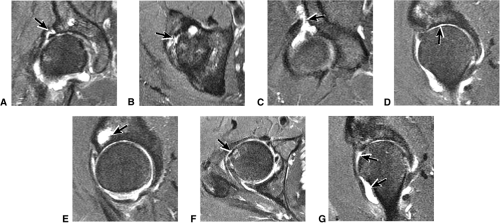 FIGURE 3.47 / Sample Hip Case. |
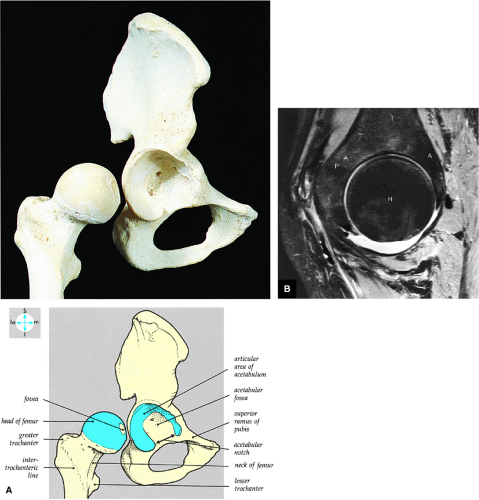 FIGURE 3.48 ● (A) Articular surfaces of the hip joint comprise the acetabulum of the hip bone and the head of the femur. (B) A sagittal MR arthrogram of the hip demonstrating capsular distention and the articular relationship of the femoral head (H) to the anterior (A) and posterior (P) aspects of the acetabulum and ilium (I). Fat-suppressed T2-weighted fast spin-echo. |
There is no evidence of a fracture or avascular necrosis. Large field of view coronal images demonstrate that the degenerative changes are asymmetric, involving the right hip only, and the left hip joint appears grossly normal. Large field of view images also demonstrate that the sacrum, sacroiliac joints, and symphysis pubis are normal. The pelvic viscera are normal.
The gluteus medius and minimus tendon insertions are normal, and there is no evidence of trochanteric bursitis. The remainder of the muscles and tendons about the hip are normal.
Impression
Degenerative arthritis of the right hip, with severe anterior superior chondral loss, anterior and superior labral tearing, an adjacent large paralabral cyst, and subchondral cystic changes involving the anterior acetabulum
Dysplastic bump in the anterolateral femoral head-neck junction associated with cam-type femoroacetabular impingement
No evidence of avascular necrosis
Anatomy of the Hip
Pearls and Pitfalls
Normal Anatomy and Variants
The stellate lesion or crease represents a normal bare area superior to the acetabular fossa.
The transverse acetabular ligament bridges the incomplete acetabular ring inferiorly. The acetabular labrum ends at the anterior and posterior margins of the inferior aspect of the acetabulum.
Normal labral variants are visualized posteroinferiorly, anterosuperiorly at the junction of the transverse ligament and labrum, and between the capsule and labrum lateral to the acetabular rim.
In DDH the labrum may be hypertrophic and associated with a femoral head chondral crease.
The sciatic nerve sheath contains two peripheral nerves: the tibial and common peroneal nerves.
The femoral head represents a multiaxial, synovial ball-and-socket joint (Fig. 3.48).11 The acetabulum, which provides bony coverage of 40% of the femoral head (Fig. 3.49), has a horseshoe-shaped lunate surface. The acetabular fossa lies in the inferomedial portion of the acetabulum. This region is occupied by the pulvinar (fat pad) and round ligament (ligamentum teres) (Fig. 3.50). The stellate lesion or crease (Fig. 3.51) is a bare area above the anterosuperior margin of the acetabular fossa within the articular area of the acetabulum.
The dense fibrocartilaginous labrum of the acetabulum increases the depth of the acetabulum (Fig. 3.52). In some patients the labrum is intra-articular in location, and in these patients it may be a predisposing factor in the development of OA. Arthroscopically, three distinct gutters can be identified peripheral to the labrum: a perilabral sulcus and the anterior and posterior synovial gutters, which are the margins of the hip joint.12 The innominate (hip) bone comprises the ilium, ischium, and pubic bones. At birth, the triradiate or Y cartilage, located at the center of the acetabulum, separates the ilium, ischium, and pubis.13,14 The fovea capitis, a small depression on the medial femoral head, is the site of attachment of the ligamentum teres originating in the acetabular fossa (Fig. 3.53). The ligamentum teres demonstrates a banded, pyramidal morphology. The transverse acetabular ligament bridges the notch at the inferomedial acetabulum and together with the acetabular labrum forms a complete ring around the acetabulum (Fig. 3.54). The femoral head, covered by articular cartilage, forms two thirds of a sphere proximal to its transition into the femoral neck. There is no articular cartilage surface over the fovea capitis. The insertion of the ligamentum teres into the fovea fills what has been referred to as a “bare area.”12 The femoral head articular cartilage surface measures 3 mm in its thickest regions posteriorly and superiorly, thinning to 0.5 mm along its peripheral and inferior margins.
The inelastic fibrous joint capsule of the hip is reinforced by the iliofemoral, pubofemoral, and ischiofemoral ligaments (thickenings of the hip capsule) (Figs. 3.55 and 3.56). The iliofemoral ligament, or ligament of Bigelow, is the strongest and thickest of the capsular ligaments and has an inverted Y-shape anteriorly. The pubofemoral and ischiofemoral ligaments are less substantial. Deep circular fibers form the ischiofemoral ligament from the zona orbicularis. Arthroscopically, the zona orbicularis may be mistaken for the acetabular labrum (Fig. 3.57).12 Twisting and shortening of the capsule limit full hip extension. The main hip abductors, the gluteus minimus and gluteus medius, insert on the greater trochanter (Fig. 3.58). The iliopsoas tendon, a major hip flexor, passes anterior to the hip joint and attaches to the lesser trochanter (Fig. 3.59).
Normal Labral Variants
The normal lateral acetabular labrum15 as assessed on coronal images correlates with the labrum on lateral peripheral sagittal images. The far anterior labrum is difficult to evaluate on anterior coronal images but is easy to visualize on axial and sagittal images. Pitfalls in interpreting the appearance of the normal labrum may occur when the labrum is visualized in close proximity to a capsular structure. Common labral variations include the following:
The posterior inferior sublabral sulcus (Fig. 3.60) should not be misinterpreted as a posterior labral tear on axial images.15,16 When depicted, this sublabral groove is seen on one or two axial oblique images superior to the transition between the transverse ligament and the posteroinferior labrum. This sulcus is in fact characterized as a labrocartilaginous cleft and can be shown arthroscopically.
An anterosuperior cleft (Fig. 3.61) may be seen as a normal variant in the presence of a normal lateral acetabular labrum. On anterior coronal or sagittal images, this cleft is seen as a partial undercutting of the labrum on a single image. The extension of fluid into this cleft occurs from the femoral side. It may be more commonly seen in labral hypertrophy associated with mild developmental dysplasia of the hip (DDH).
A transverse ligament-labral junction sulcus is a normal sulcus or recess that may be seen between the transverse ligament and the labrum either anteriorly (Fig. 3.62) or posteriorly (Fig. 3.63). The perilabral sulcus (Fig. 3.64) represents a normal space between the acetabular labrum and capsule visualized on coronal images. The capsule attaches directly to the osseous rim of the acetabulum. A normal sulcus may exist at the junction of the transverse ligament and labrum (see Fig. 3.62) on medial sagittal images. A normal perilabral sulcus is present on coronal images between the capsules and labrum and does not represent a pathologic detachment. This sulcus is a distinct and normal potential separation from the labrum (Fig. 3.65). The
perilabral sulcus is more conspicuous on MR arthrography. In comparison and contrast with the glenohumeral joint of the shoulder, the acetabular labrum of the hip is not critical in providing stability. However, it does maintain a role in creating the vacuum seal of the hip joint.
An enlarged or hypertrophied labrum may occur in patients with mild DDH.17 We have observed a femoral head chondral crease (Fig. 3.66) in these patients, creating a demarcation trough medial to a femoral head bump immediately proximal to the physeal scar. Patients who demonstrate femoroacetabular impingement (or lateral acetabular rim syndrome in DDH) also have direct impingement between the lateral acetabular labrum and the femoral head.
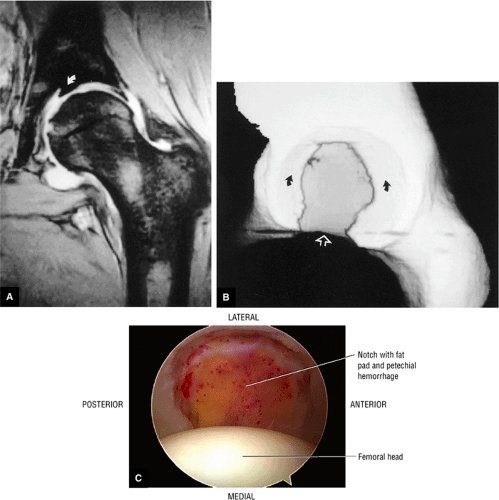 FIGURE 3.49 ● A normal cortical articular ridge of the acetabulum (arrow) is seen on (A) T2*-weighted coronal and (B) 3D CT images. This bony ridge should not be mistaken for osseous pathology. The acetabular notch (open arrow) is shown on the 3D CT rendering. (A: TR, 400 msec; TE, 20 msec; flip angle, 25°). (C) Arthroscopic view of acetabular notch. |
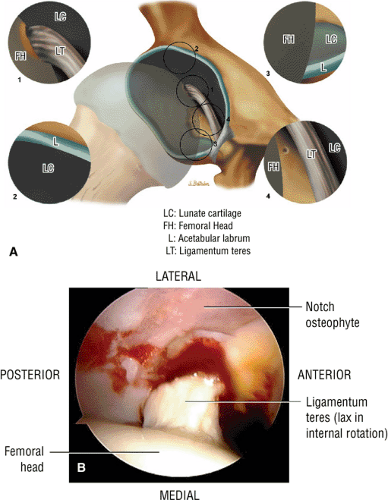 FIGURE 3.50 ● (A) Arthroscopic anatomy demonstrating the labrum, ligamentum teres, and articular cartilage of the lunate surface of the acetabulum. (B) Arthroscopic view of the ligamentum teres with the hip in internal rotation. |
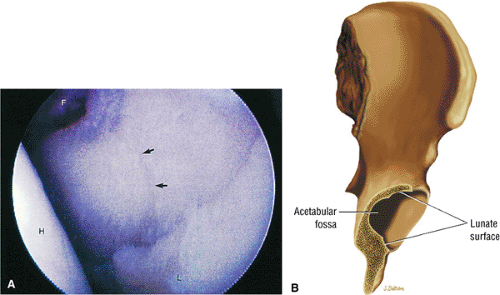 FIGURE 3.51 ● (A) The stellate crease (arrows) is shown above the acetabular fossa (F) and within the lunate surface of the acetabulum. The stellate crease, (lesion) represents a bare area deficient in hyaline cartilage and not degeneration. Arthroscopically, this bare area may appear as an indentation. The femoral head (H) is indicated. Anterior is down and posterior is up. (B) The articular lunate surface of the acetabulum. The osseous acetabular rim is angled anteroinferior relative to the sagittal plane. The adult aperture angle is 17°. |
Osseous Components
The calcar femorale (Fig. 3.67), the weight-bearing bone in the femur, radiates from the inferomedial femoral cortex toward the greater trochanter. Weight-bearing stress trabeculae form the boundaries of Ward—s triangle in the femoral neck and head. On conventional radiography, Ward—s triangle appears as a region of decreased bone density distal to the intersection of femoral neck weight-bearing trabeculae.
The secondary ossification centers of the femoral head, the greater and lesser trochanters, appear at 4 to 7 months of fetal development. In the adult, the mean femoral neck shaft angle is 125°, and femoral anteversion averages 14°. The neck shaft and femoral anteversion angles decrease during skeletal maturation. The intertrochanteric line between the greater and lesser trochanters is the attachment site of the iliofemoral ligament. Therefore, it can be seen that 95% of the femoral neck is intracapsular. This has implications for the hip joint in cases of osteomyelitis of the proximal femoral metaphysis. Since this area is intra-articular, the hip joint may become secondarily infected.
Neurovascular Structures
The medial and lateral circumflex arteries (Figs. 3.68 and 3.69) provide most of the blood supply to the femoral head and proximal femur through anastomotic rings at the base of the femoral neck and head. Fractures involving the femoral neck can damage the blood supply to the femoral head, leading to osteonecrosis. The lateral part of the extracapsular arterial ring provides most of the blood supply to the femoral head. The obturator artery provides a variable vascular supply to the femoral head through the ligamentum teres.
The sciatic, femoral, and obturator nerves are the important neural structures about the hip:10
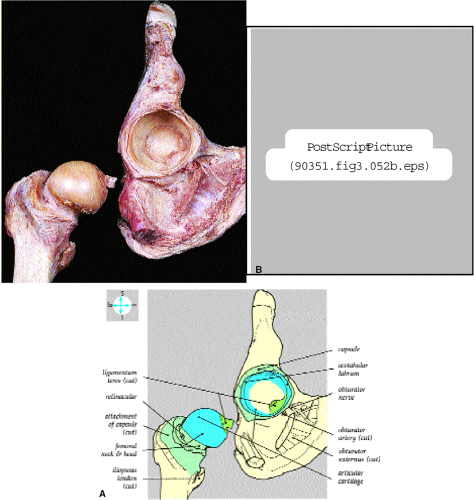 FIGURE 3.52 ● (A) Internal features are revealed by disarticulation of the joint after cutting the ligamentum teres and joint capsule. (B) The lunate-shaped articular surface covers the acetabular fossa and forms two thirds of a sphere. |
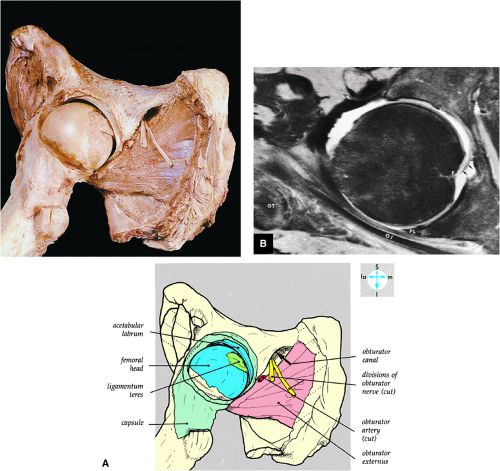 FIGURE 3.53 ● (A) The joint capsule has been opened anteriorly and reflected to show the interior of the joint. The femur has been abducted and externally rotated. (B) Axial MR arthrogram identifying the fovea (F), ligamentum teres (arrows), posterior labrum (PL), obturator internus tendon (OI), and greater trochanter (GT). Fat-suppressed T2-weighted fast spin-echo image. |
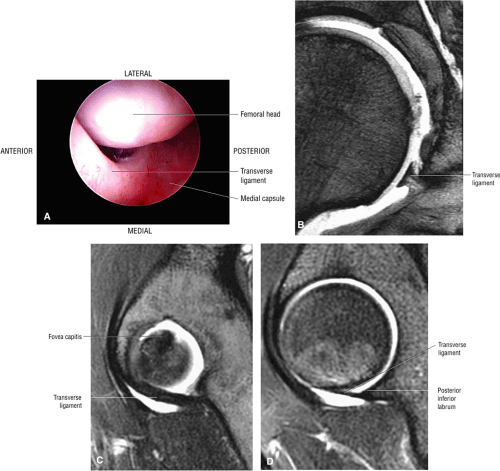 FIGURE 3.54 ● Transverse ligament. (A) Arthroscopic view. (B) Coronal T2* gradient echo image. (C) Sagittal FS PD FSE medially. (D) Sagittal FS PD FSE at posterior labrum-transverse ligament transition. |
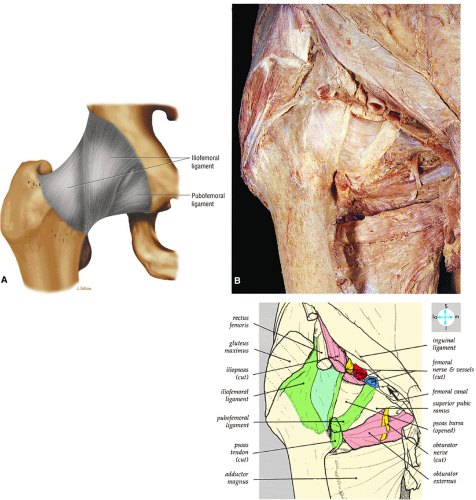 FIGURE 3.55 ● (A) The inverted Y-shaped iliofemoral ligament spirals from the superior acetabulum to the anterior femoral neck. The weaker pubofemoral ligament blends with the medial aspect of the iliofemoral ligament. The iliofemoral ligament fibers are taut in full hip extension. (B) Anterior surface of the joint capsule, associated ligaments, and adjacent structures. |
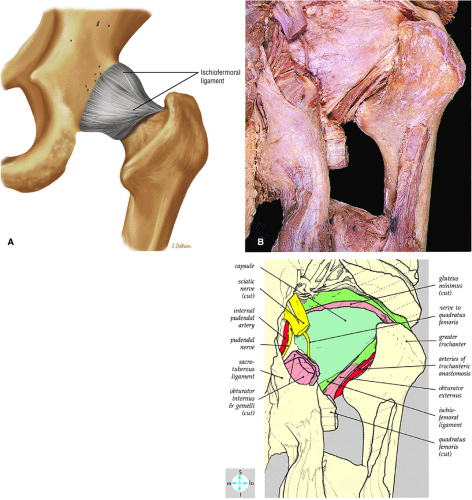 FIGURE 3.56 ● (A) The ischiofemoral ligament, which reinforces the posterior capsule, originates from the ischial portion of the acetabular rim. Its fibers spiral laterally and superiorly across the femoral neck to blend with the fibers of the zona orbicularis. (B) Posterior surface of the joint capsule and the ichioremoral ligament. |
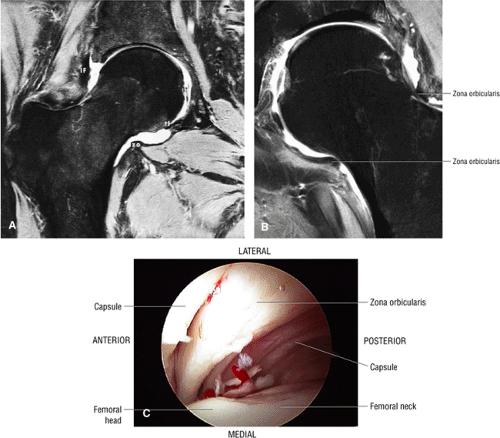 FIGURE 3.57 ● (A) Coronal MR arthrogram displaying hip joint and capsular anatomy. The distal insertion of the capsule is at the base of the femoral neck. The zona orbicularis (zo) is seen as an area of capsular thickening and tightening over the middle of the femoral neck. The transverse ligament (tl), iliofemoral ligament (IF), and ligamentum teres (lt) are identified. The acetabular labrum is absent. This coronal MR section cuts through the supra-articular recess, the intra-articular recess, and the recess colli (the recess at the base of the femoral neck). Fat-suppressed T2-weighted fast spin-echo image. (B) Coronal FS PD FSE image showing the zona orbicularis fibers at the base of the femoral neck circumferentially surrounding the posterior capsule. The zona orbicularis represents a deep layer of circularly oriented fibers that do not directly attach to the femur. (C) Arthroscopic view of the zona orbicularis. |
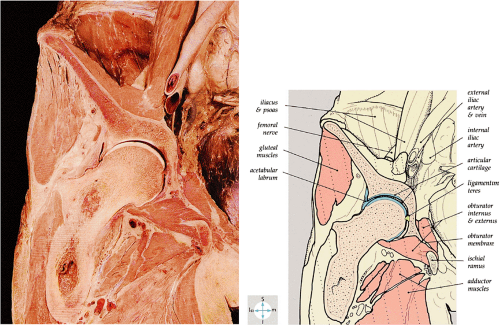 FIGURE 3.58 ● A coronal section through the hip joint shows its anatomic relations. |
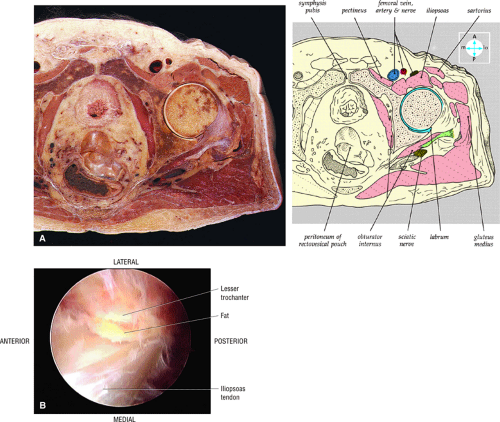 FIGURE 3.59 ● (A) A transverse section through the hip joint shows its anatomic relations. (B) Arthroscopic view of the iliopsoas tendon relative to its lesser trochanter insertion. The iliopsoas flexes, laterally rotates, and adducts the thigh. |
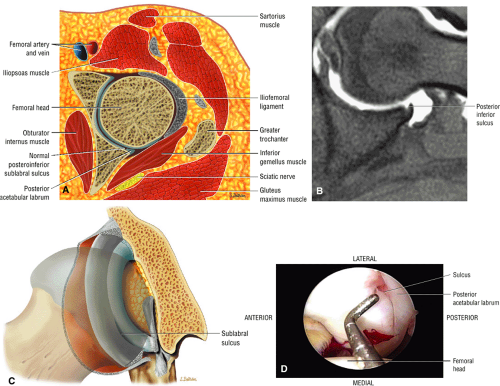 FIGURE 3.60 ● The posterior inferior sublabral sulcus or groove does not extend completely underneath the labrum and is not analogous to the sublabral foramen. (A) Axial color illustration. (B) Axial FS PD FSE image. (C) Coronal 3D color illustration of the posteroinferior sulcus. (D) Arthroscopic view of the posterior inferior sulcus. |
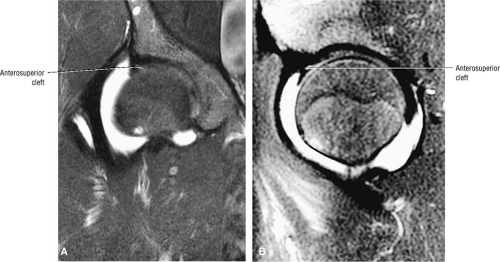 FIGURE 3.61 ● Coronal (A) and sagittal (B) FS PD FSE images of an anterosuperior cleft in a patient with mild DDH and a hypertrophied labrum. The cleft does not extend completely through the lateral or anterior labrum. |
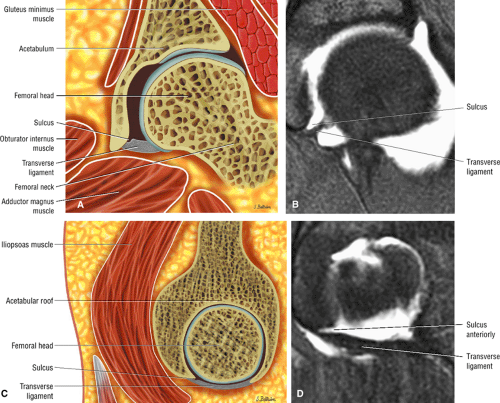 FIGURE 3.62 ● Normal transverse ligament labral sulcus. (A) Coronal color illustration. (B) Coronal FS T1 MR arthrogram. (C) Sagittal (lateral) color illustration. (D) Sagittal FS PD FSE image. |
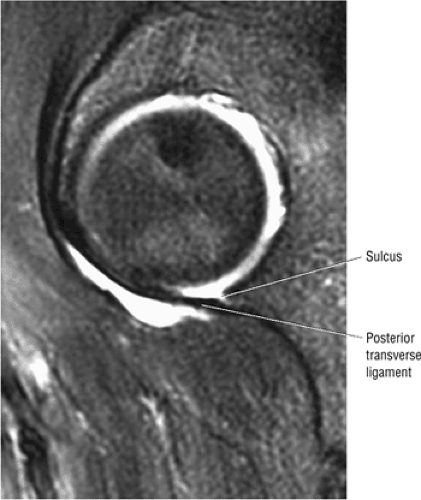 FIGURE 3.63 ● Sagittal FS PD FSE image showing the posterior transverse ligament of the labral sulcus. |
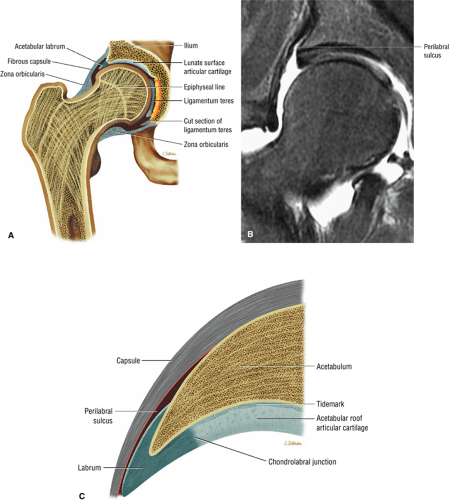 FIGURE 3.64 ● (A) Coronal section through hip joint. (B) Coronal FS PD FSE image showing the perilabral sulcus between the capsule and lateral acetabular rim and labrum. (C) Normal chondrolabral junction and perilabral sulcus. |
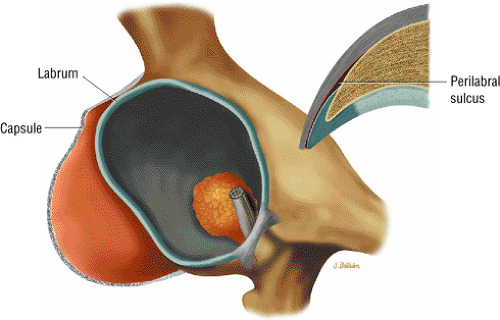 FIGURE 3.65 ● 3D image showing correlation between capsule and labrum and a corresponding coronal section of the perilabral sulcus lateral to the acetabular rim and labrum. |
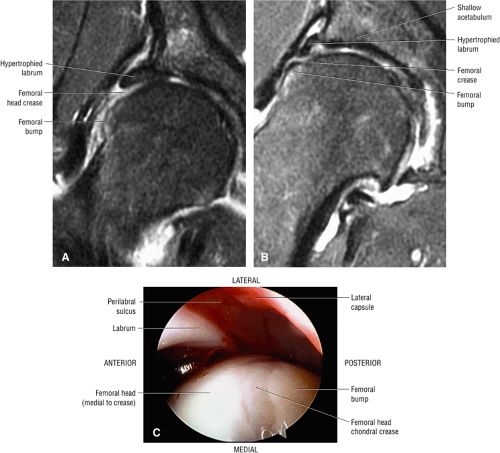 FIGURE 3.66 ● Femoral head chondral crease with adjacent bump proximal to the physis in a mild DDH case with a hypertrophied labrum. (A) A mild crease is shown on this coronal FS PD FSE image. (B) This coronal FS PD FSE image shows a prominent femoral head crease secondary to impingement between the hypertrophied labrum and the articular surface of the lateral femoral head proximal to the physeal scar in another DDH patient. (C) Arthroscopic view of femoral head crease demarcating the femoral head articular cartilage medially from the lateral bump. The crease or cleft is opposite the lateral edge of the hypertrophied labrum. The normal perilabral sulcus is also shown between the labrum and capsule. |
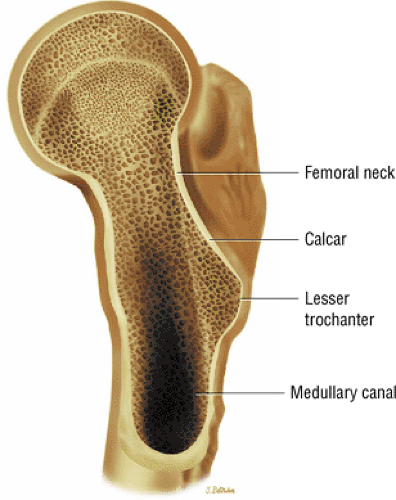 FIGURE 3.67 ● Relationship of the femoral neck and calcar. |
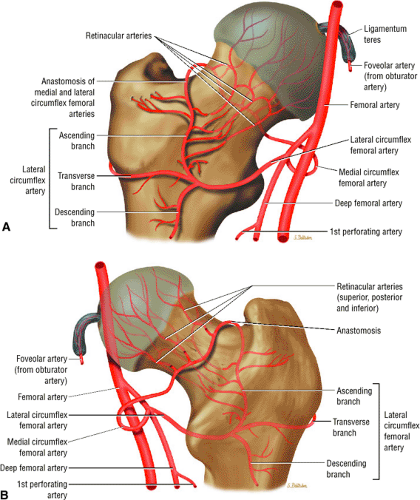 FIGURE 3.68 ● Anterior (A) and posterior (B) perspectives of femoral head arterial supply. The arteries are derived from an anastomosis of three sets of vessels, the retinacular vessels (from the medial circumflex femoral artery and, to a lesser extent, the lateral circumflex femoral artery), the terminal branches of the medullary artery of the femoral shaft, and the artery of the ligamentum teres from the posterior division of the obturator artery. |
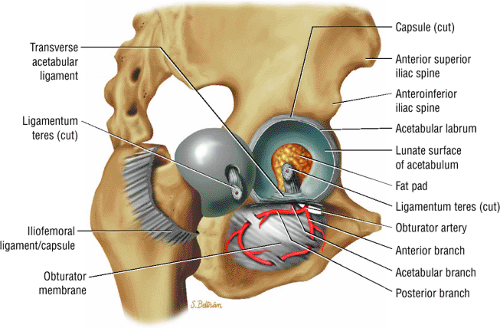 FIGURE 3.69 ● Vascular supply of the hip joint. The relationship of the obturator artery and the small foveolar artery contained within the ligamentum teres is shown. |
The sciatic nerve (Fig. 3.70) is composed of the upper sacral plexus roots from the anterior and posterior divisions of L4, L5, S1, S2, and S3. The two peripheral nerves, the tibial (anterior divisions) and the common peroneal (posterior divisions), are contained within the same connective tissue sheath as the sciatic nerve.
The femoral nerve is derived from the posterior branches of the second, third, and fourth lumbar nerve roots (the hip). The femoral nerve overlies the iliopsoas muscle proximal to its entry into the thigh through the femoral triangle.
The obturator nerve is formed from the anterior divisions of L2, L3, and L4 and crosses the quadrilateral surface of the acetabulum medial to the obturator internus muscle. The obturator neurovascular bundle exits the pelvis through the obturator canal in the superolateral aspect of the obturator foramen.
Arthroscopically Relevant Anatomy
The radiologist should be familiar with the orthopaedic terminology describing locations and pathology of the acetabulum (Fig. 3.71). The lateral acetabulum is directed superiorly and the medial acetabulum is directed inferiorly. The key structures and disorders identified on an arthroscopic overview include:18,19
The acetabular notch and fat pad, loose bodies, synovial tissue, and notch osteophytes
Tears or avulsions of the ligamentum teres
The posterior labrum
The lateral labrum
The anterior labrum
Labral hypertrophy
Soft, blistered, or delaminated acetabular cartilage
Perilabral sulcus, cysts, spurring, and labral tears
Femoral head fovea and ligamentum teres
Transverse acetabular ligament
Zona orbicularis
Iliopsoas tendon reflection or capsule
Bone Marrow
The normal proximal femur marrow (Fig. 3.72) with red to yellow marrow conversion is visualized as fat-signal intensity in the greater trochanter and femoral epiphysis.20 Fatty or yellow marrow conversion occurs in Ward—s triangle of the femoral neck in middle-aged patients. Melorheostosis (Fig. 3.73), with peripherally located cortical hyperostosis about the hip, is hypointense on all pulse sequences and may be seen on both the acetabular and femoral sides of the hip.
Pathology of the Hip
Avascular Necrosis
Pearls and Pitfalls
Avascular Necrosis
AVN usually involves the anterolateral aspect of the femoral head.
Articular cartilage is intact at the initial presentation of ischemia.
Sagittal images are the most accurate in assessing the femoral head changes that occur with subchondral fracture.
The double line sign may be absent in 20% of cases.
Loss of the spherical shape of the femoral head corresponds to Ficat stage 3.
Many cases of previously diagnosed transient osteoporosis of the hip are, in fact, subchondral femoral head stress fractures.
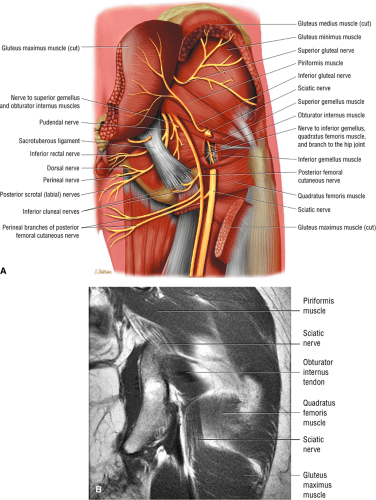 FIGURE 3.70 ● (A) Posterior color illustration of the neural structures of the posterior proximal thigh. The sciatic nerve is sectioned. The sciatic nerve arises from the lumbosacral plexus and is composed of the ventral rami of the fourth and fifth lumbar roots and the first, second, and third sacral roots. It is shown exiting the pelvis through the sciatic notch inferior to the piriformis muscle. The sciatic nerve is completely motor in function. (B) Coronal T1 FSE image of the normal sciatic nerve. |
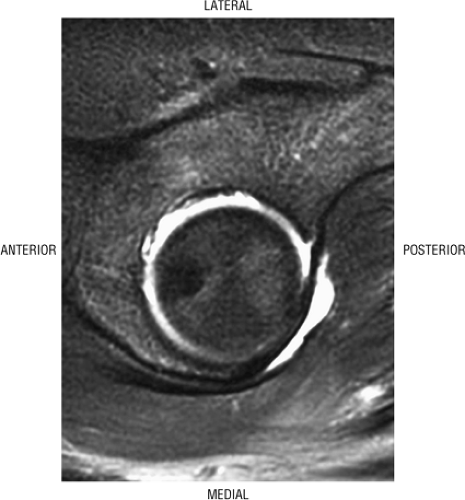 FIGURE 3.71 ● In a lateral arthroscopic approach the lateral acetabulum is directed superiorly. The left hip is demonstrated. |
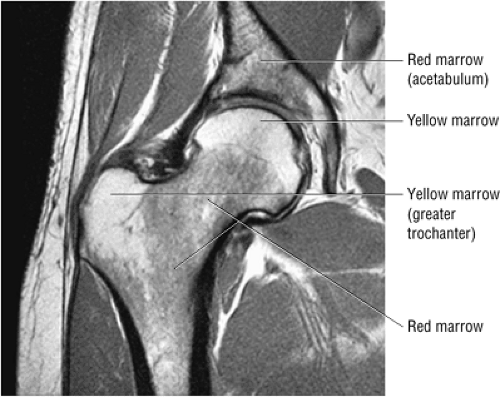 FIGURE 3.72 ● Coronal PD FSE image showing the normal distribution of yellow marrow fat signal intensity in the greater trochanter and femoral epiphysis. In the femoral neck and proximal femoral diaphysis, red marrow is seen with intermediate or lower in signal intensity. |
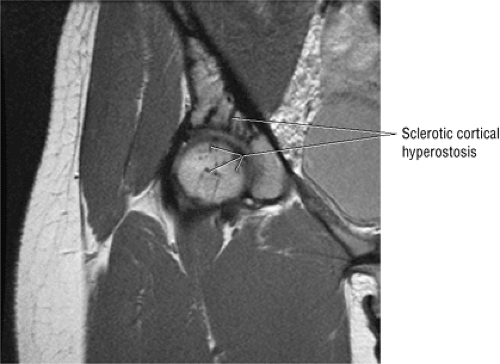 FIGURE 3.73 ● Hypointense sclerotic melorheostosis involving the acetabulum, femoral head, and ilium. Melorheostosis may cross the joint and can be associated with bone pain, limited range of motion, and joint effusion. The cortical hyperostosis (candle wax morphology) occurs in a dermatomal distribution. Subsequent evaluations may demonstrate flexion contractures, although this process is often an incidental finding. Coronal PD FSE image. |
Avascular necrosis, also referred to as aseptic necrosis, osteonecrosis, or ischemic necrosis, most commonly involves the femoral head (Fig. 3.74). Osteonecrosis is considered to be a more general term, used to indicate cellular necrosis of bone and marrow elements. The term “avascular necrosis” is used to refer to these changes when they occur in the epiphyseal region or subchondral bone. A bone infarct represents osteonecrosis of the metaphyseal or diaphyseal bone, although some infarcts involve the deep subchondral bone of the epiphyseal region. The changes seen in bone infarcts are morphologically different from those of AVN of the femoral head.
Etiology and Clinical Features
AVN is usually caused by trauma, typically occurring after a displaced femoral neck fracture and less frequently after a fracture-dislocation of the hip. Necrosis results when the vascular supply to the femoral head is disrupted at the time of injury.
Nontraumatic AVN occurs in a younger patient population and is commonly bilateral.21 Although the etiology is not well understood, one popular theory suggests a vascular etiology secondary to fat embolism, which leads to inflammation and focal intravascular coagulation.22 Nontraumatic AVN is associated with a variety of clinical conditions, including sickle cell anemia and other hemoglobinopathies, systemic lupus erythematosus, alcoholism, hypercortisolism, Gaucher—s disease, obesity, coagulopathies, hyperlipidemia, organ transplantation, pancreatitis, dysbaric phenomena such as Caisson—s disease, and thyroid disease. In 5% to 25% of cases there is a history of corticosteroid use. In a significant number of cases, none of the known risk factors can be identified, and the disease is considered idiopathic.23,24,25 An increased risk of contralateral AVN has been noted.
Clinical findings in AVN typically include the following signs and symptoms:26
The classic presentation includes hip, groin, or gluteal pain, with or without referred thigh or knee pain. Groin pain is characteristic of hip pathology. The C sign is pain described by a cupped hand placed above the greater trochanter, indicating deep joint pain.
The pain is described as deep and throbbing and is worse with ambulation or activity, particularly twisting motions such as occur in turning or changing direction.
The patient may describe pain with sitting and difficulty ascending and descending stairs.
Hip rotation and range of motion are decreased, particularly in the presence of a joint effusion.
There may be a catching or popping sensation.
A Trendelenburg gait is often noted.
Overall, AVN is responsible for 10% of total hip replacements, 10% of nondisplaced femoral neck fractures, 15% to 30% of displaced fractures, and 10% of dislocations.
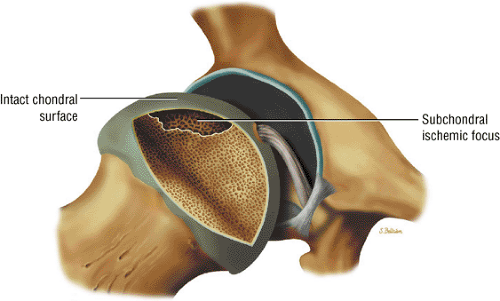 FIGURE 3.74 ● Crescentic subchondral involvement of the femoral head prior to segmental flattening of the articular surface. |
Diagnosis and Pathology
Early diagnosis is important in improving the chances of saving the femoral head because prophylactic treatment (discussed below) is more successful in the initial stages of AVN. It is particularly important in evaluating a patient with asymptomatic nontraumatic AVN on the contralateral side. Although the anterolateral portion of the femoral head is characteristically involved in AVN, no specific area of the femoral head is protected or spared in this disorder.27 The articular cartilage is intact at the initial presentation of the wedge-shaped subchondral bone infarct. An ineffective healing response with resorption of bone predominates. Partial resorption of necrotic bone and replacement with fibrous granulation tissue characterize the lack of central repair and incomplete peripheral repair of the necrotic focus. The deposition of viable bone on necrotic bone forms thickened trabeculae, which produce a mixed sclerotic and lucent or cystic radiographic appearance. Collapse of unsupported articular cartilage, secondary to subchondral fracture, leads to subsequent joint destruction (Fig. 3.75).
In addition to MR imaging, radiography, CT, and bone scans are all used to identify and stage AVN.
Radiography
Plain films, usually anteroposterior (AP) and frog lateral views, are used in staging AVN but are not sensitive to early changes. Involvement of the femoral head is usually more distinct than evidence of joint space narrowing or acetabular findings. Femoral head sclerosis may be noted, and subchondral collapse, when found, is a sign of advanced disease. With MR imaging, plain films can be used to stage disease according to the Ficat classification (see below).
Computed Tomography
CT is also used for staging disease and is more accurate than conventional radiographs for more extensive disease (stage II and higher). It is less sensitive than MR, however. Osteoporosis is the first sign of disease. Sclerosis and distortion of the central bony asterisk, normal thickening of trabeculae in the center of the femoral head, can also be seen.
Bone Scans
Nuclear scintigraphy with technetium-labeled phosphate analogues, such as methylene diphosphonate (99mTc-MDP), may be used for the early detection of osteonecrosis.28 Although bone scans allow earlier detection of changes than conventional radiographs, they are not as sensitive as MR imaging. During the acute phase of the disease, decreased uptake of bone tracer is associated with vascular compromise. Increased accumulation of radiopharmaceutical tracer occurs with chronic vascular stasis in repair and in revascularization. Dynamic scanning is useful to assess regional blood flow in this setting. The specificity of marrow scanning with technetium sulfur colloid (99mTc-sulfur colloid) is variable and depends on the status of the underlying disease and on the pattern of marrow composition.
MR Imaging
MR imaging is more sensitive than conventional radiography, CT, or radionuclide bone scintigraphy in detection of AVN of the hip.29,30 In differentiating AVN from non-AVN disease of the femoral head, MR imaging has a specificity of 98% and a sensitivity of 97%.31 MR is also effective in assessing joint effusions, marrow conversion, edema, and articular cartilage congruity, none of which is possible with bone scintigraphy, standard radiographs, or CT.
Imaging protocols for evaluation of patients with AVN include T1- or PD-weighted images and contrast-enhanced T1-weighted fat-suppressed images. A T1-weighted axial localizer and coronal images are acquired with either a T1- and T2-weighted spin-echo sequence, an FS PD FSE sequence, or a STIR (FSE STIR) sequence. Sagittal plane imaging may be helpful in defining early changes of cortical flattening associated with subchondral collapse. STIR sequences, which negate yellow marrow-fat signal, provide excellent contrast for the detection of marrow replacement, fluid, and necrotic tissue.
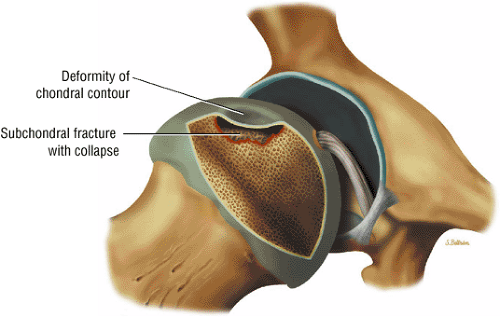 FIGURE 3.75 ● Segmental flattening with loss of the spherical shape of the femoral head. Subchondral collapse produces the characteristic crescent sign. |
Premature fatty marrow conversion associated with AVN can be detected using chemical-shift imaging techniques. On fat- and water-selective images, fatty and hematopoietic marrow and distribution of water within the ischemic focus can be differentiated. Gradient-echo coronal images, although not as sensitive for fluid within reparative tissue and necrosis, demonstrate associated hip joint effusions, subchondral fluid, and changes in articular cartilage contours. When compared with coronal images acquired with a body coil, sagittal images acquired with a surface coil and a small FOV may provide superior AP and superoinferior localization of AVN by demonstrating joint-space narrowing, articular cartilage fracture, and the double-line sign.32 On T2-weighted or FS PD FSE images, the double-line sign is visualized as an inner border of high signal intensity, paralleling the low-signal-intensity periphery. It can be observed in up to 80% of lesions and cannot be solely attributed to a chemical-shift artifact or misrepresentation.
Early osteonecrosis may present with an ischemic focus that mimics a subchondral stress or insufficiency fracture. Femoral head and neck edema may be mistaken for transient osteoporosis of the hip (Fig. 3.76). Bone marrow edema, which is a nonspecific finding, does correlate with pain and has a stronger association than joint effusion. Bone marrow edema may also occur in later stages of ischemia.
AVN may also present with a more medial and non-weight-bearing focus (Fig. 3.77). A deeper subchondral ischemic area (Fig. 3.78) may have features of both AVN and bone infarction. A deep subchondral infarct that extends to the subchondral plate, however, is equivalent to other forms of AVN, and these patients are at risk for progression and subsequent subchondral fracture.
General MR characteristics of AVN include the following:
A hypointense peripheral band (primarily granulation tissue and to a lesser extent sclerosis) outlining a central region of bone marrow represents the reactive interface between necrotic and reparative zones, as seen on T1-weighted images.
There may be associated bone marrow edema of head and neck of the femur.
A joint effusion may be seen and is hypointense on T1-weighted images and hyperintense on FS PD FSE images.
Post-contrast enhancement corresponds to a reparative zone, seen as a hypointense band. There may be decreased enhancement with gadolinium in early AVN, and there is no enhancement with nonviable trabeculae and marrow.
The alpha angle, determined on coronal images, is used to assess the largest area of necrosis (with the vertex of the angle at the center of the femoral head).33 Alpha angles greater than 75° are associated with a poor prognosis.33 (See discussion below on alpha angles.)
A wedge-shaped subchondral infarct may also be seen.
FS PD FSE images allow further characterization of AVN, but determination of the percentage of femoral head volume involved requires the use of at least two imaging planes. In the double-line sign there is a combination of a hypointense peripheral border (sclerosis) and a hyperintense inner border (granulation tissue) visualized on FS PD FSE images. AVN may exist in the absence of a double-line sign. Hyperintense effusion and marrow edema require characterization with FS PD FSE sequences.
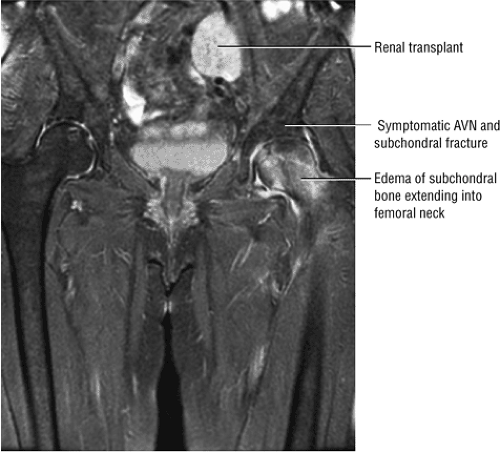 FIGURE 3.76 ● Bilateral AVN (after renal transplant). The right hip is asymptomatic and there is a diffuse edema pattern of the left femoral head and neck associated with ischemic change and subchondral fracture. Coronal FS PS FSE image. |
Staging and Classification
There are a number of staging and classification systems used to describe AVN.22,34,35,36,37 The international system, the Ficat and Arlet system, a combined system, and the Mitchell systems are described below. The specificity of radiographic staging of AVN is improved by the use of CT, which is also helpful in defining the associated sclerotic arc, in detecting acetabular dome and femoral head contour changes, in assessing the joint space, and in evaluating the extent of femoral head involvement.38 Disruption of the normal pattern of bony trabeculae can be observed on CT scans in osteonecrosis of the femoral head.39 Clumping and fusion of peripheral aspects of the femoral head asterisk may be identified prior to conventional radiographic sclerosis or subchondral fracture. These CT changes do not, however, reflect the early vascular marrow histologic processes in AVN. With MR imaging it is possible to identify early changes and to stage all aspects of the disease.
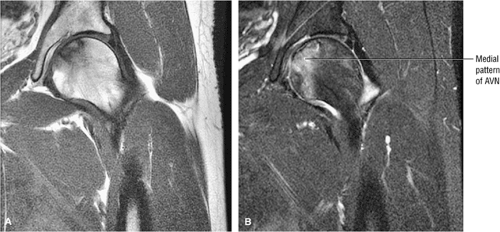 FIGURE 3.77 ● Medial osteonecrosis on coronal T1-weighted (A) and FS PD FSE images (B). Osteonecrosis involving the one third or less of the weight-bearing portion of the femur is less likely to progress to femoral head collapse. |
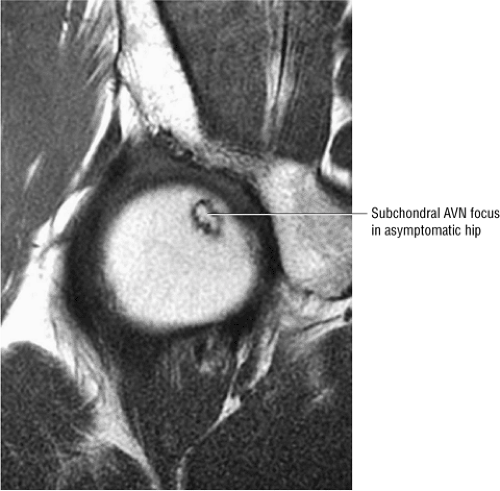 FIGURE 3.78 ● Early AVN focus extending toward the subchondral plate. Central marrow fat signal intensity is shown within the ischemic zone. |
International Classification
The international system consists of four stages:
Stage 0: Bone biopsy shows osteonecrosis, but imaging findings are normal.
Stage I: Bone scans are positive; MR imaging may or may not show early changes of AVN.
Stage II: Mottled femoral head with sclerosis/cyst/osteopenia on radiographs. There is no collapse; bone scans are positive.
Stage III: Crescent sign lesion and depression of the femoral head articular surface
Stage IV: Flattening of the articular surface and joint space narrowing with secondary acetabular changes
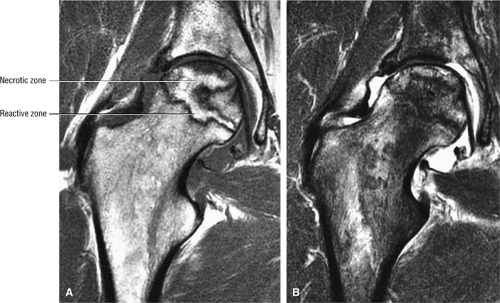 FIGURE 3.79 ● Coronal T1-weighted (A) and FS PD FSE (B) images show osteonecrosis with approximately 70% femoral head involvement without associated articular collapse. Marrow edema extends into the intertrochanteric area. |
Ficat and Arlet Staging System
The most popular of the staging systems for AVN is that of Ficat and Arlet,35 modified to include preclinical and preradiologic stages of the disease.34 This modification is important because the disease can be present in the absence of clinical and radiologic signs (stage 0). In stage I and stage II disease, the joint remains normal and the femoral head is spherical (Fig. 3.79):
Stage 0: Diagnosed on the basis of scintigraphic or MR imaging when a painful contralateral hip is being evaluated. There are no clinical or radiographic changes found. There is a double-line sign on the MR image in the asymptomatic hip in this stage.
Stage I: The trabeculae appear normal or slightly porotic. MR imaging may show a single line on T1-weighted images and the double line sign on FS PD FSE images. The double-line sign is specific and pathognomonic for AVN. The hyperintensity at the periphery of the necrotic focus is probably caused by hypervascular granulation tissue, a hyperemic response adjacent to thickened trabeculae.27 Pathologic specimens from lesions in these early stages show viable bone on necrotic bone with marrow spaces infiltrated by mononuclear cells and histiocytes, explaining the imaging changes.
Stage II: There is sclerosis and porosis of the trabeculae, and a shell of reactive bone demarcates the area of infarct. Within this area, the trabeculae and marrow spaces are acellular. There may be an extended pattern of associated marrow edema from the nonischemic region of the femoral head into the femoral neck (Fig. 3.80).
Stage III: The onset of stage III disease is marked by the loss of the spherical shape of the femoral head (Fig. 3.81). The AP radiograph may appear normal, but the lateral view often reveals a crescent sign, or radiolucency, under the subchondral bone. This represents a fracture between the subchondral bone and the underlying femoral head (Fig. 3.82). The crescent sign is the
earliest indication of mechanical failure from accumulated stress fractures of nonrepaired necrotic trabeculae.27 At this stage, there is also separation of the subchondral plate from the underlying necrotic cancellous bone. The necrotic area becomes radiodense (Fig. 3.83) as a result of mineral deposition in the marrow spaces. The joint space remains preserved or may actually increase in height.
Stage IV: The femoral head undergoes further collapse, leading to articular cartilage destruction and joint space narrowing (Fig. 3.84). Segmental collapse and subchondral fracture may result in pain and disability. Frequently this is the stage at which the patient presents for evaluation, although attention is sometimes sought earlier. Pain may be attributed to increased intraosseous pressure and microfractures.
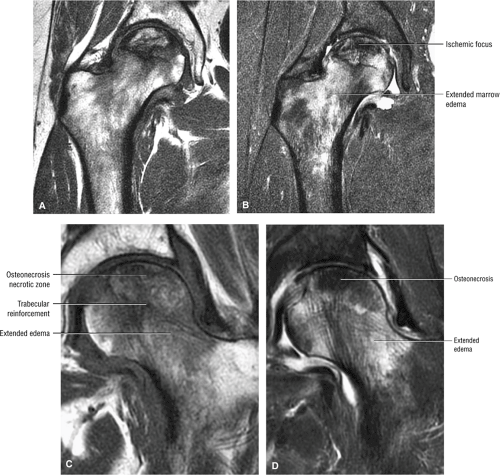 FIGURE 3.80 ● Extended pattern of marrow edema in association with osteonecrosis. Edema of the femoral neck is hypointense on T1-weighted image (A) and hyperintense on FS PD FSE image (B). (C, D) A separate case of AVN with an ischemic focus demonstrating attenuated fat signal with adjacent reactive femoral head and neck edema. The marrow edema does not extend into the ischemic region. (C) Coronal T1-weighted image. (D) Coronal FS PD FSE image. |
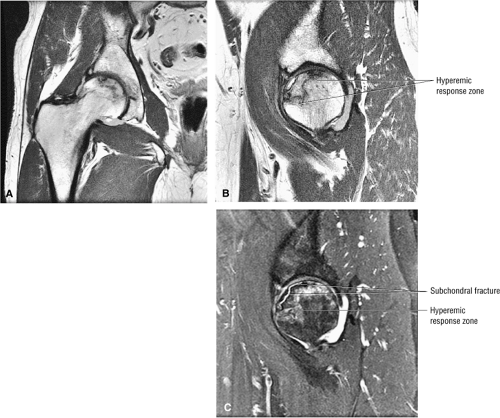 FIGURE 3.81 ● AVN with subchondral fracture. The focus of osteonecrosis involves a portion of the weight-bearing surface. (A) Coronal T1-weighted image. (B) Sagittal T1-weighted image. (C) Sagittal FS PD FSE image. |
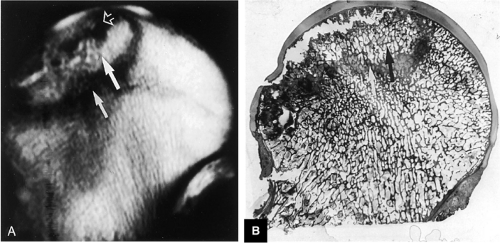 FIGURE 3.82 ● AVN. (A) T1-weighted coronal image demonstrates high-signal-intensity cortical necrosis (large arrow), low-signal-intensity sclerotic peripheral interface between necrosis and viable marrow (small arrow), and low-signal-intensity subchondral fracture (open arrow) (TR, 600 msec; TE, 20 msec). (B) A macroslide of a gross specimen shows corresponding subchondral collapse (open arrow), reactive periphery (white arrow), and cortical necrosis (black arrow). |
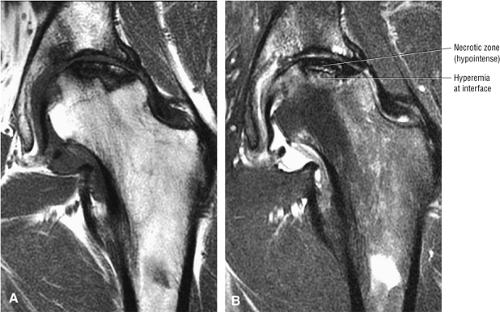 FIGURE 3.83 ● Hypointense ischemic area on coronal T1-weighted (A) and FS PD FSE (B) images. |
Combined Classification System
A separate classification system incorporates components from several different systems and includes the four stages of the Ficat and Arlet classification, quantification of the extent of femoral head involvement (determined by MR imaging as less than 15%, 15% to 30%, or more than 30%), and assess-ment of the location of the necrotic focus (medial, which is rarely progressive; central, which carries a prognosis of intermediate severity; or lateral, which has the worst prognosis).27
Mitchell Staging System
Mitchell et al. have described an MR classification system for AVN based on qualitative assessment of alterations in the central region of MR signal intensity in the osteonecrotic focus.28,40 Although the Mitchell system is useful in characterizing MR signal, the Ficat system as modified for MR findings is more useful in describing the progression of ischemia that results in changes in femoral head morphology:
Class A: In MR class A disease (Fig. 3.85), the osteonecrotic lesion demonstrates signal characteristics analogous to fat. There is a central region of high signal intensity on images obtained with short TR/TE settings (T1-weighted images) and intermediate signal intensity on images obtained with long TR/TE settings (T2-weighted images).
Class B: Class B hips demonstrate the signal characteristics of blood or hemorrhage (i.e., high signal intensity on both short and long TR/TE sequences).
Class C: Hips identified as class C demonstrate the signal properties of fluid (i.e., low signal intensity on short TR/TE sequences and high signal intensity on long TR/TE sequences).
Class D: Class D hips exhibit the signal characteristics of fibrous tissue (i.e., low signal intensity on short and long TR/TE sequences) (Fig. 3.86).
In all four classes, a peripheral band of low signal intensity outlines the central focus of AVN. This border is most visible on T1-weighted images in class A and B hips (the central focus of necrosis is bright in signal intensity) and on T2-weighted images in class C hips. Manipulation of TR/TE pulse parameters does not affect the low-signal-intensity border.
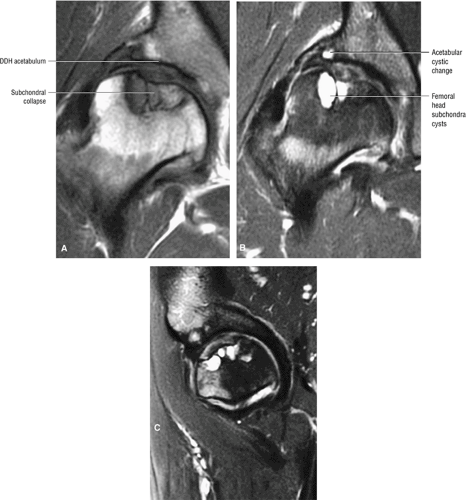 FIGURE 3.84 ● Osteonecrosis in a dysplastic hip with a shallow acetabulum. There is frank subchondral collapse and femoral head cystic change. Changes in the acetabulum represent superimposed degenerative arthritis with joint space narrowing. (A) T1-weighted coronal image. (B) FS PD FSE coronal image. (C) FS PD FSE sagittal image. |
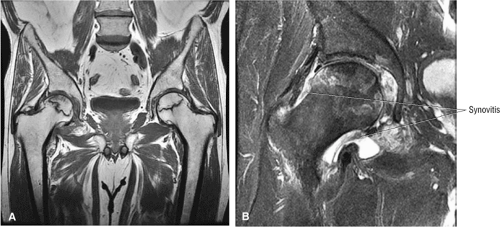 FIGURE 3.85 ● Coronal T1 FSE (A) and FS PD FSE (B) images showing AVN with associated synovitis. The central AVN focus demonstrates marrow fat signal intensity. Synovitis demonstrates intermediate signal intensity. |
Symptoms of AVN correlate well with MR classification. They are least severe in class A hips and most severe in class D hips. MR signal intensity, therefore, can be seen to follow a chronologic progression from acute (i.e., class A) to chronic (i.e., class D) AVN. Compared with conventional radiographic staging, approximately 50% of radiographic stage I and over 80% of stage II lesions demonstrate fat-like central signal intensity on MR scans and are classified as MR class A. Class A lesions are infrequent in more advanced radiographic stages.
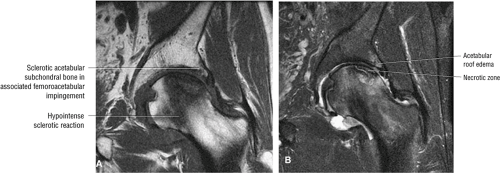 FIGURE 3.86 ● AVN associated with acetabular degenerative changes. Note the hypointense sclerotic reaction of the femoral head. (A) Coronal T1-weighted image. (B) Coronal FS PD FSE image. |
Pathologic Correlation
Many MR findings can also be correlated with pathologic changes. Common gross pathologic and surgical features and corresponding MR findings include:
Necrosis of cancellous bone and yellow bone marrow, which occurs prior to the development of capillary and mesenchymal ingrowth, corresponds to the central region of hyperintensity.41
A sclerotic margin of reactive tissue at the interface between necrotic and viable bone corresponds to the hypointense peripheral band.
Thickened trabecular bone and the high water content of mesenchymal tissue are seen as low signal intensity on T1-weighted images and intermediate to high signal intensity on T2-weighted images.
Inflammation with granulation tissue or hyperemia inside the reactive bone interface is thought to produce the double-line sign. It is present in 80% of cases of AVN.28
Softening within the necrotic cancellous bone at the interface with viable bone appears as resorption of the necrotic focus. There may be rim enhancement of granulation tissue at the reactive interface, with a lack of contrast enhancement with the central nonviable marrow.
Collapse of the femoral head load-bearing segment and collapse of the femoral head with articular cartilage destruction, loose bodies, and marginal osteophytes. Collapse is visualized as a subchondral fracture.
Areas of vascular engorgement and inflammation are indicated by decreased signal intensity on T2-weighted images and are associated with successful core decompression treatments.
A breach in the overlying articular cartilage is associated with fluid signal intensity in the subchondral fracture on FS PD FSE images.42
With intravenous gadolinium administration, enhanced and nonenhanced areas correspond to viable and necrotic bone, respectively.43,44
Perfusion, as assessed on gadolinium-enhanced T1-weighted images, and marrow composition, as measured with hydrogen-1 MR spectroscopy, were shown to be inversely related to marrow fat content in healthy subjects and were higher in patients at risk for AVN (e.g., patients with systemic lupus erythematosus).45
Joint effusions demonstrate low signal intensity on T1-weighted images and high signal intensity on T2-weighted images and are commonly associated with more advanced stages of AVN.46 It is not known whether the presence or absence of a joint effusion is of prognostic significance for the course and treatment of the disease. However, joint effusion is also associated with a bone marrow edema pattern prior to the irreversible demarcation (double-line sign) of the necrotic focus.
Another pattern of MR signal intensity, diffuse low signal intensity on T1-weighted images with increased signal intensity on T2-weighted images, has been described by Turner et al.47 The area of diffuse low signal intensity on T1-weighted images extends from the femoral head and neck into the intertrochanteric area. Although no focal findings were identified initially, AVN was subsequently demonstrated by core biopsy and focal MR morphologic patterns specific for osteonecrosis. The diffuse pattern of low signal intensity in and adjacent to the femoral head was shown to be transient in five of six patients and may represent a bone marrow edema pattern (see discussion below) preceding focal anterosuperior femoral head osteonecrosis. A bone marrow edema pattern may represent the early stages of a reversible form of AVN. These changes have also been reported in the acetabular bone prior to the development of sclerosis and granulation tissue at the interface surrounding devitalized or necrotic bone. When there is also increased uptake on corresponding radionuclide bone scans, careful observation may be required to differentiate diffuse MR patterns of early AVN from transient osteoporosis of the hip. Most cases of diffuse femoral head and/or femoral neck edema are associated with either a subtle subarticular fracture or an ischemic focus and do not represent transient osteoporosis of the hip. Red marrow adjacent to the base of Ward—s triangle should not be mistaken for an extended column of AVN-associated marrow edema (Fig. 3.87).
Importance of MR Imaging
One of the most important contributions MR imaging has made to the detection of AVN is identification of an osteonecrotic lesion in patients with normal bone scintigraphy and conventional radiography.1,48 Scintigraphy, responding to the death of hematopoietic cells (within 6 to 12 hours of the initial ischemic insult) or osteocytes (within 12 to 48 hours), may show a focus of decreased radiopharmaceutical uptake very early after the ischemic insult. Bone scans become negative once bone remodeling occurs with disease progression, however, and the osteonecrotic focus may be missed. MR imaging, which is sensitive to changes in marrow fat signal intensity, will be negative until there is death of marrow fat cells, up to 5 days after the initial ischemic insult. Unlike scintigraphy, however, MR remains positive throughout the course of AVN or until the lesion is healed. Contrast-enhanced imaging may allow even earlier identification of changes in AVN, as discussed below.
The finding of a symptomatic hip joint effusion prior to any alteration in marrow signal intensity may correspond to an elevation of intraosseous intramedullary pressures. Focal MR abnormalities, subsequent to the presentation of diffuse bone marrow edema, can be observed as early as 6 to 8 weeks from the time of detection. The demonstration of marrow necrosis and acellular lacunas can help to differentiate osteonecrosis in its early stages from transient osteoporosis of the hip. Bone marrow edema may represent a marker for progression to advanced osteonecrosis.49 Bone marrow edema and joint effusions occur most frequently in stage III AVN, although bone marrow edema has a stronger association with hip pain.50 Bone marrow edema of the proximal femur, however, has also been associated with pain in the early stage of osteonecrosis of the femoral head.51
Genez et al. determined that in the early stages of AVN there may be histologic findings of osteonecrosis in the absence of abnormal MR findings.52 It has been found that administration of intravenous gadolinium improves the early detection of AVN by demonstrating areas of decreased enhancement, despite normal findings on T1- and T2-weighted images. In a study of renal transplant patients (at risk because of corticosteroid treatment) it was found that with contrast-enhanced images it was possible to identify early changes of AVN in 6% of
100 asymptomatic patients.53 In another study of renal transplant recipients, followed for 22 months using serial radiographs and MR, untreated AVN was shown to have a benign course without progression from Ficat stage 0.54 Jiang and Shih reported that the presence of a complete or dense physeal scar on MR scans was associated with a high risk for AVN of the femoral head.55 Segmental or incomplete scars in AVN were uncommon. The sealed-off or complete scar was shown to be a risk factor in patients with or without a history of steroid or alcohol abuse (associated lipogenic factors). Because it is possible to identify MR changes of focal osteonecrosis when radionuclide scans are negative and CT and plain film findings are normal,56 a limited or modified MR examination could be used as a low-cost screening tool in at-risk populations.
100 asymptomatic patients.53 In another study of renal transplant recipients, followed for 22 months using serial radiographs and MR, untreated AVN was shown to have a benign course without progression from Ficat stage 0.54 Jiang and Shih reported that the presence of a complete or dense physeal scar on MR scans was associated with a high risk for AVN of the femoral head.55 Segmental or incomplete scars in AVN were uncommon. The sealed-off or complete scar was shown to be a risk factor in patients with or without a history of steroid or alcohol abuse (associated lipogenic factors). Because it is possible to identify MR changes of focal osteonecrosis when radionuclide scans are negative and CT and plain film findings are normal,56 a limited or modified MR examination could be used as a low-cost screening tool in at-risk populations.
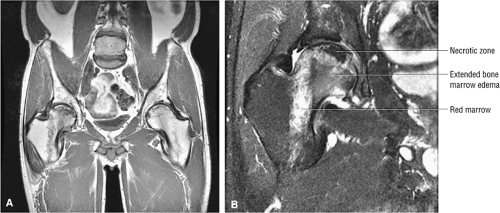 FIGURE 3.87 ● Osteonecrosis with adjacent column of red marrow. Red or hematopoietic marrow should not be mistaken for an extended edema pattern, which is partially shown in the medial femoral head/neck junction. (A) Coronal T1-weighted image, (B) Coronal FS PD FSE image. |
Another advantage of MR imaging is the ability to perform chronologic or temporal staging and assessment of the percentage of marrow involvement, information that may facilitate therapy choices. In the later stages of AVN (i.e., stages III and IV) core decompression is frequently used to palliate pain without altering disease progression. A 3D MR rendering can be used to evaluate the volume of osteonecrotic involvement of the femoral head relative to its cross-sectional area. This technique is also useful in differentiating and separating the necrotic zone of involvement and for identifying its location in the femoral head and its relationship to the weight-bearing surface. Information from quantitative assessment of femoral head involvement may assist in deciding whether to perform a core decompression or a rotational osteotomy.
Disarticulation of the femur and femoral head from the acetabulum may facilitate superior surface viewing of the femoral head and the associated necrotic focus. Separate disarticulation and composite volume rendering can be performed to display associated joint effusions. Volume transmission enables viewing of the femoral head through the acetabulum using various degrees of pelvic rotation in horizontal and vertical planes. In a quantitative approach to the assessment of the early stages of AVN, weight-bearing areas of involvement are an important and reliable parameter to monitor in follow-up.57
Treatment
Without treatment, AVN progresses to destruction of the femoral head and joint OA. Unfortunately, even early identification and intervention may not alter the result. The likelihood of disease progression is greater with nonsurgical approaches to management.
Treatment options include the following:
Conservative management, observation, and protected weight-bearing, which is of limited utility
Surgical management, including core decompression (with or without bone grafts), osteotomy, electrical stimulation, and arthroplasty
The aim of treatment is to save the femoral head, not replace it, because most patients with nontraumatic AVN are relatively young. Unfortunately, surprisingly little has been written about the natural history of the disease. Although some clinicians still recommend restricted activity and protected weight-bearing as initial therapy, Steinberg et al. have published a retrospective study of 48 patients treated nonoperatively,58 and their results indicate that limiting weight-bearing has no beneficial effect on the outcome: disease was progressive in 92% of patients. A subsequent study showed disease progression in over 80% of patients, regardless of the stage of disease at presentation, and progression of the disease in all patients who presented with some collapse of the femoral head.21
Because of the high rate of progression, many clinicians recommend early surgical intervention. Conservative or prophylactic procedures include core decompression (Fig. 3.88) with or without bone grafts,21,34,59,60,61,62,63,64 osteotomy,24,65 and electrical stimulation.59,66,67
The rationale for core decompression, the most commonly used of these procedures, is to alleviate the elevated intraosseous pressure, permitting neovascularization. Success rates reported in the literature vary dramatically (from 40% to 90%) depending on the criteria used to grade results. Smith et al.68 found that core decompression was successful in 59% of Ficat stage I lesions (success being defined as no subsequent operation or radiographic evidence of progression), but they recommended an alternative treatment for stage IIB or III lesions and possibly even stage IIA lesions.
Beltran et al. have correlated collapse of the femoral head after core decompression with the extent or percentage of involvement of AVN as determined preoperatively by MR imaging.69 When less than 25% of the weight-bearing surface was involved, femoral head collapse did not occur after core decompression. With 25% to 50% involvement, femoral head collapse occurred in 43% of hips. With greater than 50% involvement, femoral head collapse occurred in 87% of hips. Mean time to collapse was 6.7 months after diagnosis and treatment. Therefore, if a large area or volume of the femoral head is involved, subchondral collapse may occur with core decompression, despite the absence of subchondral fracture on conventional films.
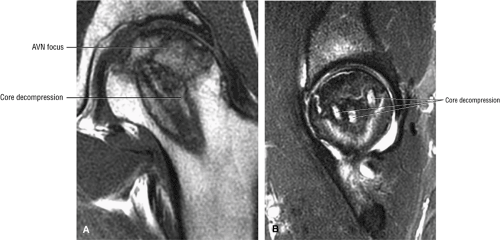 FIGURE 3.88 ● Post-core decompression for an ischemic focus with associated subchondral fracture without femoral head collapse. Arthroscopy has been performed for stage IV or post-collapse patients who are also candidates for osteotomy or vascularized graft. Delamination of articular cartilage is treated with débridement and core decompression, although improvement may be limited. (A) Coronal T1-weighted image. (B) Sagittal FS PD FSE image. |
In untreated patients, Shimizu et al. reported a 74% rate of femoral head collapse by 32 months if the necrotic focus involved one-fourth the femoral head diameter, or at least two thirds of the weight-bearing area.70
Cancellous, cortical, muscle pedicle, and microvascular bone grafts have been used with core decompression. The use of a cortical graft for necrotic bone was first described by Phemister,71 and the procedure was modified by Bonfiglio and Voke.59 Urbaniak et al. first used a vascularized fibular graft after coring of the femoral head.72 Long-term follow-up results with free vascularized fibular grafting indicated a decreased need for pain medication (86%) and a high rate of patient satisfaction (81%).73 Brown et al. used a 3D model to incorporate biomechanical variables in coring and bone grafting of a necrotic femoral head.74 For coring, they recommended that the tract not extend near the subchondral plate. The greatest structural benefit with cortical bone grafting was shown for grafts that penetrated deep into the superocentral or lateral aspect of the lesion with subchondral plate abutment. Increased stresses on necrotic cancellous bone occurred in central or lateral grafts that were placed proximal to the subchondral plate.74
A variety of proximal femoral osteotomies have been used with varying results.25,63 The principle underlying osteotomy involves redirecting stresses from structurally compromised trabeculae. These procedures are most successful in cases with limited femoral head involvement. Patients who remain on corticosteroids or who have persistent
metabolic bone disease do not benefit greatly from osteotomy.
metabolic bone disease do not benefit greatly from osteotomy.
Pulsed electromagnetic fields and implantable direct current stimulators have also been used in the treatment of AVN, also with varying results.63,66,67
Once the femoral head has collapsed, the success of prophylactic procedures diminishes significantly (Fig. 3.89). The chance of saving the femoral head is small, and most patients go on to require femoral head replacement. In general, total hip replacement is more reliable than bipolar endoprostheses.75 Hip fusion is also an alternative in young patients with unilateral disease, especially the heavy, active male.
Legg-Calvé-Perthes Disease
Pearls and Pitfalls
Legg-Calvé-Perthes Disease
Results in infarction of the bony capital epiphysis
Catterall classification estimates the amount of femoral head involvement.
Hypointense irregularity of the periphery of the ossific nucleus and linear hypointensity traversing the femoral ossification center are early findings on T1- or PD-weighted images.
Legg-Calvé-Perthes disease (LCP) is a childhood hip disorder that results in infarction of the bony epiphysis of the femoral head (Fig. 3.90). Children 4 to 8 years of age are the most commonly affected, with a median age of 7 years. Approximately 1 in 1,200 children under the age 15 years is affected.
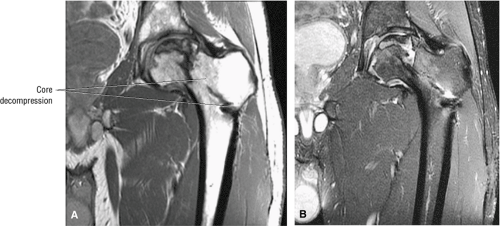 FIGURE 3.89 ● Post-core decompression for pain reduction and to delay femoral head collapse in a separate case. A fibular strut graft can also be used to prevent femoral head collapse. (A) Coronal T1-weighted image. (B) Coronal FS PD FSE image. |
Diagnosis, Etiology, and Clinical Features
Although the etiology is unclear, certain risk factors have been identified, including gender (boys are affected four to five times more often than girls), socioeconomic class (high incidence in low socioeconomic classes and in children with low birthweight), and inguinal hernia and genitourinary anomalies in children.76,77 There is no specific history of trauma. Other etiologic factors include:
Insufficiency of the capital epiphyseal blood supply, with the physis acting as a barrier; ischemia may be arterial or venous and leads to intraepiphyseal infarction
Medial and lateral overgrowth of articular cartilage
Infarction and trabecular fracture, with decreased epiphyseal height
LCP is a progressive, dynamic condition, and the results of the physical examination depend on the stage of the disease at the time of presentation. Early in the disease (Fig. 3.91), the physical findings are similar to those of irritable hip syndrome. There is bilateral involvement in 15% to 20% of children. Common clinical features include:
A limp with groin, thigh, or knee pain (referred). Children who present with knee pain must be carefully examined for hip pathology.
As the disease progresses, a flexion and adduction contracture may develop, resulting in decreased range of motion.
Lateral overgrowth of the femoral head cartilage may cause loss of abduction. Attempts at abduction lead to hinging and possible subluxation of the femoral head.
Eventually, the hip may move only in the flexion-extension plane, resulting in a painful gait and muscle atrophy.
Diagnosis of LCP is usually made from plain films. Typical radiographic features include:
Effusion, fragmentation, and flattening of a sclerotic capital epiphysis
Metaphyseal irregularity, including cystic changes and rarefaction of the lateral and medial metaphysis
Widening of the inferomedial joint space with an intact subchondral plate
A subchondral fracture line
A small epiphysis
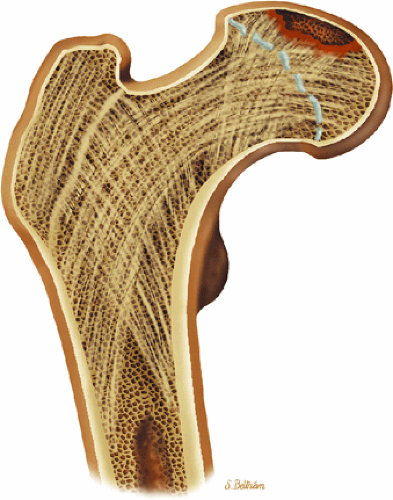 FIGURE 3.90 ● Color coronal section showing subchondral necrosis of the proximal femoral epiphyses in LCP. |
Conventional film findings may be negative early in the course of the disease, and scintigraphy and MR imaging may provide additional information.
Staging and Classification
The most commonly used classification systems for LCP are based on radiographic estimates of the amount of femoral head involvement. Catterall has defined four groups,78 Salter and Thompson have described two groups, and Herring has defined three groups based on such estimates. Waldenström has also staged the disease based on radiographic findings.
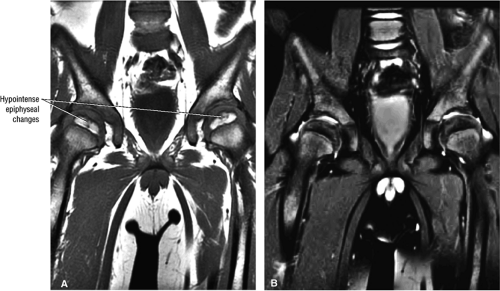 FIGURE 3.91 ● Earliest changes of LCP are irregularity of the hypointense subchondral plate of the capital epiphysis and associated joint effusions. (A) Coronal T1-weighted image. (B) Coronal FS PD FSE image. |
Catterall Classification
In Catterall—s system the distribution of epiphyseal abnormalities is based on assessments made on AP and lateral radiographs. Four groups have been defined:78
Group I: There is involvement of the anterior aspect of the epiphysis without a metaphyseal reaction, sequestrum, or subchondral fracture line. Less than 25% of the epiphysis is involved.
Group II: There is more extensive or severe involvement of the anterior aspect of the epiphysis, with preservation of the medial and lateral segments. A sequestrum is present, as is an anterolateral metaphyseal reaction. There is a subchondral fracture line that does not extend to the apex of the femoral epiphysis. Less than half the epiphysis is involved.
Group III: The entire epiphysis is dense and there is a diffuse metaphyseal reaction with femoral neck widening. A subchondral fracture line is visualized posteriorly. Most of the epiphysis is involved.
Group IV: There is total involvement of the epiphysis, with flattening, mushrooming, and eventual collapse of the femoral head. An extensive metaphyseal reaction and associated posterior remodeling can be seen.
Using this system, it should be possible to separate group I cases (without sequestrum or metaphyseal lesions) from groups II and III (with viable bone posteriorly and medially) and from group IV (with involvement of the entire epiphysis and collapse and loss of epiphyseal height). The more advanced the stage at the time of presentation, the poorer the prognosis. It is important to understand that the disease is progressive, and final radiographic staging may take up to 9 months. Risk factors for progression include lateral subluxation, calcification lateral to the epiphysis, Gage—s sign (a radiolucent V in the lateral epiphysis), and a horizontal physis.
Salter-Thompson Classification
The Salter-Thompson system is based on the extent and location of subchondral fracture and is divided into two groups:79
Group A: Less than 50% of the span of epiphysis is involved.
Group B: There is fracture of more than 50% of the span of the epiphysis.
Herring System
The Herring system of classification is based on lateral pillar involvement (the lateral pillar is defined as the lateral 15% to 30% of epiphysis), and there are three groups:80
Group A: The lateral pillar is not involved.
Group B: Less than 50% of the lateral pillar is affected.
Group C: More than 50% of the lateral pillar is affected.
Waldenström’s Radiographic Staging
Waldenström has developed a five-tier staging system based on overall radiographic findings:
Initial stage: Increased head-socket distance, subchondral plate thinning, and a dense epiphysis
Fragmentation stage: Subchondral fracture, an inhomogeneous dense epiphysis, and a porous appearance, with metaphyseal cysts
Reparative stage: Normal bone in areas of resorption and removal of sclerotic bone. The epiphysis has a more homogenous appearance.
Growth stage: Re-ossification; the normal femoral shape is approached.
Definitive stage: The final shape is determined, with joint congruency or incongruency.
Pathologic Features and Staging
Pathologically, the early stages of the disease are characterized by overgrowth of the articular cartilage medially and laterally.81,82 Infarction within the femoral head can lead to trabecular fracture and decreased epiphyseal height. The pathologic stages based on epiphyseal involvement are:
Initial stage: There is necrosis of epiphyseal bone and marrow, vascular invasion of dead bone, and hypertrophy of epiphyseal cartilage.
Fragmentation stage: The dead bone is resorbed, the unossified physeal cartilage in the metaphysis may produce cysts, and there is cartilage hypertrophy.
Reparative stage: Dead bone is replaced.
Green et al. have correlated the degree of epiphyseal extrusion with prognosis: when more than 20% of the epiphysis is extruded laterally, the prognosis is poor; when more than 50% of the femoral head is also involved, only 8% have good results.83 On radiographic examination, increased bony tissue density is found in the area of infarction, representing appositional new bone and calcification of necrotic marrow. Revascularization occurs through creeping substitution of necrotic bone with fibrocartilage, causing the fragmented appearance seen on plain-film radiographs during this phase of the disease. The thickened articular cartilage is repaired from subchondral bone and from within the abnormal cartilage anteriorly and laterally. Unossified cartilage that streams down from the growth plate can lead to metaphyseal cysts. In the late stages, the fibrocartilage is reossified. The last area to heal is superior and anterior.
Histologic changes in the epiphysis include disordered collagen fibrosis, increased proteoglycan concentration, and decreased structural glycoproteins. Infarction is characterized by histologic evidence of necrosis of epiphyseal bone and marrow, invasion of new blood vessels, and resorption of dead bone and new bone formation.
MR Imaging
MR imaging is used to identify both morphologic and signal characteristics of the femoral epiphysis in the early stages of radiographically negative disease (Fig. 3.92) and in more advanced disease (Fig. 3.93). In addition to a hypointense epiphyseal marrow center on T1- and T2-weighted images, associated findings include an intra-articular effusion and a small, laterally displaced ossification nucleus.84,85 Sagittal T1- and
T2-weighted images also are useful for displaying acetabular and femoral head cartilage. Metaphyseal irregularities and subchondral hyperintensity are identified on FS PD FSE coronal images (Fig. 3.94).
T2-weighted images also are useful for displaying acetabular and femoral head cartilage. Metaphyseal irregularities and subchondral hyperintensity are identified on FS PD FSE coronal images (Fig. 3.94).
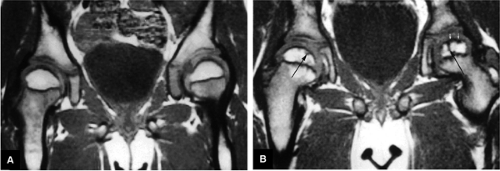 FIGURE 3.92 ● T1-weighted coronal images in LCP. (A) Normal femoral head capital epiphyses. (B) The earliest MR signs of LCP include peripheral irregularity of marrow-fat-containing epiphyseal ossification center (white arrows). Low-signal-intensity foci or linear segments are seen within the right and left ossification centers (black arrows). No subarticular collapse is present, and conventional radiographs are normal (TR, 500 msec; TE, 20 msec). |
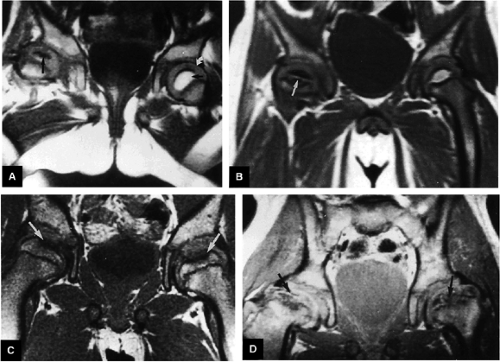 FIGURE 3.93 ● Coronal T1-weighted images show the spectrum of LCP from (A, B) early to (C, D) late advanced involvement. (A) Small, laterally displaced ossific nucleus with loss of yellow marrow signal intensity (long black arrow) is present early in the disease. Normal contralateral epiphyseal cartilage (curved arrow) and high-signal-intensity marrow (short black arrow) are seen. (B) Complete loss of right femoral epiphyseal marrow signal intensity (arrow) occurs as the disease progresses. (C) Bilateral low-signal-intensity osteonecrotic foci in the femoral epiphysis (arrows) become apparent later in the disease. Articular cartilage is thinner in the older child. (D) Advanced remodeling with coxa plana and coxa magna of the femoral heads (arrows) is indicative of late advanced involvement. (TR, 600 msec; TE, 20 msec.) |
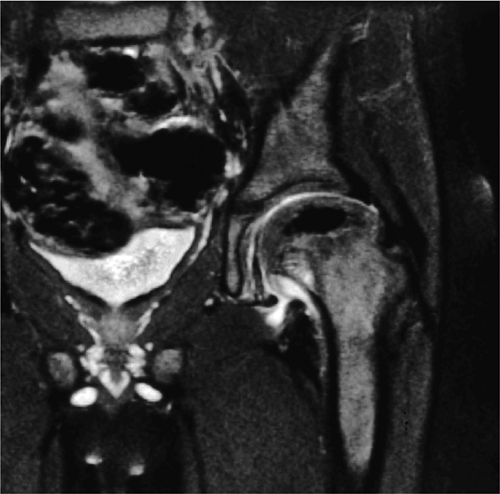 FIGURE 3.94 ● LCP with hypointense ischemic capital epiphysis associated with medial metaphyseal irregularity. Coronal FS PD FSE image. |
Typical features seen on T1- or PD-weighted images include:
Hypointense intra-articular effusion
Hypointense irregularity along the periphery of the ossific nucleus. Before diffuse loss of signal intensity of the ossific nucleus is observed, low-signal-intensity irregularity occurs along the periphery of the fat-containing ossific nucleus, and linear areas of low signal intensity may traverse the femoral ossification center. These changes correlate with positive bone scintigraphy in stage I disease.
Replacement of the initial low-signal-intensity focus with high-signal-intensity marrow fat is associated with revascularization of a necrotic epiphysis after treatment with varus osteotomy.
Coxa plana and coxa magna as a result of late remodeling
FS PD or T2-weighted FSE images are used to assess articular cartilage thickness and chondral irregularities. Characteristic changes on these images include the following:
In the early stages of disease, physeal cartilage may or may not be hyperintense on T2-weighted images.
Loss of containment of the femoral head in the acetabulum is indicated by intermediate-signal hypertrophied synovium in the iliopsoas recess, seen as a frond-like structure adjacent to the inferomedial joint space. Rush et al. reported these findings in 7 of 20 cases.86 Thickening of the intermediate-signal epiphyseal cartilage also contributes to loss of containment.87
Hyperintense joint effusion
Since articular cartilage demonstrates increased signal intensity on T2*-weighted images (Fig. 3.95), this sequence is useful in evaluating the thickness of the articular cartilage, which may be increased in the initial stages of LCP. FS PD FSE or STIR (including FSE STIR) sequences are more accurate than gradient-echo techniques, however, in demonstrating degenerative changes of the articular cartilage with the influx of fluid in areas of articular cartilage irregularity. The physeal cartilage may also demonstrate increased signal intensity on T2-weighted images in early-stage disease.87 Coronal or sagittal images may be used to display both acetabular and femoral head cartilage surfaces. Measurements of acetabular and femoral head articular cartilage show an increased thickness in affected hips.
Ranner, in a study of 13 patients with LCP among 45 patients presenting with acute hip pain, demonstrated that MR imaging was as sensitive as isotope bone scans and allowed more precise localization of involvement than conventional radiography.88 Although revascularization of the necrotic focus may be more accurately determined with nuclear scintigraphy, MR imaging is preferable for evaluating the position, form, and size of the femoral head and surrounding soft tissues. Bone marrow edema, detected on MR scans in pediatric patients with symptomatic hips, may resolve without resultant osteonecrosis. Cartilaginous physeal and metaphyseal abnormalities identified on MR imaging are common in LCP and frequently result in growth arrest. Transphyseal bone bridging and metaphyseal extension of physeal cartilage were seen in 63% and 81% of cases, respectively, and were strong predictors of abnormal growth.87 Epiphyseal abnormalities, seen in a majority of cases, are not associated with growth disturbances.
Treatment
It is important to determine prognosis at the time of presentation, because more than 50% of patients with LCP do well with no treatment.89 The younger the child and the earlier the stage at the time of presentation, the better the prognosis. Children who present after 8 years of age tend to do poorly (Fig. 3.96), as do those who present with both epiphyseal and metaphyseal changes. Catterall has identified clinical and radiographic “head at risk” signs that he correlated with the chance of developing significant femoral head deformity.78 Clinically, progressive loss of movement, adduction contracture, flexion with abduction, and obesity are all poor prognostic signs. The epiphyseal signs are calcification lateral to the epiphysis and a lytic area laterally (Gage—s sign). In the metaphysis, horizontal inclination of the growth plate and diffuse metaphyseal reaction are risk factors. Two or more of these signs correlate with a poor prognosis.78 Lateral subluxation of the femoral head is also associated with a poor outcome. In general, girls do not do as well as boys and may have a more severe form of the disease. The natural history of the disease usually includes the development of leg length inequality and thigh atrophy.
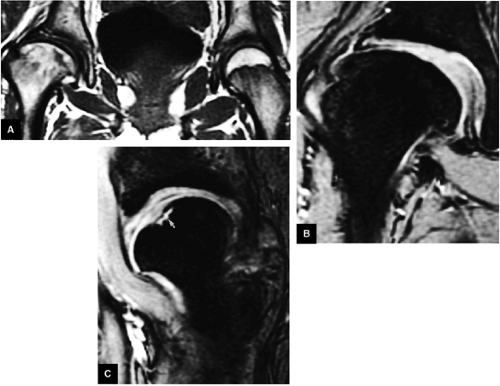 FIGURE 3.95 ● An 11-year-old girl with chronic changes of LCP on the right. There is enlargement of the right capital epiphysis with decreased superolateral coverage, and loss of epiphyseal height on coronal T1-weighted (A) and T2* (B) images. The T2* coronal image (B) shows flattening of the femoral head and acetabulum. A sagittal T2* image (C) identifies the hyperintense anterior epiphyseal involvement (arrows). The overlying articular cartilage appears more congruent than the necrotic focus within the capital epiphysis. |
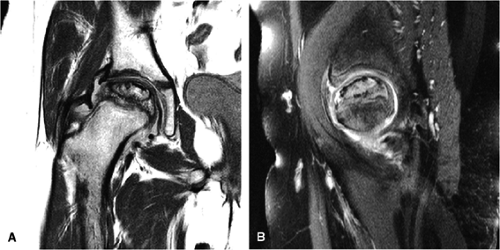 FIGURE 3.96 ● An 11-year-old with LCP. A coronal T1-weighted image (A) and a sagittal FS PD FSE image (B) show total epiphyseal necrosis, fragmentation, and flattening. Joint effusion is hyperintense on the FS PD FSE image (B). Presentation after 8 years of age is associated with a poor prognosis. |
Separate prognostic criteria have been developed for children who present after skeletal maturity. Mose90,91 states that evaluation of the shape of the femoral head is predictive of the eventual outcome. Stulberg—s classification90,91 also predicts long-term performance. Coxa plana and coxa magna are poor prognostic signs, as are arthritis (defined by a 2-mm or more deviation off the Mose circular template—Mose “fair” to “poor” outcome), greater than 20% epiphyseal extrusion, or more than 50% femoral head involvement.
Decisions about whether to treat a particular patient can be difficult. Approximately 50% of patients improve with no treatment, and some clinicians recommend conservative treatment (e.g., observation, bed rest, abduction, stretching, and bracing). Surgical treatment consists of femoral/pelvic osteotomies to contain the hip.
Catterall recommends definitive treatment for all “at risk” cases, for groups II and III disease in patients older than 7 years of age, and for group IV cases in which serious deformity has not occurred.78 A more conservative approach can be taken with group I cases and group II and III cases that are not “at risk.” Arthrography may be helpful in determining incongruity of the femoral head. After healing is established radiographically, treatment is not required because the femoral head will not deteriorate further. Radiographic signs of healing are an increase in the height and size of viable bone on the medial side of the epiphysis and an increase in the height and quality of new bone formed laterally.
The principles of treatment involve restoring hip motion and decreasing the forces across the hip joint. To accomplish this, the femoral head must be positioned within the acetabulum. This can be achieved with physical therapy and bracing or femoral osteotomy. Neither treatment modality is clearly superior, and both have advantages and disadvantages. In the long term, approximately 86% of patients develop OA, but most are able to function relatively well until the fifth or sixth decade of life.92
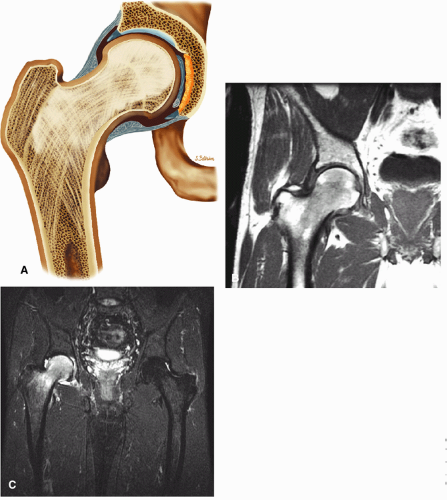 FIGURE 3.97 ● Transient osteoporosis of the hip with partial marrow-sparing of the greater trochanter and medial femoral head. No subchondral fracture is identified. (A) Coronal color section. (B) Coronal T1-weighted image. (C) Coronal FS PD FSE image. |
Bone Marrow Edema Pattern (Including Transient Osteoporosis of the Hip, Transient Bone Marrow Edema Syndrome, and Osteonecrosis)
The term bone marrow edema pattern refers to nonspecific MR signal intensity changes, including hypointensity on T1-weighted images and hyperintensity on conventional T2-weighted, FS PD FSE, or STIR images.93 Bone marrow edema encompasses the entities of transient osteoporosis of the hip, transient bone marrow edema syndrome, and osteonecrosis. A nonspecific bone marrow edema pattern may also be observed in cases of occult osseous trauma, infection, and neoplasms, although these entities can usually be distinguished.
Transient Osteoporosis of the Hip
Pearls and Pitfalls
Transient Osteoporosis
Most cases actually represent subchondral femoral head stress fractures, which can be appreciated on small-FOV images.
There is marrow sparing in the medial femoral head and greater trochanter.
Transient osteoporosis of the hip (TOH) has also been referred to as transient osteonecrosis or algodystrophy. TOH represents a self-limited diffuse bone marrow edema of the femoral head and neck (Fig. 3.97)94 and must be differentiated from AVN, tuberculosis, stress fracture, malignancy, synovial chondromatosis, and pigmented villonodular synovitis (PVNS). With the use of phased-array hip surface coils it is possible to identify subtle subchondral subarticular stress (Fig. 3.98) and insufficiency fractures that were previously overlooked, resulting in the inappropriate diagnosis of TOH.
Diagnosis, Etiology, and Clinical Features
The disease process is self-limited and of unknown etiology. It was originally described in women in the third trimester of pregnancy with a predilection for the left hip, although it is most commonly found in healthy middle-aged men in the third and fourth decades. These may both, in fact, represent populations at risk for stress or insufficiency fractures. TOH is characterized by progressive bone demineralization. Clinical features include:
Acute onset of groin pain, which is exacerbated by weight-bearing
Decreased range of motion
Limp
History negative for infection or trauma
Resolution of symptoms after 6 to 10 months and restoration of mobility
One joint is usually affected, with diffuse involvement of the femoral head and variable extension to the femoral neck and intertrochanteric region. The laboratory evaluation is unremarkable except for intermittent elevation in the sedimentation rate. Pathologic and histologic findings include:
Elevation of pressure within bone marrow
Normal appearance of articular cartilage, cortex, and subchondral bone
A small joint effusion
Synovial inflammation
Possible necrosis of fat cells
Fibrovascular regenerative tissue
Increased osteoid
Edema, although it is difficult to document increased free water histologically
Hydroxyapatite shift and reduced mineral content
Radiography
Radiographs are usually normal in the first few days, and although plain films reveal osteopenia around the hip joint, these changes may lag 3 to 6 weeks behind the development of groin pain. Radiographic changes frequently develop after positive findings are made on bone scintigra-phy, which shows intense homogeneous uptake within the femoral head and neck. Although demineralization is present in the active phase of the disease, the radiographic picture eventually returns to normal. Morphologically, changes are variable within the confines of the femoral head and neck, and there may be partial marrow sparing in the greater trochanter.
MR Appearance
MR imaging is useful for characterization of the low signal intensity seen on T1-weighted images and the uniform increased signal intensity seen on conventional T2-weighted, FS PD FSE, or STIR (including FSE STIR) images (see Fig. 3.97). Signal intensity changes may be seen extending from the femoral head to the intertrochanteric line.95 Associated joint effusions are commonly seen on T2-weighted and STIR images.96,97 Resolution of clinical and MR abnormalities usually occurs within 6 to 10 months. Since biopsy reveals histopathologic evidence of increased bone turnover and a mild inflammatory reaction, the signal intensity changes in transient osteoporosis of the hip are thought to be related to an increased amount of free water.
Typical findings on T1- or PD-weighted FSE images include:
Diffuse or large areas of hypointensity within the femoral head and neck, sometimes extending to the intertrochanteric region and/or the acetabulum
A narrow line of sclerosis associated with a subchondral stress fracture
A homogeneous and well-marginated edema pattern
There may be a hypointense joint effusion.
There may be marrow sparing in the medial and lateral-most margins of the femoral head and greater trochanter secondary to higher concentrations of fatty marrow.
Resolution is associated with web-like or reticular areas of hypointensity.
Typical findings on FS PD FSE or STIR images include:
Hyperintensity in the femoral head and neck, which is most conspicuous on FS PD or STIR images, sometimes accompanied by acetabular hyperintensity
A hypointense fracture line parallel to the subchondral plate (high-resolution imaging is necessary for visualization)
Marrow edema, which can be seen as early as 48 hours after the onset of clinical symptoms
Marrow sparing may be seen in the anterior, posterior, medial, or lateral aspect of the femoral head.
The anatomic distribution of marrow hyperintensity may vary on sequential studies.
The edema interface is well defined without a demarcating hypointense line or band (no double-line sign).
The cortex and subchondral plate are normal, as are adjacent soft tissues.
There is a small to moderate hyperintense joint effusion.
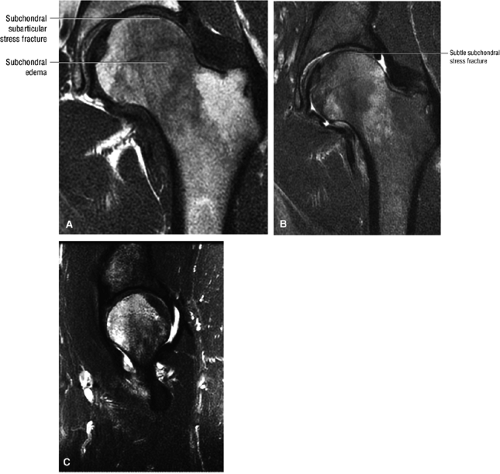 FIGURE 3.98 ● A 40-year-old male patient with subtle subchondral stress fracture easily mistaken for transient osteoporosis. (A) Coronal T1-weighted image. (B) Coronal FS PD FSE image. (C) Sagittal FS PD FSE image. |
After contrast administration there is heterogeneous, prominent enhancement.
Transient Bone Marrow Edema Syndrome
Transient bone marrow edema syndrome refers to a reversible bone marrow edema pattern without the associated radiographic changes of osteopenia. Transient bone marrow edema syndrome, like transient osteoporosis of the hip, is self-limited and may in fact represent a form of transient osteoporosis of the hip. Evaluation of associated subchondral stress or insufficiency fractures requires the use of high-resolution techniques.
Osteonecrosis
Osteonecrosis may also present with a diffuse bone marrow edema pattern that either partially obscures a poorly defined subchondral focal lesion (pseudohomogeneous bone marrow edema pattern) or precedes the development of a discrete well-demarcated focus of osteonecrosis. Patients with transient osteoporosis of the hip or transient bone marrow edema syndrome do not have the associated common risk factors usually seen in osteonecrosis. Histologically, transient osteoporosis of the hip and AVN may show similar findings of edema, necrosis, and a fibrovascular reaction. Transient osteoporosis of the hip may thus represent an early reversible form of osteonecrosis.98 Initial reports show that treatment of bone marrow edema syndrome with drilling shortens the duration of pain and illness compared with conservative management.
Slipped Capital Femoral Epiphysis
Pearls and Pitfalls
Slipped Capital Femoral Epiphysis
Characterized by posterior inferior displacement of the proximal femoral epiphysis
MR demonstrates a widened growth plate and epiphyseal slippage.
Arthroscopy is used to evaluate articular cartilage and labral injury and to decompress hematoma caused by physeal fracture.
Slipped capital femoral epiphysis (SCFE) is a childhood disorder of the hip characterized by posterior inferior displacement of the proximal femoral epiphysis.99
Diagnosis, Etiology, and Clinical Features
Although the precise etiology is unknown, current theories indicate that obesity, trauma, and hormonal abnormalities are associated with the development of the disease.100 Mechanically, a vertical growth plate and retroversion of the femoral neck appear to be risk factors.101 Histologically, the slip occurs through the zone of hypertrophy in the growth plate. Agamanolis et al. demonstrated a generalized chondrocyte degeneration throughout the growth plate, suggesting a primary pathology.102
The child with SCFE usually presents with pain and a limp. Often the pain is located only in the thigh or knee, leading to frequently missed diagnoses. It is important to remember that knee pain in the child can be secondary to hip disease. On physical examination, there is frequently limitation of motion, especially internal rotation and abduction. As the examiner flexes the hip, it moves into external rotation, and the patient often holds the leg externally rotated when standing.
Initial evaluation should include both AP and frog lateral radiographs. Since the major direction of the slip is usually posterior, it is often most easily noted on a frog lateral view. Both hips should be evaluated, because slips are bilateral in 20% to 25% of cases. Commonly there is impaction of the articular cartilage between the acetabulum and femoral head, and increased friction on joint cartilage subsequent to the slippage during joint motion. Evacuation of hematoma by arthroscopic lavage is associated with decreased pain and earlier postoperative motion and weight-bearing.
Classification
SCFE can be classified according to either the duration of symptoms or the degree of slippage. Acute slips may be diagnosed in patients who have had symptoms for less than 3 weeks and in whom no chronic radiographic changes are found. Symptoms lasting 3 weeks or longer indicate a chronic slip, and chronic radiographic changes include resorption of the superior femoral neck and new bone formation on the inferior femoral neck. An acute-on-chronic slip has chronic symptoms and radiographic changes with acute progression of the slip. Slips are also classified as mild, moderate, or severe based on the degree of slippage.
MR Imaging
Although MR imaging has played a limited role in the evaluation of SCFE, it is possible to display the morphology of the articular cartilage epiphysis prior to the development of bright-signal-intensity fat within the femoral ossification center.88 The widened growth plate and epiphyseal slippage are clearly demonstrated on MR images (Fig. 3.99). MR imaging may also be useful in identifying associated osteonecrosis—reported in up to 15% of children—prior to its appearance on conventional radiographs.103 Associated incongruity of the joint surfaces and changes in the articular cartilage covering of the femoral head and acetabulum are best seen on coronal and axial plane images. The relationship of the femoral epiphysis to its containment within the acetabulum is best displayed on axial images showing anterior and posterior position relative to the acetabulum.
Arthroscopy
Arthroscopy104 is used in both evaluation of the articular cartilage and labral injury in SCFE and for decompression of the hematoma resulting from physeal fracture. Common findings include:
Posterolateral labral injuries (compared to posterosuperior labral tears in young patients with occult hip pain)
Erosion of the anterosuperior acetabular cartilage
A transverse cleft in the anterior femoral head
Metaphyseal cartilage damage
Treatment
Treatment of SCFE is aimed at stabilizing the femoral capital epiphysis to allow early fusion of the growth plate. For
mild to moderate slips, the most common procedure is in situ pinning. Many types of hardware are used, including a variety of multiple pin techniques and single screws. With severe slips, some advocate a gentle closed reduction, open reduction, or cuneiform osteotomy.105 The complication rate is high with internal fixation.106 Chondrolysis may occur and has been attributed to pin penetration. Unrecognized pin penetration is a major problem. AVN, another serious complication of treatment in SCFE, may follow closed reduction, open reduction, osteotomy, or vascular damage from internal fixation. It is important to remember that this is an iatrogenic complication. Because of the high complication rate with internal fixation, bone graft epiphysiodesis has gained popularity in some centers.107 In the long term, the resultant biomechanical abnormality predisposes the patient to degenerative arthritis.108
mild to moderate slips, the most common procedure is in situ pinning. Many types of hardware are used, including a variety of multiple pin techniques and single screws. With severe slips, some advocate a gentle closed reduction, open reduction, or cuneiform osteotomy.105 The complication rate is high with internal fixation.106 Chondrolysis may occur and has been attributed to pin penetration. Unrecognized pin penetration is a major problem. AVN, another serious complication of treatment in SCFE, may follow closed reduction, open reduction, osteotomy, or vascular damage from internal fixation. It is important to remember that this is an iatrogenic complication. Because of the high complication rate with internal fixation, bone graft epiphysiodesis has gained popularity in some centers.107 In the long term, the resultant biomechanical abnormality predisposes the patient to degenerative arthritis.108
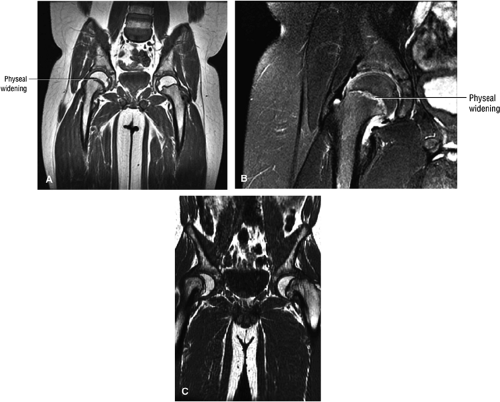 FIGURE 3.99 ● SCFE. (A, B) The femoral epiphysis is displaced posteriorly, medially, and inferiorly relative to the neck. There is widening of the physis with associated joint effusion. There is a relative decrease in the height of the epiphysis (similar to changes seen on conventional radiographs) and loss of intersection of the epiphysis by the lateral cortical (long axis) line of the femoral neck. The subsequent remodeling of the femoral neck creates a Herndon bump directly lateral to the physeal scar, similar to the location of the dysplastic femoral bump in FAI. (A) Coronal T1-weighted image. (B) Coronal FS PD FSE image. (C) A separate case showing a more severe Salter-Harris type I fracture contributing to varus hip deformity. Coronal T1-weighted image. |
Developmental Dysplasia of the Hip
Pearls and Pitfalls
Developmental Dysplasia of the Hip
Classification of DDH is based on the configuration of the acetabulum and labrum.
Identification of the capital epiphysis location requires both coronal and axial images.
In mild DDH, anterior coronal MR images display an increased slope of the acetabulum.
DDH in the young adult may be associated with acetabular labral pathology and acetabular rim syndrome.
In developmental dysplasia of the hip (DDH), also known as infantile hip dysplasia, there is inadequate contact between the acetabulum and the femoral head. The left hip is affected in 40% to 60% of cases and bilateral involvement occurs in 20%. Infants at risk for DDH include those with a positive family history, breech presentation, torticollis, scoliosis, metatarsus adductus, and structural abnormalities such as underdevelopment of the anterior capsule, ligament of Bigelow, or rectus muscle.99 Early diagnosis and treatment are important, because in the first 6 weeks postpartum the acetabulum is susceptible to remodeling.
Diagnosis, Etiology, and Clinical Features
DDH, which occurs in 1.5% of neonates, is considered a multifactorial/polygenic trait, and the etiology includes both genetic and environmental factors. DDH occurs more frequently in females (6:1 female to male ratio), and other risk factors include a positive family history, breech presentation, torticollis, and scoliosis. There are mechanical factors, such as acetabular dysplasia and laxity of joint capsule ligaments, as well as physiologic factors, such as elevated maternal estrogen level.
Typical pathologic and histologic findings include:
An hourglass joint capsule with compression between the limbus and the ligamentum teres
A thick and tight transverse ligament
Medial flattening of the femoral head
Deficiency of the superior and posterior acetabular rim
Hyperplasia of the ligamentum teres
Hypertrophy of the pulvinar
Clinical Tests
Ortolani—s and Barlow—s tests are used to assess the dislocated and dislocatable hip, respectively, in the newborn. In Ortolani—s test, hip abduction at 90° flexion with anterior pressure directs the dislocated femoral head into the acetabulum. In Barlow—s test, an unstable femoral head can be dislocated by application of posterior pressure in adduction. A positive finding is indicated by a palpable click or clunk using either test.
Radiography
Radiographic diagnosis of DDH is more accurate than either of the clinical tests. It should be noted, however, that in children under 6 months of age, radiography may produce a false-negative diagnosis. In addition, a 45° bilateral abduction and internal rotation view or Van Rosen view may prematurely reduce the positionally unstable hip.
Conventional radiographic assessment of the ossific nucleus relative to Hilgenreiner—s line (through triradiate cartilage) demonstrates its location in the lower medial quadrant. Perkins— line (perpendicular to Hilgenreiner—s line) is seen through the lateral acetabular rim. Shenton—s line, connecting the medial border of the femoral metaphysis and the superior border of the obturator foramen, should form a smooth uninterrupted arc in the normal hip, with no subluxation or dislocation. The femoral capital epiphysis is seen in the inner lower quadrant. There may be lateral subluxation of the capital epiphysis (2 mm or more from teardrop to metaphysis) and superior subluxation (a change of 2 mm or more from Hilgenreiner—s line to the metaphysis compared with the normal side). A center-edge angle less than 25° is also associated with instability. The acetabular index (i.e., the slope of the ossified acetabular roof), which is 27° to 30° at birth, is an unreliable measurement in newborns and changes with rotation of the pelvis.
Secondary signs include excessive femoral head ante-version and delayed ossification of the femoral capital epiphysis.
Ultrasound
Ultrasonography is often used to evaluate the cartilaginous femoral head prior to the appearance of the ossific nucleus, subluxation, dislocation, the pulvinar, an inverted labrum, a hypoplastic ossific nucleus, acetabular dysplasia, and ossification in children up to 6 months of age. In fact, this technique may also be used in older children. Sonographic findings of increased thickness of the acetabular cartilage are reported to be an early sign of DDH.109 The iliac bone, the acetabulum, the labrum, and the femoral capital epiphysis can all be assessed on ultrasound scans. Osseous dysplasia of the acetabular rim and coverage of the acetabular roof can also be evaluated. Ultrasound is also used to classify hips, as described below.
CT Examination
CT, using a limited number of axial or coronal CT scans with reformations and optional 3D renderings, may be a more appropriate modality for children in plaster
casts or with equivocal conventional radiographs.110,111 The sector angle should be used to evaluate acetabular coverage (from the capital epiphysis to acetabular rim relative to the horizontal axis).
casts or with equivocal conventional radiographs.110,111 The sector angle should be used to evaluate acetabular coverage (from the capital epiphysis to acetabular rim relative to the horizontal axis).
MR Imaging
MR imaging can be successfully used in the detection and evaluation of DDH (Fig. 3.100).108,110,112 The femoral epiphyseal articular cartilage displays intermediate signal intensity on T1-weighted images and bright signal intensity on gradient-echo images. T1-weighted coronal and axial images display the exact position of the intermediate-signal-intensity capital epiphysis, which is particularly useful when the position of the capital epiphysis is uncertain on conventional radiographs and when serial follow-up examinations are required. MR examination can be used for children in or out of plaster casts, eliminating the need to repeatedly expose the child to ionizing radiation. It is also useful when the ossific nucleus is not yet visible on plain radiography or CT. T2-weighted images are helpful when evaluating complications associated with DDH, such as ischemic necrosis and associated effusions, which are not effectively detected with ultrasound or conventional radiography. 3D MR rendering is useful in displaying complex femoral head and acetabular spatial relationships, as well as associated dysplasia.113 Calculation of the acetabular index may be performed on coronal MR images by measuring Hilgenreiner—s line through the triradiate cartilage and the tangent through the acetabular roof. The acetabular index should be less than 30°; however, as mentioned earlier it is an unreliable measurement in newborns.
Additional findings on T1- or PD-weighted FSE images include:
Hypointense joint effusions
Superolateral dislocation (on coronal plane images)
AP relationship and dysplasia of acetabulum (on axial images)
Mild acetabular dysplasia (on coronal images)
Hyperintense fat signal of the pulvinar
On FS PD FSE images the epiphyseal articular cartilage demonstrates intermediate signal intensity and joint effusions are hyperintense. On T2* GRE images the epiphyseal articular cartilage is hyperintense. Associated ischemic necrosis is hypointense on T1- and PD-weighted images and hypointense in chronic ischemia on FS PD FSE images.
With MR imaging, failure to achieve adequate reduction of the dislocated hip can be determined without the use of invasive arthrography.114 Important elements in evaluating failure of reduction include the following:
An hourglass configuration of the acetabulum or an inverted, hypertrophied limbus must be excluded. With inversion, the intermediate-signal-intensity limbus is often seen in the lateral aspect of the joint, with increased fat (i.e., high signal intensity on T1-weighted images) noted medially.
On coronal and sagittal images an interposed iliopsoas tendon can be seen crossing the joint space. This prevents reduction of the femoral head in the acetabulum and may create an hourglass configuration of the joint capsule.
Supralateral subluxation or dislocation is best identified on coronal MR images, and AP relationships and dysplasia of the acetabular wall are best demonstrated on axial plane images.
MR allows direct visualization of the fat-suppressed pulvinar fibrofatty tissue.
There is hypertrophy of the hypointense ligamentum teres.
The labral limbus is deformed and has a horizontal slope instead of the normal downward lateral slope.
On coronal images the limbus of the acetabular roof is inverted with inferomedial displacement and a superoinferior long axis orientation.
The coronal plane is the most useful for evaluating acetabular labral coverage beyond the lateral margin of the bony acetabulum relative to the femoral capital epiphysis (see Fig. 3.100). This is important in determining the coverage of the femoral head and the possible need for increased coverage through surgical osteotomy. If adequate coverage is provided by the bony acetabulum and acetabular labrum together, more conservative management of DDH may be appropriate.
MR imaging is also useful in the long-term follow-up and postoperative evaluation of patients with DDH. There is no artifact from plaster or fiberglass abduction spica casts, allowing noninvasive evaluation of the femoral head. Sequelae of DDH may require reconstruction of the acetabulum using a pelvic osteotomy or shelf procedure to redirect, reposition, and augment the hip socket. Later in life, patients often develop secondary OA requiring total hip replacement.
Classification
DDH is classified according to the configuration of the acetabulum and the limbus.115 The modified Graf classification defines four types based on the alpha (acetabular roof) angle (the alpha angle is the geometric complement of the acetabular index angle):
Type 1: The alpha angle is greater than 60° in the mature hip. This is considered a normal hip.
Type 2a: The alpha angle is 50° to 59° in the immature hip (infants less than 3 months of age).
Type 2b: In infants more than 3 months of age with an alpha angle of 50° to 59°, the hip is considered abnormal.
Type 2c: The alpha angle is 43° to 49° and the hip is considered critical and subject to subluxation.
Type 3: The alpha angle is less than 43°, the acetabular head is eccentric, and the hip is subject to dislocation.
Type 4: The alpha angle is less than 43°, and there is severe dysplasia and an inverted labrum.
In dislocation of the femoral epiphysis, the femoral head is uncovered by the cartilaginous acetabulum and displaced superolaterally. The hourglass configuration of the joint capsule
is caused by compression between the limbus and the ligamentum teres. Constriction by the iliopsoas tendon may block attempts at reduction. Most cases of DDH present with a type 1 hip and positional instability. Failed hip reduction may be secondary to thickening of the ligamentum teres, an unfolded or blunted limbus, and severe deformity of the acetabulum or femoral head.
is caused by compression between the limbus and the ligamentum teres. Constriction by the iliopsoas tendon may block attempts at reduction. Most cases of DDH present with a type 1 hip and positional instability. Failed hip reduction may be secondary to thickening of the ligamentum teres, an unfolded or blunted limbus, and severe deformity of the acetabulum or femoral head.
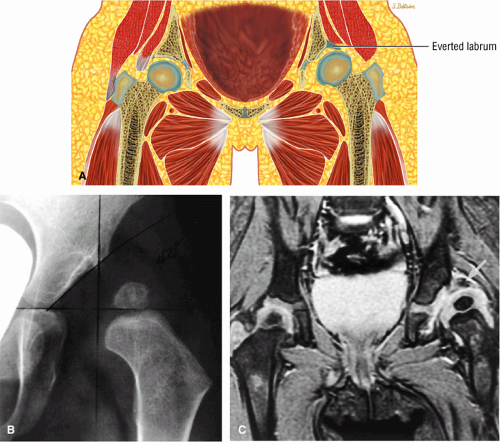 FIGURE 3.100 ● DDH. (A) Pseudo-coverage of the capital epiphysis by an everted labrum. Coronal radiograph (B) shows complete lateral uncovering of the femoral capital epiphysis associated with a shallow acetabulum. A corresponding T2* coronal MR image (C), however, demonstrates improved coverage by a mildly deformed but primarily everted labrum (arrows). |
DDH in the Adolescent and Adult
In the adolescent or young adult presenting with hip pain, the diagnosis of DDH is often associated with acetabular labral pathology. In the acetabular rim syndrome (Fig. 3.101), findings are similar to those described for femoroacetabular impingement (see discussion below) in the nondysplastic acetabulum, and the acetabular rim syndrome may also represent a precursor to the development of OA. As in FAI, DDH is not a direct cause of hip pain. The morphologic changes of DDH, however, make the hip more susceptible to intra-articular pathology, which may then produce symptoms. The structures vulnerable to injury in adult DDH include:
The acetabular labrum
The articular cartilage of the acetabular roof
The ligamentum teres
The shallow acetabulum in DDH is associated with a hypertrophied acetabular labrum (Fig. 3.102). It was initially thought that in children increased labral coverage would provide the support needed to maintain hip stability and obviate the need for an osteotomy. Although the enlarged labrum may not substitute for the lateral acetabulum in a child, it is thought to have a partial stabilizing and weight-bearing role in the DDH
patient. Unfortunately, the hypertrophic labrum is exposed to greater joint reaction forces and is at an increased risk for symptomatic tearing. The acetabular labrum may also become inverted, entrapped, and subsequently torn. Direct contact between the hypertrophied labrum and the femoral head chondral surface may produce a chondral crease demarcating a femoral head bump formed proximal to the physeal scar. This finding is associated with a lateral acetabular rim or the DDH equivalent of FAI. Anterior coronal MR images evaluated at the level of the anteriormost portion of the femoral head are sensitive to asymmetry in the slope of the acetabulum. The anterior acetabular roof should maintain a relatively horizontal slope and not open up or deviate from the horizontal plane.
patient. Unfortunately, the hypertrophic labrum is exposed to greater joint reaction forces and is at an increased risk for symptomatic tearing. The acetabular labrum may also become inverted, entrapped, and subsequently torn. Direct contact between the hypertrophied labrum and the femoral head chondral surface may produce a chondral crease demarcating a femoral head bump formed proximal to the physeal scar. This finding is associated with a lateral acetabular rim or the DDH equivalent of FAI. Anterior coronal MR images evaluated at the level of the anteriormost portion of the femoral head are sensitive to asymmetry in the slope of the acetabulum. The anterior acetabular roof should maintain a relatively horizontal slope and not open up or deviate from the horizontal plane.
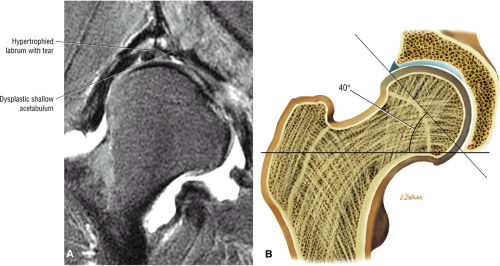 FIGURE 3.101 ● (A) DDH associated with longitudinal tearing of a hypertrophied labrum. The shallow slope of the acetabulum is demonstrated. The transverse angle of the osseous acetabular rim affects the degree of lateral coverage and is increased in adult DDH. (B) The normal angle of 40° is shown in contrast to (A). |
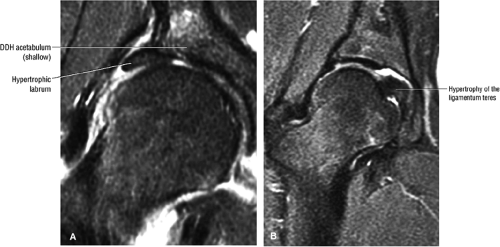 FIGURE 3.102 ● (A) Labral hypertrophy in DDH. (B) Mild labral hypertrophy and marked hypertrophy of the ligamentum teres in DDH. Coronal FS PD FSE images. |
Acetabular articular cartilage erosions occur in the lateral acetabular rim syndrome as a function of increased contact forces. There are acetabular chondral, subchondral, and femoral fibrocystic changes similar to those found in FAI in the adult patient.
The ligamentum teres may be hypertrophied (see Fig. 3.102) or elongated in association with lateral subluxation of the femoral head within the acetabulum. Calcification or ossification of the DDH labrum may be a response to buttress superolateral subluxation of the femoral head. Severe DDH is associated with remodeling of the femoral head and the development of a pseudocapsule as the femoral head is located superolateral to the shallow acetabulum (Fig. 3.103).
Treatment
DDH may result in limb shortening, FAI, degenerative changes, or AVN. If diagnosis and treatment are delayed, the outcome is irreversible dysplasia. However, early diagnosis and treatment produce good results. The type of treatment is dependent on the age at diagnosis. In infants up to 5 or 6 months of age, conservative treatment (closed reduction with a harness) is usually sufficient. Conservative treatment may also be successful in somewhat older infants, but a spica cast or orthosis is required. Surgery may be necessary in older children, especially those who are walking. Surgical procedures include adductor tenotomy with release of the iliopsoas muscle, open reduction, and osteotomy. Both varus (derotational) and reconstructive (Salter opening wedge, triple innominate, and Chiari medialization of femoral head) osteotomies may be used.
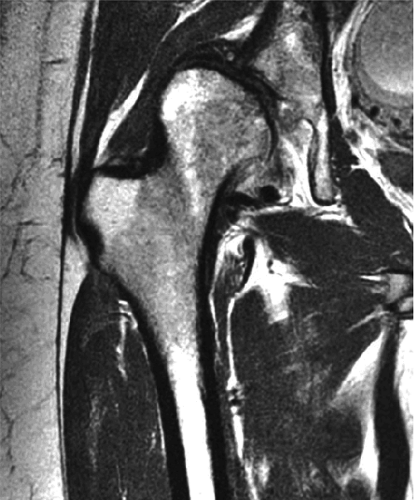 FIGURE 3.103 ● Chronic untreated DDH with superiorly displaced aspherical femoral head and deficient acetabular roof. Coronal T1-weighted image. |
Miscellaneus Pediatric Hip Conditions
Multiple epiphyseal dysplasia is an autosomal dominant condition affecting the epiphyseal chondrocytes of the growth plate with resultant joint incongruity and premature degenerative arthritis. MR imaging demonstrates irregularity of the femoral head and articular and cortical surfaces. Joint-space narrowing and secondary degenerative joint disease are present by the third or fourth decade of life.
Proximal focal femoral deficiency is a term used to describe a unilateral lack of or shortening of the proximal segments of the femur.99 The radiographic classification system (classes A through D) is based on the presence or absence of femoral head or acetabular dysplasia, and on the shape of the femoral segment.116 MR imaging is used to evaluate the pseudoarthrosis and subtrochanteric varus deformity. On MR examination, fibrous and osseous connections between the femoral head and shaft can be differentiated. In coxa vara, MR imaging is successful in displaying articular cartilage and epiphyseal morphology (Fig. 3.104).
Diaphyseal sclerosis, or Engelmann—s disease, is characterized by long bone sclerosis involving both endosteal and cortical surfaces with relative sparing of the epiphysis and metaphysis. Bilateral symmetry and varying degrees of pain are usually associated with this condition. Although MR imaging is not indicated as the initial study of choice, its use allows the assessment of low-signal-intensity cortical thickening without repeated exposure to ionizing radiation.
Muscle and Tendon Disorders and Hip Pain in the Athlete
Structure of Skeletal Muscle
The muscle fiber is the basic structural element of skeletal muscle. The contractile elements of skeletal muscle fibers are the Z-lines. The muscle-tendon unit (MTU) is a distal junction at risk for injury in muscle strains (see below). The muscle fiber arrangement relative to the long axis includes:
Parallel fibers (fusiform muscles)
Oblique fibers (pennate and bipennate muscles)
The surrounding connective tissue (Fig. 3.105) includes the perimysium, which surrounds fascicles (fascicles are arranged groups of fibers, and myofibrils are individual parts of the fibers that are a component of a fascicle); the endomysium, which surrounds the individual muscle fibers; and the epimysium, which surrounds the entire muscle.
Overuse Syndromes
Hip pain in the athlete is most commonly secondary to overuse, resulting in tendinitis, bursitis, or muscle strain. Runners are most prone to these types of injuries, which are often associated with repetitive drills or a change in the intensity or duration of a workout schedule. Muscle edema involving the adductor muscle groups can be demonstrated without tears in marathon and ultramarathon runners. The antagonist muscle groups are most susceptible to injury. Although the injury can occur anywhere within the muscle, the origin or insertion of the muscle is most likely to be affected. In the adductors, the resulting tendinitis and periostitis cause the so-called pulled groin. Similarly, the pulled hamstring usually is a result of periostitis-tendinitis at the ischial tuberosity, where the hamstring muscles originate.
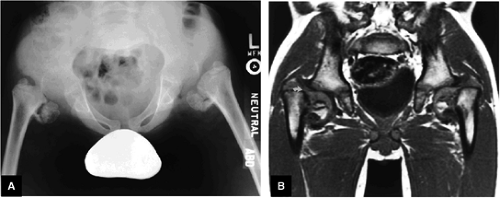 FIGURE 3.104 ● (A) Coxa vara with multiple epiphyseal dysplasia. (B) T1-weighted image documents the cartilaginous continuity (curved arrow) between the capital epiphysis and femur. |
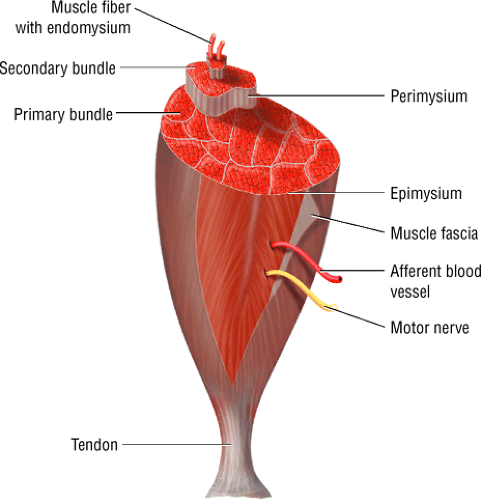 FIGURE 3.105 ● The structure of skeletal muscle. The endomysium surrounds the individual muscle fibers. The perimysium surrounds groups of fascicles made up of fibers. The epimysium surrounds the entire muscle. |
In evaluating the athlete with hip pain, a careful history is critical. The physician needs a detailed account of the training
habits of the athlete and any recent modifications to that regimen. On physical examination, pain can often be elicited with deep palpation in the area of the musculotendinous junction or the muscle itself. In addition, pain with resistive muscle contraction can localize the traumatized muscle group.
habits of the athlete and any recent modifications to that regimen. On physical examination, pain can often be elicited with deep palpation in the area of the musculotendinous junction or the muscle itself. In addition, pain with resistive muscle contraction can localize the traumatized muscle group.
Muscle Strains
Pearls and Pitfalls
Muscle Strains
The MTU is the weakest biomechanical link and therefore is most often the location of muscle fiber failure.
Infection or deep venous thrombosis may be mistaken for a muscle strain.
Grade I muscle injuries are associated with a feathery edema pattern of muscle fibers.
Muscle strain 117 has been defined as an indirect injury to muscle caused by excessive stretch and overuse resulting in microtrauma, muscle, and myotendinous tearing. The MTU is the weakest link in the locomotor system117,118 and is often the site of muscle failure. Muscles at risk include those with the highest proportion of fast-twitch, type II muscle fibers (e.g., rectus femoris, biceps femoris, and medial gastrocnemius muscles)117,118 and those that cross multiple joints or have complex architecture. In addition, muscles that are subject to eccentric loading appear to be predisposed to strain.117,118
Diagnosis, Etiology, and Clinical Features
Muscle strains occur most often in young athletes, especially speed runners (sprinters), and football, basketball, and soccer players. They occur more often in males, probably because of participation in sports requiring highly eccentric muscle activities. Risk factors include improper warm-up, fatigue, and previous orthopaedic injury. Approximately 30% of sports-related injuries are muscle strains.
Clinically the patient presents with:
Muscle pain
Weakness, possibly associated with separation of muscle from tendon or fascia (absent in mild or first-degree strains with no myofascial disruption)
Edema and swelling
Loss of function in third-degree strains with complete myofascial separation
Associated gross pathologic and histologic findings include irregular thinning of the myotendinous junction, hematoma, partial or complete tears of the MTU, avulsion fractures, a hemorrhagic response at the injured fibers, muscle fiber necrosis, edema, and appearance of macrophages and other inflammatory cells and fibroblastic activity. Random disruption of Z lines, caused by damage to the contractile elements of muscle, may also be found.
Grading
Early reports indicated that the midsubstance location was the most common site of muscle strain,119 and a grading system similar to that used for ligament injuries was developed for this type of strain:120,121
Grade 1: Minimal disruption of the musculotendinous junction (Fig. 3.106). Clinically, a grade 1 strain may simply result in a muscle spasm or cramp.
Grade 2: A partial tear with some intact musculotendinous fibers (Fig. 3.107). Clinically, there is discomfort during sports activity or training, but it usually resolves with rest.
Grade 3: Complete rupture of the MTU (Fig. 3.108)
Grade 3B: Avulsion fracture at the tendon origin or insertion
A simpler grading system of MTU strains has been advanced in which injuries are characterized as mild, moderate, or severe.117,118 According to this scheme, if weakness is absent, the strain is mild, or first degree, and is believed to represent injury in the absence of myofascial disruption. To be
categorized as a mild strain, pathologic findings must be restricted to mild inflammatory cell infiltration, edema, and swelling. In moderate, or second-degree, strains, weakness is associated with a variable degree of separation of muscle from tendon or fascia. In severe, or third-degree, strains, myofascial separation is complete and there is an associated lack of muscle function.
categorized as a mild strain, pathologic findings must be restricted to mild inflammatory cell infiltration, edema, and swelling. In moderate, or second-degree, strains, weakness is associated with a variable degree of separation of muscle from tendon or fascia. In severe, or third-degree, strains, myofascial separation is complete and there is an associated lack of muscle function.
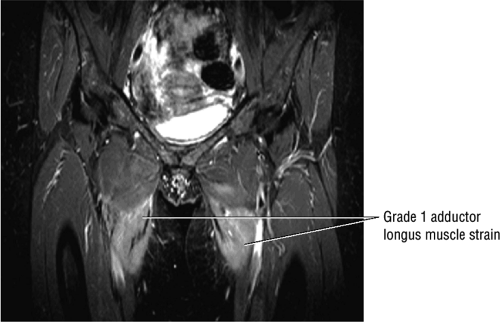 FIGURE 3.106 ● Bilateral adductor longus grade 1 muscle strain with diffuse hyperintense muscle edema. Coronal FS PD FSE image. |
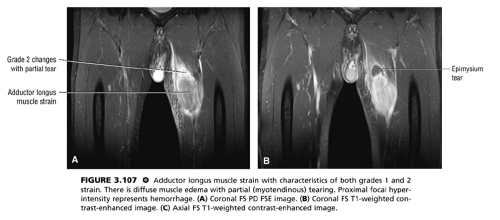 FIGURE 3.107 ● Adductor longus muscle strain with characteristics of both grades 1 and 2 strain. There is diffuse muscle edema with partial (myotendinous) tearing. Proximal focal hyperintensity represents hemorrhage. (A) Coronal FS PD FSE image. (B) Coronal FS T1-weighted contrast-enhanced image. (C) Axial FS T1-weighted contrast-enhanced image. |
Although initially appealing, such a grading system for characterizing muscle injuries may be deceptively simplistic. In fact, the clinical evaluation of muscle strains is admitted to be very difficult,121,122,123,124 even more so than injuries of tendons or bones.121 Only when the muscle bunches up on contraction is complete muscle rupture a straightforward clinical diagnosis. However, associated edema or hematoma may prevent palpation of the fascial defect.117,125 In addition, the fact that synergists are recruited when a single muscle is disrupted hinders the detection of muscle strains and limits the accuracy of clinical assessment. It may also be difficult to evaluate a muscle strain when the affected muscle is located in a deep site relative to intact, normal muscles. Furthermore, the apparent degree of weakness is dependent upon the presence of spasm, pain, guarding, and hematoma, all of which can occur in the absence of a fascial tear. Further complicating the clinical picture is the fact that on the one hand large fascial tears may be associated with relatively little muscle abnormality, and on the other the MTU may be functionally impaired because of muscle spasm, even when it is structurally intact.121 Fluid collections also frequently accompany strains, making the assessment of the injured muscle even more problematic.118 Fluid collections themselves may be a cause of swelling and weakness in the absence of fascial tear.
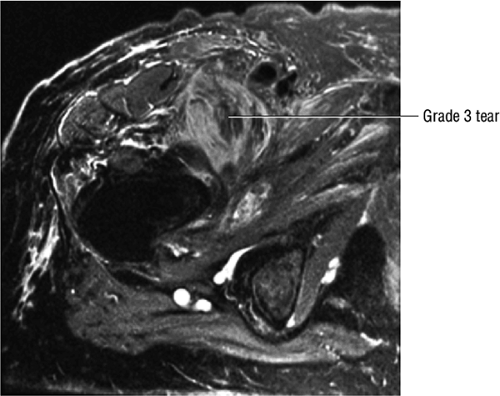 FIGURE 3.108 ● Grade 3 tear of the iliopsoas in its distal MTU. Axial FS PD FSE image. |
Differential Diagnosis
The most important differential diagnoses include infection and deep venous thrombosis. Infection is characterized by focal involvement with or without a superficial tract and extensive subcutaneous edema. On MR examination infection is visualized with hyperintense to intermediate fluid signal intensity on FS PD/T2 FSE or STIR images. Deep venous thrombosis is characterized by an enlarged, thrombosed popliteal vein and watershed hyperintensity in the gastrocnemius/soleus muscle complex on T2-weighted images.
MR Imaging
By providing objective morphologic data, MR imaging allows accurate assessment of the integrity of strained muscles, the MTU, the tendon, and the tendo-osseous unit. Edema within or around the muscles, depending on the stage of healing, is also identified on MR images.126,127 The MTU is frequently found to be the point of rupture, the extent of associated tendinous injury can be evaluated, and appropriate therapy needs can then be addressed. The use of MR imaging to distinguish focal hematomas from swollen, edematous muscles may also be useful in guiding clinical management. The former may be treated by drainage, whereas the
latter are often treated with wrapping procedures for compression and support of the injured area.128
latter are often treated with wrapping procedures for compression and support of the injured area.128
In general, muscle tears and avulsions demonstrate high signal intensity in areas of edema or hemorrhage on conventional T2, FS T2 FSE, and STIR sequences.129,130,131 Axial plane imaging is useful for the demonstration of associated muscle retraction and atrophy, which show high signal intensity on T1-weighted images. Coronal or sagittal images provide a longitudinal display of the entire muscle group on a single image. A comparison with the contralateral extremity is important in evaluating the relative symmetry of muscle groups.
Additional findings on T1- or PD-weighted images include:
Blurring of muscle fiber striations
Hypointense to hyperintense hemorrhagic fluid collections
Hypointense subcutaneous tissue edema
Expected findings on FS PD FSE images vary depending on the severity of the injury:
Grade 1: Hyperintense edema with or without hemorrhage and preservation of muscle morphology (Fig. 3.109). On FS PD, T2 FSE, and STIR images there is an edema pattern, displayed as interstitial hyperintensity with a feathery distribution (Fig. 3.110). Hyperintense subcutaneous tissue edema and intermuscular fluid can also be seen.
Grade 2: Hyperintense hemorrhage with tearing and disruption of up to 50% of the muscle fibers. Interstitial hyperintensity with focal hyperintensity represents hemorrhage in the muscle belly with or without intramuscular fluid (Figs. 3.111 and 3.112). A hyperintense focal defect and partial retraction of muscle fibers may also be visualized. Associated myotendinous and tendinous injuries as well as hyperintensity and interruption and widening of the MTU are also found.
Grade 3: Complete tearing with or without muscle retraction (Fig. 3.113). A fluid-filled gap can be seen, which is hyperintense on FS PD FSE and STIR images. Associated adjacent hyperintense interstitial muscle changes may also be depicted.
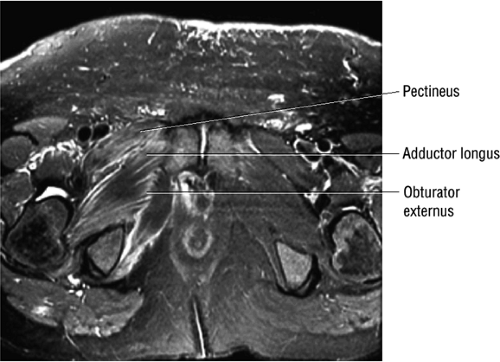 FIGURE 3.109 ● Grade 1 muscle strain of obturator externus, adductor brevis adductor longus, and pectineus muscles. Axial FS PD FSE image. |
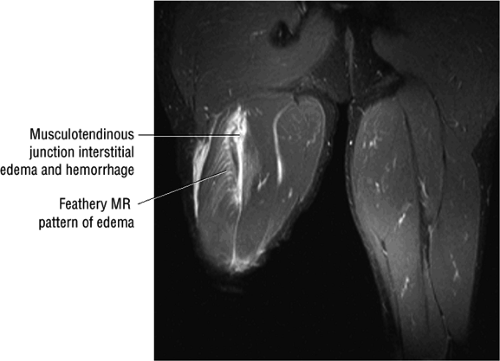 FIGURE 3.110 ● Feathery edema pattern and mild intramuscular fluid (a grade 2 characteristic) in a grade 1 to 2 biceps femoris muscle strain. Coronal FS PD FSE image. |
Although conventional radiography should remain the initial diagnostic examination for excluding posttraumatic myositis ossificans secondary to muscle trauma, MR scans have shown small areas of calcification or ossification as signal void or low signal intensity on T1- and T2-weighted images.
MR imaging pitfalls or “look-alikes” in exertional muscle injury span all categories of disease. For example, the MR signal changes seen with muscle damage may be very similar to changes caused by other forms of trauma or pathology, including neoplasm, radiation, denervation, bacterial infection, polymyositis, hemorrhage, and even acute exercise. Muscle and soft tissue inflammation may appear similar to a grade 1 muscle strain. Acute fasciitis is visualized as a diffuse increase in signal intensity conforming to the involved muscle group. Corresponding gallium scintigraphy and CT may be negative. Soft tissue edema in infection demonstrates low signal intensity on T1-weighted images and increased signal intensity on T2-weighted images. If soft tissue infection is suspected, MR evaluation may be the examination of choice.
Treatment
Both treatment choices and eventual outcome are dependent on the degree of muscle injury. With untreated or unsuccessfully treated strains there may be progression from incomplete to complete extension of injury, fibrous or fatty replacement, muscle ossification, or even compartment syndrome. Hamstring injuries recur in up to 25% of cases. Potential complications include fibrosis and muscle retraction, reinjury, myositis ossificans, and malunion or nonunion of osseous avulsions.
Therapy options include conservative and surgical treatment. Conservative treatment, which is appropriate for small


Related posts:

Stay updated, free articles. Join our Telegram channel
Full access? Get Clinical Tree
