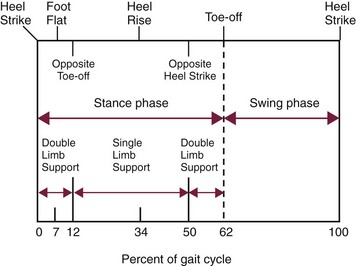
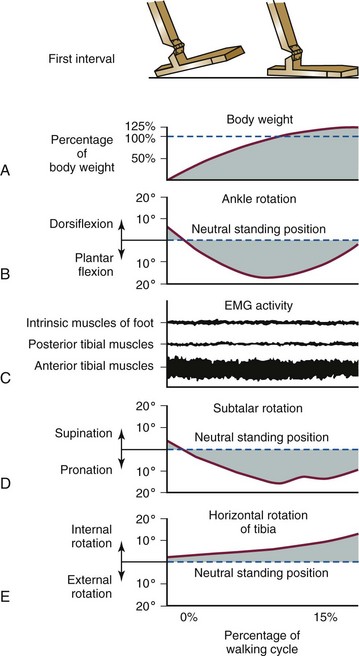
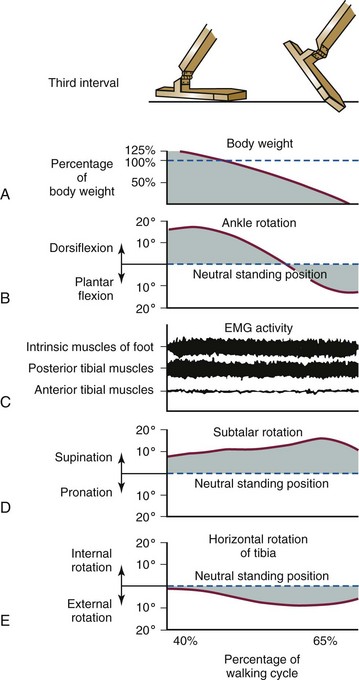
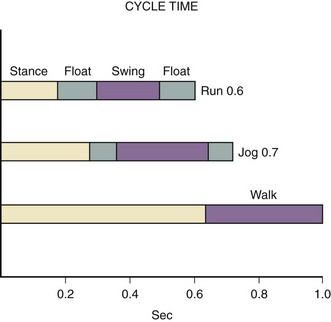
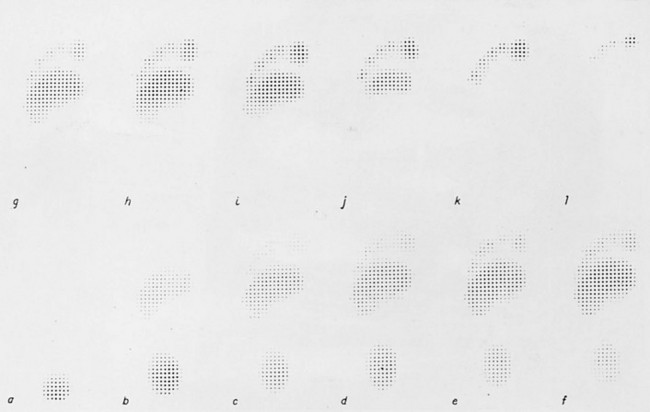
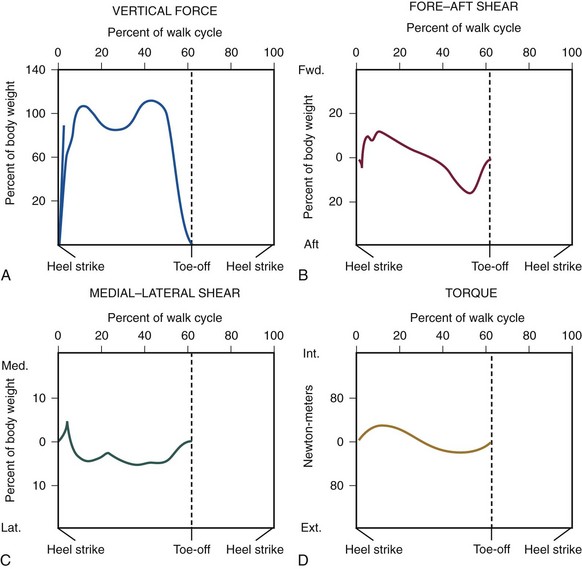
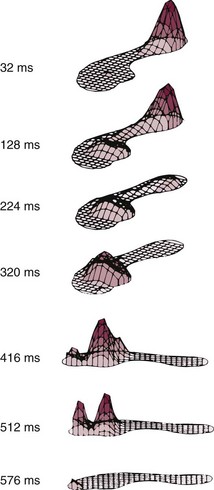
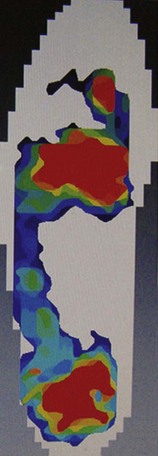
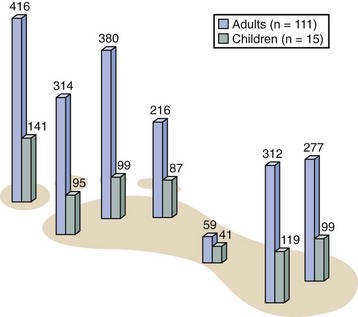
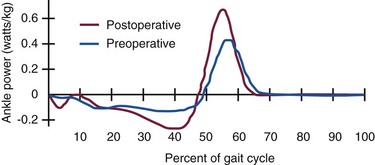
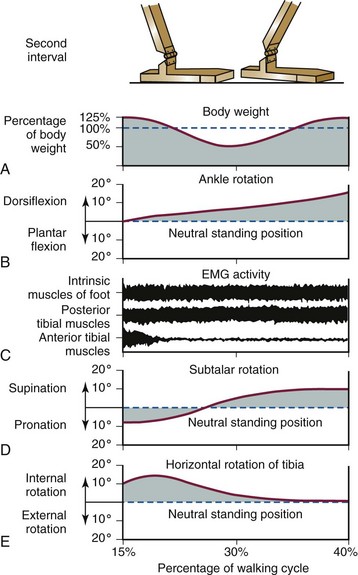
Chapter 1 KINEMATICS OF HUMAN LOCOMOTION BIOMECHANICS OF THE COMPONENT OF THE LOCOMOTOR SYSTEM Heel Strike to Foot Flat: Supple for Impact Absorption Foot Flat to Toe-Off: Progression to a Rigid Platform SURGICAL IMPLICATIONS OF BIOMECHANICS OF THE FOOT AND ANKLE Starting this textbook with a chapter focused on foot and ankle biomechanics is meant to provide a foundation for the reader upon which the remaining chapters are built. It has been assumed that the orthopaedic surgeon possesses an accurate knowledge of the anatomy of the foot and ankle. If this knowledge is lacking, textbooks of anatomy are available that depict in detail the precise anatomic structures constituting this part of the human body.46,49 In this chapter, the gait cycle is reviewed, kinematic and kinetic aspects of gait are explored, and specific anatomic interrelationships of the foot and ankle are emphasized. Throughout this discussion, mechanics that differentiate running from walking are described. Finally, clinical examples are explored, and methods for functional evaluation of the foot are presented as practical demonstrations of the concepts within. A single cycle can be divided further. The walking cycle for one limb is broken into a stance phase and a swing phase. The stance phase typically constitutes 62% of the cycle and the swing phase 38%. The stance phase is further divided into a period of double limb support (from 0% to 12%), in which both feet are on the ground, followed by a period of single limb support (from 12% to 50%) and a second period of double limb support (from 50% to 62%), after which the swing phase begins (Fig. 1-1). The ankle joint undergoes rapid plantar flexion from heel strike until foot flat is achieved. At approximately 7% of the walking cycle, dorsiflexion begins (Fig. 1-2B). As the foot is loaded with the weight of the body during the first interval, the calcaneus rapidly everts and the longitudinal arch flattens. This flattening of the arch originates in the subtalar joint and reaches a maximum during this interval (Fig. 1-2D). The hindfoot is often mildly supinated at initial ground contact associated with ankle dorsiflexion during swing-through. The hindfoot moving from supination to pronation during the first interval is a passive mechanism, and the amount of motion appears to depend entirely on the configuration of the articulating surfaces, their capsular attachments, and ligamentous support. No significant muscle function appears to play a role in restricting this motion at initial ground contact. The subtalar joint links rotation of the hindfoot to rotation of the leg. During the first interval, eversion of the calcaneus is translated by the subtalar joint into inward rotation that is transmitted proximally across the ankle joint into the lower extremity (Fig. 1-2E). Distally, this hindfoot eversion unlocks the transverse tarsal joint (Fig. 1-2D), allowing the midfoot joints to become supple. This allows the flattening of the longitudinal arch that contributes to energy dissipation during this phase. At heel strike, the center of gravity of the body is decelerated by ground contact, then immediately accelerated upward to carry it over the extending lower extremity. The heel’s impact and body’s center of gravity shift accounts for a vertical floor reaction that exceeds body weight by 15% to 25% (Fig. 1-2A). Eccentric contraction of the anterior compartment leg muscles slows the rapid ankle plantar flexion during this phase from heel strike until a foot-flat position is reached. The posterior calf muscles all are electrically quiet, as are the intrinsic muscles in the sole of the foot (Fig. 1-2C). There is no muscular response in those muscles usually considered important in supporting the longitudinal arch of the foot. Weakness of the anterior compartment muscles leads to a loss of this deceleration and a characteristic slap foot gait. The ankle joint undergoes progressive dorsiflexion during the second interval, reaching its peak at 40% of the walking cycle. This is when the force across the ankle joint has reached a maximum of 4.5 times body weight. Heel rise begins at 34% of the cycle as the contralateral leg passes by the stance foot and precedes the onset of plantar flexion, which begins at 40% (Fig. 1-3B). Figure 1-3 Composite of events of second interval of walking, or period of foot flat. EMG, electromyograph. During the second interval, the subtalar joint progressively inverts. This starts at about 30% of the cycle in a normal foot and at about 15% of the cycle in a flatfoot (Fig. 1-3D). Multiple factors contribute to this inversion, but precisely which plays the greatest role is unclear. Above the subtalar joint, the swinging contralateral limb externally rotates the stance limb. This external rotation torque is translated by the subtalar joint into hindfoot inversion. The oblique nature of the ankle joint axis, the oblique setting of the metatarsal break, and the function of the plantar aponeurosis also contribute to hindfoot inversion. Inversion of the subtalar joint is passed distally into the midfoot, increasing the stability of the transverse tarsal articulation and transforming the flexible midfoot into a rigid structure. During this interval, full body weight is not borne on the foot, smoothing the transition to single limb support. Force plate recordings show that the load on the foot may be as low as 70% to 80% of actual body weight (Fig. 1-3A). During the second interval, important functional changes occur in both the foot and leg, which are the result of muscular action. The posterior and lateral compartment leg muscles (triceps surae, peroneals, tibialis posterior, long toe flexors) and intrinsic muscles in the sole of the foot demonstrate electrical activity (Fig. 1-3C). Intrinsic muscle activity of the normal foot begins at 30% of the cycle, whereas in flatfoot, activity begins at 15% of the cycle. The posterior calf musculature slows the forward movement of the tibia over the fixed foot, which permits the contralateral limb to increase its step length. Weakness of the posterior compartment muscles may lead to premature contralateral heel strike and shortened stride length. The ankle joint demonstrates rapid plantar flexion during this interval as the foot essentially extends the stance, effective length. The subtalar joint continues to invert during this interval, reaching its maximum at toe-off (Fig. 1-4D). This completes the conversion of the forefoot from the flexible structure observed in the first interval at the time of weight acceptance to a rigid structure at the end of the third interval in preparation for toe-off. The inversion is a continuation of the processes that began in the second interval. These include external rotation of limb above the foot passing across the ankle and subtalar joints as well as mechanisms in the foot such as the obliquity of the ankle joint, the function of the plantar aponeurosis, and obliquity of the metatarsal break. Distally, the transverse tarsal joint is converted from a flexible structure into a rigid one by the progressive inversion of the calcaneus. The talonavicular joint also is stabilized during this period by the pressure placed across the joint by both body weight and the intrinsic force created by the plantar aponeurosis. At the beginning of the third interval, force plate recordings demonstrate an increase in the percentage of body weight borne by the foot resulting from the center of gravity falling. The load on the foot exceeds body weight by approximately 20%. Later in the interval, the vertical floor reaction force falls to zero as the body’s weight is transferred to the opposite foot (Fig. 1-4A). Ankle plantar flexion during the third interval is caused primarily by the concentric contraction of the posterior calf musculature, in particular the triceps surae (Fig. 1-4B). The plantar flexion leads to relative elongation of the extremity. Although full plantar flexion at the ankle joint occurs during this interval, electrical activity is observed only until 50% of the cycle, after which there is no longer electrical activity in the extrinsic muscles (Fig. 1-4C). The remainder of ankle joint plantar flexion occurs because of the transfer of weight from the stance leg to the contralateral limb. The intrinsic muscles of the foot are active until toe-off. Although the intrinsic muscles help to stabilize the longitudinal arch, the main stabilizer is the plantar aponeurosis, which is functioning maximally during this period as the toes are brought into dorsiflexion and the plantar aponeurosis is wrapped around the metatarsal heads, forcing them into plantar flexion and elevating the longitudinal arch. The anterior compartment muscles become active in the last 5% of this interval, probably to initiate dorsiflexion of the ankle joint immediately after toe-off. The changes that occur in the gait cycle during running relative to walking are illustrated in Figure 1-5. During walking, one foot is always in contact with the ground; as the speed of gait increases, a transition occurs wherein a float phase is incorporated, during which time both feet are off the ground. Rather than a period of double limb support as occurs during walking, there is a period of no limb support. As the speed of gait continues to increase, the time the foot spends on the ground, both in real time and in percentage of cycle, decreases considerably. The speed at which one transitions from walking to running is greater than the speed at which one transitions back from running to walking. Human locomotion is a learned process; it does not develop as the result of an inborn reflex.59 The first few steps of an infant holding onto his or her parent’s hand exemplify the learning process necessary to achieve orthograde progression. The result of this learning process is the integration of the neuromusculoskeletal mechanisms, with their gross similarities and individual variations, into an adequately functioning system of locomotion. Once a person has learned to walk, the mechanisms of ambulation are adaptable and work whether the person is an amputee learning to use a prosthesis, a long-distance runner, or a high-heeled shoe wearer. Smoothing and minimizing vertical oscillations of the body’s center of gravity minimizes energy expenditure. Physics principles tell us that much more energy is needed to lift the body against gravity and slow its descent (vertical displacement) than to move perpendicular to gravity’s pull (fore–aft or lateral displacement). Because the nature of bipedal locomotion demands such vertical oscillations of the body, they should occur in a smooth manner. The center of gravity of the body does displace in a smooth sinusoidal path; the amplitude of displacement is approximately 4 to 5 cm (Fig. 1-6).65,66 The body’s center of gravity reaches its maximum elevation immediately after passage over the weight-bearing leg and then begins to fall. This fall is stopped at the termination of the swing phase of the opposite leg as the heel strikes the ground. Much of the coordination of motion between the different segments of the lower limbs results in minimizing the vertical displacement of the body’s center of gravity. Although movements of the pelvis and hip modify the amplitude of the sinusoidal pathway, the knee, ankle, and foot are particularly involved in converting what would be a series of intersecting arcs into a smooth, sinusoidal curve.66 This conversion requires both simultaneous and precise sequential motions in the knee, ankle, and foot. The body is shifted slightly over the weight-bearing leg, with each step creating a sinusoidal lateral displacement of the center of gravity of approximately 4 to 5 cm with each complete stride. This lateral displacement can be increased by walking with the feet more widely separated and decreased by keeping the feet close to the plan of progression (Fig. 1-7). Normally, the slight valgus of the tibiofemoral angle (physiologic genu valgum) permits the tibia to remain essentially vertical and the feet close together while the femurs diverge to articulate with the pelvis, minimizing the lateral displacement. In addition to vertical and lateral displacements of the body, a series of axial rotatory movements occur that can be measured in the horizontal (transverse) plane. Rotations of the pelvis and the shoulder girdle are easy to see when watching someone walk. Similar horizontal rotations occur in the femoral and tibial segments of the extremities. The tibias rotate about their long axes, internally during swing phase and into the first interval of stance phase and externally during the latter phases of stance. The degree of these rotations is subject to marked individual variations. In a series of 12 male subjects, the recorded average horizontal rotation of the tibia was 19 degrees during a gait cycle but varied between 13 and 25 degrees.48 At heel strike, progressive inward rotation occurs in the lower extremity, which consists of the pelvis, femur, and tibia, and this inward rotation reaches a maximum at the time of foot flat. The internal rotation at heel strike is initiated by the collapse of the subtalar joint into valgus, and its magnitude is determined by the flexibility of the foot and its ligamentous support. After contralateral toe-off, at about 12% of the cycle, progressive outward rotation occurs, which reaches a maximum at the time of toe-off, when inward rotation resumes (Fig. 1-8). Once the foot is on the ground, progressive external rotation is probably initiated by the contralateral swinging limb, which rotates the pelvis forward, imparting a certain degree of external rotation to the stance limb. This external rotation subsequently is passed from the pelvis distally to the femur and tibia, across the ankle joint, and is translated by the subtalar joint into inversion, which reaches its maximum at toe-off. The external rotation is enhanced by the external rotation of the ankle joint axis, the oblique metatarsal break, and the plantar aponeurosis after heel rise begins. To begin a review of gait kinetics, one must recognize that the ambulating human is both a physical machine and a biologic organism subject to physical laws and beholden to muscular action. Gait kinematics and lower-extremity anatomic interrelationships strive to achieve a system that takes us from one spot to another with the least expenditure of energy.60 Said another way, human locomotion is a blending of physical and biologic forces that combine to achieve maximum efficiency at minimum cost. Kinetics is the study of these energy expenditures. All characteristics of muscular behavior are exploited in locomotion. Muscle groups may accelerate or decelerate body segments at different points in the gait cycle. They may contract concentrically (as they shorten) or eccentrically (as they lengthen). Part of energy conservation during the gait cycle involves having muscles work near their peak efficiency, which tends to be at or longer than their resting length.14,17,65 When motion in the skeletal segments is decelerated or when external forces work on the body, activated muscles become efficient. Activated muscles, in fact, are approximately six times as efficient when resisting elongation (eccentric contraction) as when shortening to perform external work.1,5,6 In addition, noncontractile elements in muscles and specific connective tissue structures assist muscular action by providing an elastic component that stores and later releases kinetic energy. A variety of measurement techniques have been used to study the interaction of the foot with the ground. Indirect techniques rely on correlating other measurable gait parameters to plantar characteristics and offer the advantage of not relying on expensive and often bulky equipment. For example, an estimation of ground reaction force can be made based on a simple-to-measure temporal variable, foot–ground contact time.13 Direct measurement techniques rely on physical properties or electronic transducers to translate the interaction between the foot and the ground into a measurable quantity. Multiple direct measurement systems are available that use a variety of strategies to record plantar pressure or ground reaction force. Unfortunately, results obtained with different systems under similar conditions are not always similar, and even qualitative comparisons may not be appropriate.38 Spatial resolution and sample rate affect the ability of a system to record true peak plantar pressures and to isolate particular areas under the foot. The earliest direct measurement methods relied on physical properties of a material to capture the interaction of the foot with the ground. Casts of the foot in clay, plaster, or soil were used with the assumption that areas of deeper penetration represented areas of highest pressure.10,21 Rubber mats incorporating longitudinal ridges,54 pyramidal projections,21 or a multilevel grid (such as the Harris-Beath mat),67,78 use the elastic property of rubber which, when stood or walked on, distorts in proportion to the pressure applied (Fig. 1-9). Although fast, inexpensive, and portable, these methods have low measurement resolution and lack temporal discrimination.67 Optically based systems rely on visualizing the plantar aspect of the foot during stance or gait. The simplest allows observation or photographic recording of the plantar foot through a clear platform (Fig. 1-10). This provides an accurate, dynamic, qualitative representation of foot morphology. Addition of a physical transduction device between the foot and glass plate allows quantification of regionalized plantar pressures and adds the temporal component missed using a physical transduction system alone.21 The pedobarograph places a thin plastic sheet over the clear plate.4 The sheet is illuminated at the edges, and pressure on the plastic distorts the light in proportion to the pressure applied. The images can be recorded and calibrated to provide a spatial resolution and temporal responsiveness not found with the Harris-Beath mat. However, slow responsiveness at high forces may bias results.36 Figure 1-10 Feet and legs of person standing on barograph. A, Weight bearing with muscles relaxed. B, Rising on toes. A force plate measures the ground reaction force, that is, the force exerted by the ground on the foot, in three degrees of freedom (vertical force, forward shear, side shear), and allows calculation of the torques around the foot and ankle (axial torque, sagittal torque, coronal torque). Force transducers are configured in orthogonal planes at the corners of a section of floor. The resulting data provide a representation of the average forces experienced by the foot over the gait cycle (Fig. 1-11). One advantage of this type of system is that shear forces and torques can be measured in addition to vertical force. The limitations include the lack of ability to map specific regions of plantar pressure. This limitation can be circumvented with the addition of an optical diffraction system, as described above, or with a series of smaller force plates placed in tandem.71 The ability to place pressure transducers on discrete parts of the foot has become possible, as their size has shrunk. They can be placed on strategic points of the foot, or an array can be created to map the pressures exerted by the foot during stance or gait. These data provide a spatial and temporal map of plantar pressure over the gait cycle54,62 (Fig. 1-12). Many of these systems use a floor mat or platform built into the floor with a grid of pressure-sensitive transducers. An alternative is to place a thin film containing a pressure transduction array into a shoe (Fig. 1-13). In this way, the plantar pressures experienced by the foot can be measured in a wider variety of settings and under multiple impacts as well as account for the effect of shoe wear.42,77 For example, feet experience 10% to 50% higher plantar pressures in a flat, flexible shoe compared with a soft shoe with a firm rubber sole.63 The floor mat and in-shoe methods correlate well when the shoe used has a firm sole or when barefoot.7 The ground reaction force is a vector quantity varying temporally and spatially over the gait cycle that represents the average reciprocal force exerted by the floor in response to the foot. It has a magnitude and direction, and the starting point may be projected onto a representation of the plantar foot at the point of average maximum vertical force (Fig. 1-14). The ground reaction force can be deconstructed into vertical force, anterior–posterior shear, and medial–lateral shear. The vertical ground reaction force represents the force of the ground pushing upward on the foot, and can be calculated from systems that measure plantar pressure for the whole foot or for defined regions of the foot.76 Typically, it has two peaks; the first peak occurs as the body weight is transferred from dual- to single-leg stance and the second as the body weight moves forward over the metatarsal heads. Studies of ground reaction forces may focus on the magnitude of one or the other vertical peak or the timing of the peaks and valleys. Torque (moment) and power around a joint also can be calculated from the ground reaction force, joint geometry, timing parameters, and kinematics. Another frequently reported measurement is the maximum pressure recorded, or peak pressure. It is usually reported over a spatially subdivided map of the plantar foot. Peak pressure for areas such as the heel, individual or grouped metatarsal heads, and toes are common. Alternatively, peak pressure can be reported as a temporally varying measure by displaying its location and magnitude on a diagram of the foot. Peak force can be calculated from peak pressure because the size of the pressure transducers is known. Calculated joint moments represent the torque applied by muscles to counteract the measured ground reaction force, and joint power is calculated from the joint moment and angular velocity (Fig. 1-15). Finally, the pattern of plantar loading can be categorized based on the pressure measurements. Patients may tend to load the medial ray, the medial and central rays, the central rays, or the central and lateral rays.35 Put another way, there is an inverse relationship between peak pressure under the first metatarsal head and toe relative to the lesser metatarsal heads.25 As walking speed increases, a medialization of forefoot pressure occurs such that peak pressure under the first metatarsal head increases and that under the lesser metatarsal heads decreases.64 Walking speed affects the magnitude of plantar pressures during gait. Velocity is linearly related to peak vertical and fore–aft ground reaction forces,3,57 and inversely related to the pressure·time integral.81 As velocity increases, peak pressures on the heel, medial metatarsal heads, and the first toe increase while peak pressure in the fifth metatarsal head decreases.35,64 This medialization may be related to increased magnitude and velocity of hindfoot eversion and medial shear force at heel strike. Timing measurements also change with increasing speed. The normalized time to peak pressure is decreased on the heel but unchanged in the midfoot and forefoot, suggesting the rollover process is mainly accelerated by reducing the time from heel strike to foot flat.64 To minimize variability introduced because of walking speed, subjects may walk at a fixed rate or at their natural pace.81 Deviations from a normal gait pattern can occur if the subject has to take a long or short stride in an effort to place the foot on the appropriate measurement area of floor-based systems. To minimize this effect, the measurement platform is placed flush with the floor and hidden from the subject with a thin, uniform floor covering. The traditional midgait method uses a short lead-up walk before the foot strikes the measurement platform. A three-step or two-step lead-up is as reproducible, but a one-step lead-up is not adequate.15,56 Variability of the measurements is also dependent on the type of gait. For example, plantar pressures measured when standing differ from pressures measured during gait.10 Variations in walking patterns, such as a shuffling-type gait, alter the peak forces on the foot.82 Gait pattern alteration can be seen in certain conditions, such as after ankle fracture fixation or with concurrent knee pathology.3,8 Drift and calibration of the measurement systems affect the variability of measurements. Plantar pressure measurement systems need to be calibrated to allow comparisons between systems. Transducer output varies between different transducers, with temperature, when an in-shoe system is removed and reinserted, and with the number of trials performed. Pressure can vary by as much as 20% with repeated measurements on the same insert.63 There may be an offset that drifts with time.56 The measurements may be adequate for relative ranking purposes but need repeated calibration with a fixed system if accurate values are needed. Variability is also introduced in the methods by which the acquired data are analyzed. For example, peak pressure can be reported for the whole surface of the foot during a gait cycle, but the clinical utility of this is limited because different regions of the foot experience different plantar pressures during the gait cycle. Subdividing the regions of the plantar foot and recording peak pressures in each of these areas over the gait cycle provides more meaningful data. The heel is often represented as a single region but may be subdivided into medial, central, and lateral.64 Midfoot peak pressures may be useful in pathologic conditions, such as rocker-bottom deformity, and can classify foot morphology into planus, normal, and cavus categories.64 The base of the fifth metatarsal can be included as part of the midfoot or can be identified as a separate pressure zone. Improvements in sensor technology have allowed measurement of individual metatarsal heads and toe forefoot pressures.25,37 Definition of these regions (masks) is still a manual process and is repeated for each trial. Having a single person define the regions may decrease variability.37 Subject-specific characteristics also introduce variability. Children’s feet have a dramatically different loading pattern and lower peak pressure because of high relative foot area27 (see Fig. 1-14). Differences in joint mobility and forefoot pressure based on a subject’s ethnicity have been shown in neuropathic diabetics.73 The patient’s dominant side may experience greater static and dynamic vertical force,42 although others have found no side dominance.29 Foot morphology also affects plantar pressure; cavus feet have different midfoot loading characteristics and rate and degree of hindfoot eversion than flatfeet.64 During running, fatigued subjects tend to have decreased step time, decreased peak and integral force and pressure under heel, and medialization of forces.77 After a hindfoot fusion, greater contact force at heel strike has been observed.45,69 This could be due to the inability of the calcaneus to move into a valgus position after heel strike.2 The effect of body weight on plantar pressure is less direct than might be expected. Although some have correlated maximum vertical force during gait and body weight,42 many other studies found little correlation.26,27,39 In children, the correlation of body weight to peak plantar pressures is clear and plays a greater role in determining peak pressure than in adults.27,35 The area of peak pressure most highly correlated with body weight in children is the fourth metatarsal head,35 and in adults may be the fourth metatarsal head or the midfoot.27,35 Individuals load the foot with different spatial patterns as well. After heel strike, the forefoot may be loaded more medially or laterally across the metatarsal heads and may load the metatarsals and toes simultaneously or in turn. A variety of classification systems have been proposed to group these types of loading, and biomechanical theories have been proposed to explain the different loading patterns.35,37,76 Finally, there is an inherent variability in an individual’s gait from step to step that ranges from less than 1% for vertical ground reaction force to much higher for timing-dependent variables and values calculated as a product of measures.29 Measured values may vary by more than 10% under identical testing conditions. Averaging data from as few as three trials improves the reliability of the measurement.39
Biomechanics of the Foot and Ankle
Gait Cycle
Walking Cycle
First Interval
Second Interval
Third Interval
Running Cycle
Kinematics of Human Locomotion
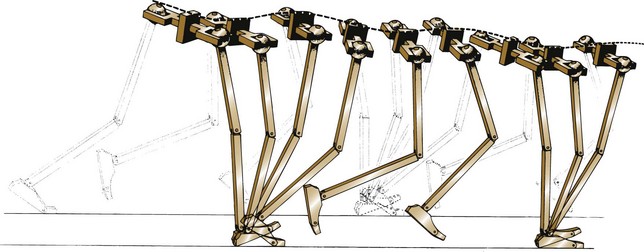
Vertical Body Displacements
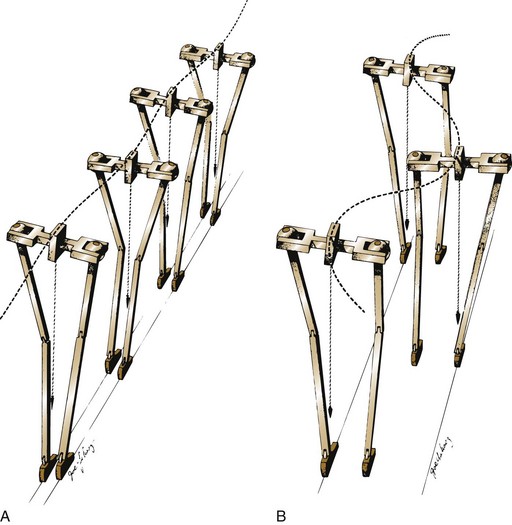
Lateral Body Displacements
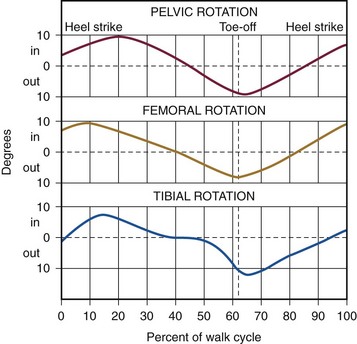
Horizontal Limb Rotation
Kinetics of Human Locomotion
Measuring Whole Body Kinetics and Plantar Pressure
Types of Studies
Data Representations
Measurement Variability
![]()
Stay updated, free articles. Join our Telegram channel

Full access? Get Clinical Tree


Biomechanics of the Foot and Ankle