(Squat jump)
Jump mat: r = 0.97
Jump and reach: r = 0.906
Force Plate: r = 0.75–0.99a
Markovic et al. (2004)
Leard et al. (2007)
Moir et al. (2005)
≥0.86
Kinzey and Armstrong (1998)
Single hop for distance
Triple hop for distance
Cross-over hop for distance
6m hop for time
0.96 (SEM = 4.56cm)
0.97 (SEM = 11.17cm)
0.95 (SEM = 15.44cm)
0.93 (SEM = 17.74cm)
0.96 (SEM = 15.95cm)
0.92 (SEM = 0.06s)
0.66 (SEM = 0.13s)
Bolgla and Keskula (1997)
Ross et al. (2002)
Bolgla and Keskula (1997)
Ross et al. (2002)
Bolgla and Keskula (1997)
Ross et al. (2002)
Bolgla and Keskula (1997)
>0.97 at 60°/s
>0.98 at 120°/s and 180°/s
0.82 at 60°/s
0.83 at 120°/s
0.80 at 60°/s
0.89 at 60°/s
Maffiuletti et al., (2007)
Li et al. (1996)
Impellizzeri et al. (2008)
Lund et al. (2005)
Related to peak treadmill speed at VO2 max (r = 0.71, p = 0.0001) in adult male basketball players
Castagna, Imperellizzeri,Rampinini, et al (2007)
Objectivity refers to any bias that originates with either the tester or the athlete. Tester bias may include subtle differences in testing protocols (such as the positioning and timing of skin-fold measurements), or interpretation of test performance (stopping the clock when the tester perceives that the athlete crossed the line).
Subject bias may include situations where the athlete being tested aims to manipulate the results. For example, many teams expect an athlete’s fitness to improve throughout the course of pre-season training and sometimes impose fines on those athletes that do not improve. There is therefore a temptation for some athletes to intentionally under-perform in the first battery of tests so that they are more likely to record an improvement as pre-season training progresses, thereby avoiding a fine.
Laboratory versus field testing
Despite the lack of direct transfer to competition, laboratory tests do have several advantages. A laboratory allows the same test to be reproduced under similar conditions on separate occasions. This increases the sensitivity of the test and allows subtle changes in fitness to be monitored over time without interference from varying environmental conditions (Table 3.2).
Table 3.2 Advantages/disadvantages of field and lab based tests?
Field-testing, in contrast, has a number of advantages over laboratory-based tests. Tests can be devised that more closely mimic the requirements of the particular sports. For example, the changes of direction that occur in the Multi Stage Fitness Test (Bleep Test), and particularly the yo-yo test, closely resemble some of the movement characteristics and work–rest ratios of team sports. It could be argued that performance in the yo-yo test gives a better indication of a soccer player’s ability to perform in an intermittent multi-directional activity like soccer, than their performance in a laboratory-based treadmill test. Castagna et al. (2006) found that VO2 max data collected via the yo-yo test was strongly and significantly related to VO2 max (r = 0.75, p<0.001) via treadmill direct gas analysis in adult male soccer players. Metaxas et al. (2005) found a 10.5–13.3% variation, in VO2 max measurements, assessed via the yo-yo endurance test, the yo-yo intermittent test and continuous and intermittent treadmill tests. However, the authors concluded that yo-yo field tests should be used to monitor aerobic fitness in team sports, as they are easy to administer and incorporate into training sessions during the competitive season. In a review of literature, Bangsbo et al., (2008) concluded that the yo-yo intermittent recovery test is a simple and valid method of assessing an individual’s capacity to perform repeated intense exercise bouts, and monitoring changes in performance capacity.
Additional considerations, when selecting testing methods, are time and reproducibility. In terms of the use of the yo-yo test for team sports, it is far more time efficient than individually assessing the whole team, and it is also highly reproducible if the testing conditions (clothing, equipment, time of day, warm-up) remain constant. If working with a marathon runner, however, the most valid and reliable method of assessing aerobic capacity would be via direct gas analysis.
Field tests also have the advantage that they are simpler, easier to set up and administer, and can often be applied to several athletes at once. As each athlete has minimal disruption to their routine, field tests may therefore be the most practical choice for regular monitoring of training gains.
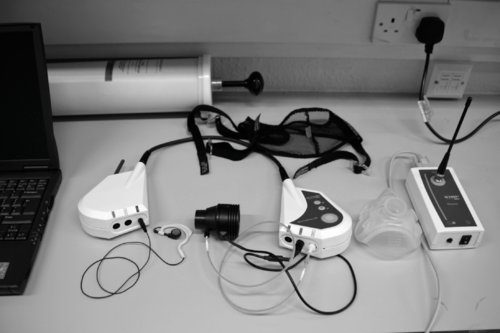
Where available, it is sometimes possible to take traditional laboratory equipment into the field. Mobile gas analysis devices, such as the MetamaxTM (Fig 3.1) allow sophisticated tests to be conducted in an ecologically valid setting.
Test order
When conducting several tests, the order in which the individual tests are performed is vital. The performance of a previous test can impact the performance of a subsequent one. For example, a test to assess anaerobic endurance requires a high intensity of effort for an extended duration, causing considerable fatigue and leaving the athlete below normal capacity for some time. Any subsequent tests, performed whilst the athlete is still fatigued, will be severely impaired. If that test is agility, and on a re-test the athlete scores higher than before, then athletes and coaches cannot conclude that agility has actually improved. Several factors could have contributed to a better agility result. These include: an improved anaerobic endurance, leading to less induced fatigue; improved cardiovascular fitness, leading to quicker recovery; and lower motivation levels during the anaerobic test, leading to less fatigue. All of these may allow the athlete to start the agility test in a better state of readiness and therefore record improvements that are not necessarily down to improvements in agility.
To ensure that any changes recorded actually reflect genuine improvements, the impact of previous tests must be minimised. The National Strength and Conditioning Association (NSCA) (Baechle & Earle, 2008) suggest the following test order (Table 3.3).
Table 3.3 Test order
| 1 | Agility |
| 2 | Speed |
| 3 | Muscular strength |
| 4 | Muscular endurance |
| 5 | Aerobic capacity (ideally on a separate day) |
Agility and speed are tested first as they are short, relatively non-fatiguing activities that require only a few minutes for full recovery. Testing these early will not impact later results. Strength should be tested next, again because the actual tests require little recovery (5 minutes) and have little impact on subsequent muscular or cardiovascular endurance. Muscular/Anaerobic endurance should be tested after strength as these tests can induce fatigue in the muscles and has a major impact on subsequent strength, skill and speed performance. Depending on the requirements of the sport, cardiovascular fitness (usually assessed via a maximal test that also stresses the anaerobic energy systems) may also need to be addressed. In this case it should either replace the anaerobic endurance test, or be tested on a separate occasion.
The tests
When designing a battery of fitness tests, several factors must be considered. These include: selection of tests (which ones and how many), order of tests, recovery period between tests, what equipment and any changes to account for different playing positions (Table 3.4).
Table 3.4 Factors to consider when designing a battery of tests
| How many tests? | Maximum of seven |
| What tests? | Decision based on functional characteristics of the sport. Will an improvement in the test result in an improved performance in the sport? |
| What order? | Agility, speed, strength/muscular endurance, anaerobic/aerobic endurance |
| How long in between? | Enough for full recovery from previous test |
| What equipment? | Timing gates; tape measure; cones; sports hall, etc. |
| Changes to account for different positions | Different tests required to gain useful information about different positions. For example: goal keeper versus midfield player |
The choice of tests should reflect the characteristics of both the sport and individual player position. For example, a cycle based test will have almost no transfer to sports that require athletes to run; a strength assessment using a bench press will not necessarily transfer to throwing or punching activities; a constant-pace running-based endurance test for a goalkeeper will be less functional than a test of repetitive explosiveness or agility.
The order of tests should be chosen to minimise interference between tests (Baechle and Earle 2008). The length of rest between tests should be long enough to allow complete recovery so that interference is minimised. The equipment should allow tests to be accurately reproduced and limit tester objectivity (timing gates versus hand timing).
Depending on where tests originated, distances may be expressed in metres or yards. In reality, a 40m test is no better or worse than a 40 yard test. The important issues to consider are consistency across time (when repeating tests) and an awareness of any differences when comparing test results to normative data.
Assessing agility
Shuttle runs are widely used as a test of agility, providing information on explosiveness, acceleration, deceleration, turning ability, functional lower body strength and body control. No agility test should last longer than about 10 seconds. Beyond this, performance is determined far more by an athlete’s speed-endurance capabilities than agility.
With all agility runs, careful placing of extra timing gates (before and after the turn) can help establish whether improvements in overall performance are the result of improved speed or improved turning ability.
T-test
The T-test is a 40m (or 40 yard) agility test (Figure 3.2) that incorporates forward sprinting, side-to-side shuffling and backwards running. It is particularly suited to both team and racquet sports.
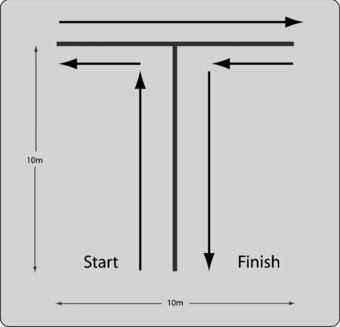
Intraclass reliability for the T-test has also been shown to be as high as 0.98 (Pauole et al. 2000), therefore small changes in performance should be a direct result of adaptations to training. As with assessing sprint ability, it is essential that timing gates are used to assess performance in this test.
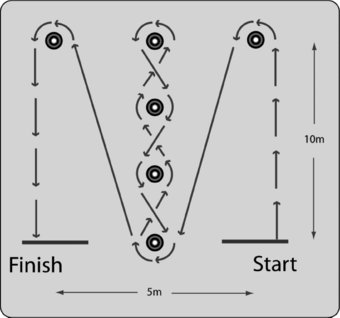
Illinois agility test
The Illinois agility test (Figure 3.3) is designed to test acceleration, deceleration, cutting and turning ability. Performance is determined by the time that is taken to complete the course. The use of timing gates is essential.
Speed
The best way to test an athlete’s speed is to assess their performance over sport specific distances. For example, short sprints, lasting 10–40 m, are used to mimic the sprint distances typically observed during team sports; 6s or 10s sprints on a cycle ergometer are used to test speed in track cyclists; 10, 20, 30 or 40 m sprints in multiple sprint sports; and 100m sprints on a rowing ergometer are used to test speed in rowers.
These short sprints are the best way of assessing functional speed as they actually do measure short sprint ability. Because they all start from standing, they also give an indication of explosiveness and acceleration ability. As with all such tests (including agility tests) timing must be performed with timing gates or similar electronic method. (Hand timing is not an acceptable method of timing, due to the level of accuracy/reliability.)
Sprint tests
Tests consist of three sprints from a standing start, with full recovery between runs. The best time is always taken. Some researchers take the average of three; however it is usually not appropriate to use this method as a single poor result can skew the recorded figure.
Starting position and height of the timing gates also needs to be standardised. Small differences in times as a result of starting position are not interchangeable (Duthie et al. 2006), with starting positions with feet parallel resulting in slower times than those where the dominant foot is placed forwards (Cronin et al. 2007). Cronin and Templeton (2008) also observed an error of ≤1.3% (equal to 0.7s) between the times achieved with the gates positioned at hip and shoulder height. This was attributed to the legs breaking the beam earlier with the gates positioned at hip height.
A 40m-sprint test, with an additional timing gate placed at the 20m- ine, gives useful extra information on an athlete’s initial acceleration. The distances can be altered for different sports to make the test sport specific.
Vertical jump tests
Vertical jump tests are widely used to assess single- and double-legged vertical jumping ability. They focus on a particular performance parameter (height jumped) and in this respect are highly functional to those sports requiring vertical jumping ability, such as basketball and volleyball. Variations of the test can include, a two-legged take off, a one-legged take off, a step and one-legged take off (tennis, soccer), or measuring the height jumped after a drop off of a small platform.
Two common methods are employed to determine height jumped. The first uses contact mats to determine flight time. The second is a simple jump and reach method. Both methods appear to be valid and reliable tests (r = 0.967 and 0.906 respectively) when compared to a three-camera motion analysis system (Leard et al. 2007). Another method is to attach a linear position transducer to a belt/harness that the athlete wears. On jumping, the device records the linear displacement during each jump, and can provide reliable data regarding jump height, peak force (intraclass correlation coefficient (ICC) = 0.977–0.982), mean force (ICC = 0.924–0.975), and time to peak force (0.721–0.964) (Cronin et al. 2004).
Although vertical jump tests do not measure power (they measure height jumped, unless performed on a force plate), the ability to jump high is closely correlated with this parameter. This relationship has permitted the development of prediction equations for peak power output during the vertical jump, which removes the need for force plates to monitor athletes’ peak power during the vertical jump. Keir et al.(2003) found that peak power (W) can be predicted (within 2%) via height jumped (cm) and body mass (kg), with a very high level of reliability (r>0.9999, CV <0.2%) (see Table 3.1, and refer to Keir et al. (2003) Journal of Strength and Conditioning Research for the Nomogram).
Vertical jump assessments can also be performed with additional load (also referred to as squat jumps), depending on the requirements of the sport, however these do require the use of a force plate to determine peak power output, peak force and rate of force development. In trained individuals, high test–retest correlations (ICC range: 0.75–0.99) are observed during unloaded and loaded jump squats (30 and 60% 1RM) with familiarisation not necessary due to low individual variation (CV range: 1–2–7.6%) between tests (Moir et al. 2005).
Maulder and Cronin (2005) adapted the vertical jump from a bilateral to a unilateral test and found that test–retest reliability remained high (ICC = 0.86 dominant leg, 0.82 non-dominant leg). Performance of unilateral assessments can highlight limb asymmetries and therefore act as a potential marker of injury risk.
Horizontal jump tests
Horizontal jump tests are useful to assess power in a horizontal direction. Tests, such as the standing long jump and the standing triple jump, where the athlete attempts to jump for distance from a standing start, give useful information, not only about an athlete’s horizontal hopping ability but also about an athlete’s ability to control their landing. Both of these tests are highly reliable with ICC of 0.95 and 0.93 and co-efficient of variation of 2.4% and 2.9% respectively (Markovic et al., 2004).
Maulder and Cronin (2005) adapted the standing long jump from a bilateral to a unilateral test and found that test–retest reliability remained high (ICC = 0.90 dominant leg, 0.89 non-dominant leg). The study also found that the performance in the horizontal jumps was a better predictor of 20m sprint ability than vertical jumps (r = 0.73 and 0.66 respectively).
Hop tests
There are a number of hop tests available (hop for distance, triple hop for distance, cross-over hop for distance, and 6m hop for time, see Figure 3.4), which were primarily developed to assess power based performances during horizontal movements, but which are now commonly used in clinical environments to assess/monitor rehabilitation from lower limb injury. Along with the performance measures obtained during these tests, kinematic evaluation of the performances of these tasks may also highlight additional risk factors for knee injury if poor lower limb control and landing mechanisms are identified (Fitzgerald et al. 2001). Additional benefits of the hop tests are the ability to determine bilateral asymmetry, and monitor progress in performance and neuromuscular control post injury (Reid et al., 2007).
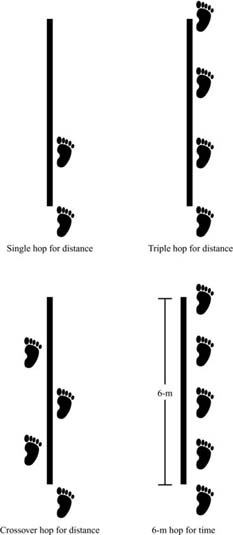
Single hop for distance
The athlete starts with their toe on a start line, hands on hips and their non-involved leg held in front at 90° of hip flexion to prevent any countermovement. The subject then hops as far as possible with the tester measuring from the initial toe position (start line) to the heel strike. Participants must be stable on landing. Research has demonstrated a high level of reliability (ICC r = 0.92–0.96) with a standard error of measurement of 4.61–4.56cm (Bolgla and Keskula 1997; Ross et al. 2002).
Triple hop for distance
Performed in the same way as the single hop for distance, only three consecutive hops are performed with the total distance measured from the start line to the final heel strike. Again participants must be stable on landing. Research has demonstrated a high level of reliability (ICC r = 0.95–0.97) with a standard error of measurement of 11.17–15.55cm (Bolgla and Keskula 1997; Ross et al. 2002).
Cross-over hop for distance
The athlete starts in the same position as for the other hops, only this time it is essential that a tape (≥ 8 m) measure is stuck to the ground leading away from start line. If the athlete begins on their right leg, they need to start to the right of the tape. Each hop is performed as in the triple hop for distance, with the only difference being that the athlete must cross the measuring tape during each hop. Research has demonstrated a high level of reliability (ICC r = 0.93–0.96) with a standard error of measurement of 15.95–17.74cm (Bolgla and Keskula 1997; Ross et al. 2002).
Six-meter hop for time
The athlete begins on the start line and hops as quickly as possible on the appropriate leg to the finish line (6m away). This has been conducted using a stop-watch, but due to the range of human error (as discussed elsewhere in this chapter) it would be much more accurate and reliable if timing gates are positioned at 6m intervals. Research has demonstrated a varying level of reliability (ICC r = 0.66–0.92) and a standard error of measurement of 0.06–0.13s (Bolgla and Keskula 1997; Ross et al. 2002). The more varied range of reliability and standard error of measurement may be due to the fact that stopwatches were used for timing.
Star excursion balance test
The star excursion balance test (SEBT) is commonly performed to assess dynamic balance and stability across multiple planes of movement. Poor performance in one limb compared to the other is a good indicator of bilateral instability and possible imbalance. Especially when combined with the results of assessments such as the hop tests.
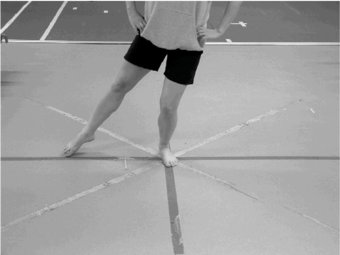
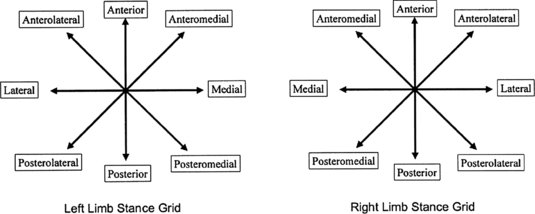
The SEBT is performed with the athlete standing on the middle of the grid (see Figure 3.5) on the leg to be tested. The grid consists of lines extending out from the centre at 45 degrees (see Figure 3.6). Foot position should be standardised with the heel in the centre of the grid and the big toe on the anteriorly projected line. With the other leg, the individual reaches as far as possible along each line, in turn, returning the leg to the start position between each attempt (the reaching leg must not be used for support) (Figure 3.5). The distance reached in each direction is recorded. To standardise the test, and provide familiarisation the participants should be provided 4–6 practice attempts followed by a 5-minute rest prior to the actual testing to eliminate any fatigue. Kinzey and Armstrong (1998) demonstrated that practice attempts raised the reliability of testing from r = 0.67–0.87, depending on the direction, to r>0.86.
This test has been shown to be a good indicator of progress of dynamic postural and lower limb control during rehabilitation from knee (Herrington et al. 2009) and ankle injury and chronic ankle instability (Gribble et al. 2004; Munn et al. 2009) via comparison of the performances of the injured to the non-injured leg. Plisky et al. (2006) also found the SEBT to be a good predictor of lower extremity injury and recommended its inclusion into pre-participation screening.
It is essential that the SEBT and similar dynamic balance/stability tests are performed prior to any possible fatiguing activity as Gribble et al. (2004) found that fatigue resulted in a noticeable decrease in performance in the SEBT.
Wingate Anaerobic Test
The Wingate anaerobic test (WAnT) is a 30-second cycle test providing information on peak power, mean power, muscle endurance and muscle fatigability. It is a relatively simple and inexpensive test that is reliable and repeatable (especially in motivated subjects), is sensitive to change over time, and truly reflects a person’s anaerobic performance capacity. Although the test is well established and widely used in an educational setting, its application to most sports is limited. Highly specific for sprint cyclists, but not functional for other sports; however a number of studies, summarised by Inbar et al. (1996) have found strong associations with some field tests for assessing power, including 40m sprint speed (r = 0.84) and vertical jump (r = 0.70), but weak associations with others (Sargeant anaerobic skating test, r = 0.32).
There are also a number of modified versions of the WAnT, with varying loads and varying durations. When monitoring peak power output, these are all highly reliable, but it is essential to use the same loads if comparisons of peak power are going to be made at a later date. Using modified protocols to predict fatigue index and minimum power also appear to be highly reliable (R2 = 0.84 and 0.91 respectively) (Stickley et al. 2008).
When testing athletes, consistency between tests is essential. For the WAnT, the equipment used (pedal crank length, toe clips, seat height, cycle geometry, resistance setting) can be adjusted to exact settings, and therefore made both highly specific to the individual cyclist’s actual bike, and also reproducible across time. Care must also be taken to ensure consistency of environment (controlled laboratory conditions) as well as motivation of the athlete. Familiarisation with the test is also essential, as Barfield et al. (2002) demonstrated that subjects exhibit an increase in peak power output (14%) and mean power output (5%) due to a practice/familiarisation effect. It is therefore recommended that individuals perform a familiarisation test several days prior to any baseline measurements.
Related posts:

Stay updated, free articles. Join our Telegram channel

Full access? Get Clinical Tree


