Chapter 3 Anaerobic Metabolism during Exercise*
After studying this chapter, the reader will be able to do the following:
THE ENERGY CONTINUUM
Figure 3-1 reviews the three sources of ATP production. Figure 3-1, A describes alactic anaerobic metabolism, sometimes called the phosphagen or adenosine triphosphate–phosphocreatine (ATP-PC) system. Once ATP has been produced, it is stored in the muscle. This amount is relatively small and can provide energy for only 1 to 2 seconds of maximal effort. However, another high-energy compound, PC, also known as creatinephosphate (CP), can be utilized to resynthesize ATP from ADP instantaneously. The amount of PC in muscle is about three times that of ATP.1 Muscles differ in the amount of stored PC by fiber type. Muscle fibers that produce energy predominantly by anaerobic glycolysis are called glycolytic (G); those that produce energy predominantly aerobically are called oxidative (O). In terms of contraction speed, muscle fibers are either fast-twitch (FT) or slow-twitch (ST). When contractile and metabolic characteristics are combined, three fiber types are generally described: fast-twitch glycolytic (FG), fast-twitch oxidative glycolytic (FOG), and slow-twitch oxidative (SO). Fast-twitch fibers have proportionally more PC and ATP compared with slow-twitch oxidative fibers. Any time the energy demand is increased, whether the activity is simply turning a page of this book, coming out of the blocks for a sprint, or starting out on a long bicycle ride, at least part of the immediate need for energy is supplied by these stored forms, which must ultimately be replenished. These sources are also utilized preferentially in high-intensity, very short duration activity. Representative sports activities with a heavy reliance on the ATP-PC system include most football plays; sprints (e.g., track 100 and 200 m; swimming 50 m, softball/baseball base stealing, gymnastic vaults); shot put and javelin throwing; racquet, club, or limb swings (e.g., badminton, tennis, golf, volleyball, kicking); goalie reactions; and specific mountain biking moves. Together, the ATP-PC supply can support slightly less than 10 seconds of maximal activity. This ATP-PC system neither uses oxygen nor produces lactic acid (LA) and is thus said to be alactic anaerobic.
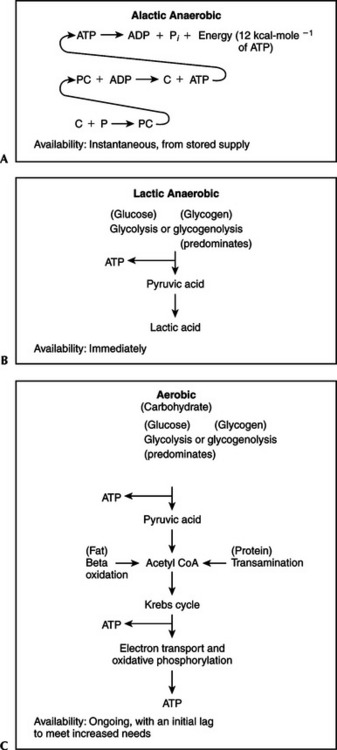
Figure 3-1 Anaerobic and aerobic sources of adenosine triphosphate.
(From Plowman SA, Smith DL: Exercise physiology for health, fitness, and performance, ed 2, San Francisco, 2003, Benjamin Cummings.)
Figure 3-1, B represents anaerobic glycolysis, also called the lactic acid system. When the demands for ATP exceed the capacity of the phosphagen system and the aerobic system (either at the initiation of any activity or during high-intensity, short-duration exercise), fast (anaerobic) glycolysis is utilized. This is like “calling in the reserves” because glycolysis can produce supplemental energy quickly. This system makes such activities as a 1500-m speed skating event possible. Other sport activities with a heavy reliance on the LA system include middle distances (e.g., track 200 to 800 m, swimming 100 m, slalom and downhill skiing); gymnastic floor exercise; parallel bars; a round of boxing; and a period of wrestling. The benefit is the ability to perform events with speed and power. The cost is that the production of lactic acid often exceeds clearance, resulting in lactate accumulation. Because this system does not involve the utilization of oxygen but does result in the production of lactic acid, it is said to be lactic anaerobic.
Figure 3-1, C shows aerobic oxidation, also called the O2 system. The generation of ATP from slow (aerobic) glycolysis, the Krebs cycle, and electron transport-oxidative phosphorylation is constantly in operation at some level. Under resting conditions this system provides basically all of the energy necessary. When activity begins or occurs at moderate levels of intensity, oxidation increases quickly and proceeds at a rate that supplies the necessary ATP. If the workload is continuously incremented, aerobic oxidation proceeds at a correspondingly higher rate until its maximal limit is reached. The highest amount of oxygen the body can consume during heavy dynamic exercise for the aerobic production of ATP is called maximal oxygen uptake ( O2max).
  O2max is primarily an index of cardiorespiratory capacity and as such is often used as a measure of cardiovascular-respiratory fitness. However, because
  O2max reflects the amount of oxygen available for the aerobic production of ATP, it is also an important metabolic measure. Both aerobic and anaerobic exercises are often described in terms of a given percentage of
  O2max (either < or > 100%
  O2max). Anaerobic metabolic processes are important at the onset of all aerobic exercise, contribute significantly at submaximal levels, and increase their contribution as the exercise intensity gets progressively higher. Depending on an individual’s fitness level, lactic anaerobic metabolism begins to make a significant contribution to dynamic activity at approximately 40% to 60%
  O2max. Even then the ability to process oxygen is most important. Because the aerobic system involves the use of oxygen and proceeds completely to oxidative phosphorylation, it is said to be aerobic or oxidative. Sport activities that rely predominantly on the O2 system include long distances (e.g., track 5000 m and 10,000 m, marathons, swimming 1500 m); cross-country (running, skiing, orienteering); field hockey; soccer and lacrosse; and race walking.
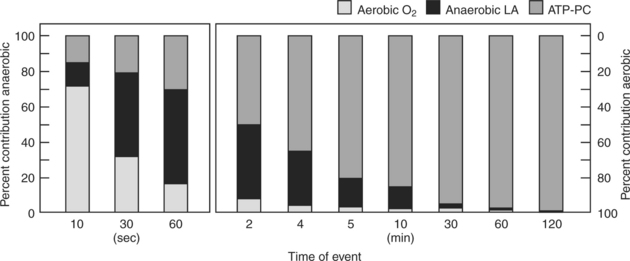
These three sources of ATP—the phosphagen system (ATP-PC), the glycolytic system (LA), and the oxidative system (O2)—are recruited in a specific sequence called the time-energy continuum. This continuum assumes that the individual is working at a maximal maintainable intensity for a continuous duration. This means it is assumed that an individual can go all out for 5 minutes or less or can work at 100%  O2max for 10 minutes, at 95%
  O2max for 30 minutes, at 85%
  O2max for 60 minutes, and at 80%
  O2max for 120 minutes. Although there are individual differences, these assumptions are reasonable in general.
Figure 3-2 indicates the relative contributions of each energy system to the total energy requirement under these conditions. These values are estimates that sometimes overlap but provide general trends, as well as some specific values.2,3 For example, during an all-out event that lasts 30 seconds, the dominant metabolism is anaerobic (80%), with approximately 33% being provided by the ATP-PC system and 47% by the LA system. Which system predominates during an event that takes 5 minutes, and what are the percentages? If you take time to analyze the graph, you should discover that the breakdown at 5 minutes is a mirror image of what occurs at 30 seconds. Now 80% of the energy is provided by aerobic oxidative metabolism and only 20% by anaerobic metabolism, split 3% ATP-PC and 17% LA.
 O2max) at 10 minutes; 95%
  O2max at 30 minutes; 85% of
  O2max at 60 minutes; and 80%
  O2max at 120 minutes. Adenosine triphosphate–phosphocreatine ≤10 seconds.
The rest of this chapter concentrates on the anaerobic contribution to energy metabolism. Chapter 4 concentrates on the aerobic contribution to energy metabolism, although it must be emphasized that the two systems work together, with one or the other predominating primarily on the basis of the duration and intensity of the activity.
ANAEROBIC ENERGY PRODUCTION
Alactic Anaerobic Phosphocreatine Production
As previously described, alactic anaerobic production of ATP involves the use of PC, which is simply creatine bound to inorganic phosphate. An adult human has a creatine level of approximately 120 to 125 mmol·kg−1of dry muscle, although there is considerable individual variation from a low of 90 to 100 mmol·kg−1to a high of about 150 to 160 mmol·kg−1. Each day approximately 2 g of creatine are degraded in a nonreversible reaction to creatinine. This creatinine is ultimately excreted by the kidneys in urine. The individual counterbalances this loss under normal dietary conditions by ingesting about 1 g of creatine from meat, poultry, or fish and synthesizing another gram in the liver from the amino acids arginine, glycine, and methionine. Close to 95% of the creatine in the body is stored in skeletal muscle. From 30% to 40% is stored as free creatine, and the rest as phosphocreatine.
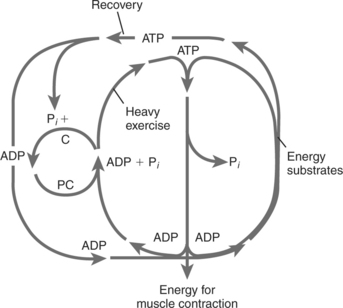
Figure 3-3 shows the breakdown of ATP and PC during heavy exercise. It also shows restoration of ATP from energy substrate sources and restoration of PC from the regenerated ATP. The process continues until both the PC and ATP resting levels are regained. Specifically, when ATP is hydrolyzed by the contractile proteins in muscle (large inner circle), the resulting ADP is rephosphorylated in the cytoplasm by the PC that is available there (small inner circle). In turn, the now free creatine is rephosphorylated at the inner mitochondrial membrane from ATP produced at that site (large outside oval). The remnant ADP is then free, in turn, to be phosphorylated again by oxidative phosphorylation. In addition to providing ATP rapidly, this mechanism, called the creatine phosphate shuttle, is one way in which electron transport and oxidative phosphorylation are regulated.4
Lactic Acid/Lactate Production
Lactic acid is produced in muscle cells when NADH + H+ formed in glycolysis is oxidized to NAD+ by a transfer of the hydrogen ions to pyruvic acid (C3H4O3), which, in turn, is reduced to lactic acid (C3H6O3).9,10 In muscle tissue, lactic acid is produced in amounts that are in equilibrium with pyruvic acid under normal resting conditions. In addition, lactic acid is always produced by red blood cells, portions of the kidneys, and certain tissues within the eye. Both resting and exercise values depend on the balance between lactic acid production (appearance) and removal (disappearance, or clearance). This balance of appearance and disappearance is called turnover. At normal pH levels lactic acid almost completely (≈99%) dissociates into hydrogen ions (H+) and lactate (C3H5O3−, designated as La−). Thus technically, lactic acid is formed, but lactate is what is measured in the bloodstream. Despite this distinction, the terms lactic acid and lactate are often used synonymously.9 When production exceeds removal, lactate is said to accumulate. The questions, then, especially during exercise, are what conditions result in lactic acid production and what processes lead to lactic acid/lactate removal? This section deals with the first of these questions.
Evidence-Based Clinical Application: Creatine as an Ergogenic Aid
Because of its role in the rephosphorylation of adenosine triphosphate from adenosine diphosphate and the theoretical impact this might have on performance and fatigue resistance, creatine (primarily in the form of creatine monohydrate) has enjoyed unprecedented popularity as an ergogenic aid. Oral creatine supplementation can reportedly increase muscle phosphocreatine content by approximately 20%, depending on an individual’s starting level. An upper limit for storage exists, so if an individual is already at that point (≈160 mmol·kg−1 of dry muscle), supplementation will not further increase storage. Excess ingested creatine is excreted in the urine.5,6 This can explain why one individual might respond to creatine monohydrate supplementation and another might be a “nonresponder.”
Despite numerous studies, the effectiveness of creatine supplementation has not been established. An American College of Sports Medicine Roundtable consensus statement concluded that the majority (approximately two thirds) of the studies reviewed that measured muscular force or power output, or both, during short bouts of maximal exercise in healthy, young (18 to 35 years old) adults (almost exclusively males) showed an enhancement. The greatest improvement in performance seemed to be found in the later bouts of a repetitive series of exercises in which the high power output lasted only a matter of seconds separated by rest periods of 20 to 60 seconds.5 These increases have been seen largely in average power outputs, however, not in peak power outputs.6 A number of studies have also indicated that creatine supplementation, along with heavy resistance training, enhances the normal training adaptation.5 However, when a mathematical analysis (called a meta-analysis) was conducted of studies that tested anaerobic performance, creatine supplementation showed no significant improvements for fatigue resistance, power, speed, strength, or total work.7
As with any supplement, concerns have been expressed regarding the safety of creatine ingestion. Two credible reviews have concluded that although there have been numerous anecdotal reports of gastrointestinal disturbances (nausea/vomiting/diarrhea), liver and kidney dysfunction, cardiovascular/thermal impairment, and muscular damage (cramps/strains), the supporting evidence, with a few notable exceptions, is not definitive. The most notable exceptions involved documented medical case reports of individuals with preexisting kidney problems that were aggravated with creatine supplementation and resolved when the supplementation was stopped. The following precautions are advised8:
Thus although lactic acid is associated with high-intensity, short-duration exercise, it is not the only exercise condition that results in the production of lactic acid. In addition, although a lack of oxygen can contribute to the production of lactic acid, the presence of lactic acid does not absolutely indicate a lack of oxygen. The presence of lactic acid simply reflects the use of the fast (anaerobic) glycolytic pathway for ATP production and the balance between glycolytic and mitochondrial activity. Furthermore, rather than lactic acid being a “waste product,” lactate provides a means of coordinating carbohydrate metabolism in diverse tissues.4 The formation, distribution, and utilization of lactate is a way for glycogen reserves to be mobilized and utilized either within the original cell or other cells. In the process, blood glucose is spared for use by other tissues.18,19 The use or reconversion, or both, of lactate comprise lactate clearance.
Lactate Clearance
Lactate clearance during rest and exercise occurs primarily by three processes: oxidation (50% to 80%), gluconeogenesis/glyconeogenesis (10% to 25%), and transamination (5% to 10%). All three processes involve the movement of lactate.18
As stated previously, at physiological pH more than 99% of the lactic acid produced quickly dissociates into lactate (La−) anions and protons (H+). Lactate moves readily between cytoplasm and mitochondria, muscle and blood, blood and muscle, active and inactive muscle, glycolytic and oxidative muscle, blood and heart, blood and liver, and blood and skin.20 Lactate moves between lactate-producing and lactate-consuming sites by means of intracellular and extracellular lactate shuttles.18 Transport across cellular and mitochondrial membranes occurs by facilitated exchange down concentration and hydrogen ion (pH) gradients using lactate transport proteins known as monocarboxylate transporters (MCTs).20
The intracellular lactate shuttle (Figure 3-4, A) involves the movement of lactate by MCT1 transporters between the cytoplasm, where it is produced, and the mitochondria. Once inside the mitochondria, lactate is oxidized to pyruvate and NAD+ is reduced to NADH + H+. The pyruvate and NADH + H+ proceed through aerobic metabolism/oxidation. This is a relatively new, and somewhat controversial, concept20–23 indicating that muscle cells can both produce and consume lactate at the same time.
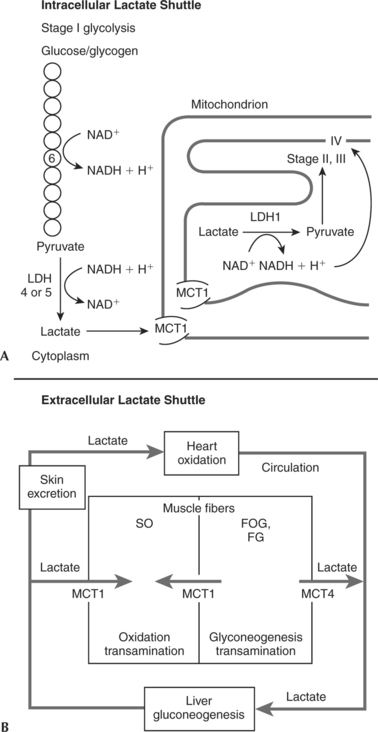
Extracellular lactate shuttles act to move lactate among tissues (Figure 3-4, B). Muscle cell membrane lactate proteins (MCT1 and MCT4) move the lactate out of and into tissues. Intermuscularly, most lactate moves out of active fast-twitch glycolytic skeletal muscle cells (FOG and FG) and into active SO skeletal muscle cells. This can occur either by a direct shuttle between the skeletal muscle cells or through the circulation. Once lactate is in the bloodstream, it can also circulate to cardiac cells. During heavy exercise, lactate becomes the preferred fuel of the heart. In this manner glycogenolysis in one cell can supply fuel for another cell. In each case the ultimate fate of the lactate is oxidation to ATP, CO2, and H2O by aerobic metabolism.13,20,24
Lactate circulating in the bloodstream can also be transported to the liver, where it is reconverted by the processes of gluconeogenesis/glyconeogenesis into glucose or glycogen, respectively. Indeed, the liver appears to preferentially make glycogen from lactate as opposed to glucose. In human glycolytic muscle fibers (both FOG and FG) some of the lactate produced during high-intensity exercise is retained, and in the postexercise recovery period it is reconverted to glycogen in that muscle cell.4,25,26
Both oxidative and glycolytic fibers can also clear lactate by transamination. Transamination forms keto acids (including some Krebs cycle intermediates) and amino acids. The predominant amino acid produced is alanine. In turn, alanine can undergo gluconeogenesis in the liver.13,14
THE ANAEROBIC EXERCISE RESPONSE
Oxygen Deficit and Excess Postexercise Oxygen Consumption
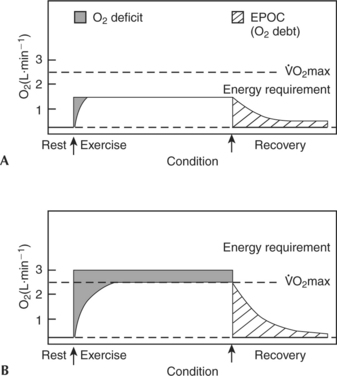
Figure 3-5 shows two scenarios for going from rest to different intensities of exercise. In Figure 3-5, A, the activity is a moderate submaximal bout. The oxygen requirement for this particular exercise is 1.4 L·min−1. The individual has a  O2max of 2.5 L·min−1. Therefore this individual is working at 56%
  O2max. The area under the smoothed curve during both exercise and recovery represents oxygen utilized. Notice, however, that there is an initial lag during which the oxygen supplied and utilized is below the oxygen requirement for providing energy. This difference between the oxygen required during exercise and the oxygen supplied and utilized is called the oxygen deficit. Because of this supply and demand discrepancy, anaerobic sources must be involved in providing energy at the onset of all activity.
The O2deficit has traditionally been explained as the inability of the circulatory and respiratory systems to respond quickly enough to the increased energy demands. More modern evidence, however, indicates that the O2 deficit is probably due to limited cellular utilization of O2 as a result of metabolic adjustments.27 That is, the increasing levels of ADP, organic phospate (Pi), and NADH + H+, brought about by the suddenly elevated energy demands, stimulate both aerobic and anaerobic energy processes, not just one or the other. Thus it is not that the aerobic system cannot supply all of the necessary energy but that the regulatory system does not allow it to. Therefore during the transition from rest to work, energy is supplied by the following:
Eventually, as long as the exercise intensity is low enough (as in the example in Figure 3-5, A), the aerobic system will predominate and the oxygen supply will equal the oxygen demand. This condition is called steady-state, steady-rate, or steady-level exercise.
Figure 3-5, B, shows a smoothed plot of O2 consumption at rest and during and after an exercise bout in which the energy requirement is greater than  O2max, sometimes called supramaximal exercise. The initial period of lag between O2supply and demand is once again evident and, as in the first example, the added energy is provided by stored ATP-PC, anaerobic glycolysis, and stored O2. However, in this case, when the O2 consumption plateaus or levels off, it is at
  O2max and more energy is still necessary if exercise is to continue.
This plateau is not considered to be a steady state because the energy demands are not being totally met aerobically. The supplemental energy is provided by anaerobic glycolysis. Exactly what the energy demand is in this situation is difficult to determine precisely. However, in a practical application of oxygen deficit theory, a measurement called maximal accumulated oxygen deficit (MAOD), expressed as O2 mL·kg−1, is sometimes calculated. This requires a controlled testing session with a duration of 2 to 3 minutes at an intensity of 110% to 125%  O2max. The resulting difference between a computed oxygen requirement and the measured oxygen consumption is taken as an indication of anaerobic capacity.28 Not surprisingly, sprinters and middle distance runners have been shown to have higher MAOD values than endurance distance runners.29 Although experimental results are promising, the validity of this technique is still a matter of debate.30 Without the anaerobic energy contribution, activity could not continue at this intensity.
The recovery from exercise represented by the concave curves following the cessation of exercise in Figure 3-5 shows that oxygen consumption drops quickly (a fast component lasting 2 to 3 minutes) and then tapers off (a slow component lasting 3 to 60 minutes). The magnitude and duration of this elevated oxygen consumption depend primarily on the intensity of the preceding exercise. In the case of light submaximal work (see Figure 3-5, A) recovery takes place quickly; after heavy exercise (see Figure 3-5, B) recovery takes much longer.
Historically, this period of elevated metabolism after exercise has been called the O2 debt, the assumption being that the “extra” O2 consumed during the “debt” period was being utilized to “pay back” the deficit incurred in the early part of exercise.31,32 More recently, the terms O2 recovery or excess postexercise oxygen consumption (EPOC) have come into favor. EPOC is defined as the oxygen consumption during recovery that is above normal resting values.
 O2max.14,31
Energy Power and Capacity
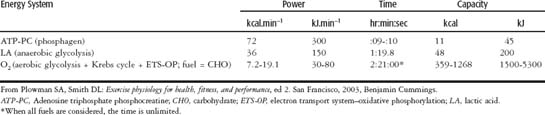
Energy system capacity is defined as the total amount of energy that can be produced by the energy system. Energy system power is defined as the maximal amount of energy that can be produced per unit of time. Table 3-1 clearly shows that the phosphagen (ATP-PC) system is predominantly a power system with very little capacity. The lactic anaerobic glycolytic system has almost equal power and capacity, just slightly favoring capacity. The anaerobic capacity is the total amount of energy available from nonaerobic sources. The information on the aerobic (O2) system is included here just to show how truly high in power and low in capacity the anaerobic systems are.
Unfortunately, there is still no generally accepted means by which to directly measure the anaerobic contribution during whole body exercise.30 However, there are two general approaches to describe the anaerobic exercise response. One approach describes changes in the chemical substances either utilized in alactic anaerobic metabolism (specifically, ATP and PC levels) or produced as a result of lactic anaerobic metabolism (lactic acid or lactate). The second approach quantifies the amount of work performed or the power generated during short-duration, high-intensity activity. The assumption is that such activity could not be done without anaerobic energy; therefore measuring such work or power indirectly measures anaerobic energy utilization.
Related posts:

Stay updated, free articles. Join our Telegram channel

Full access? Get Clinical Tree


