Chapter 4 Aerobic Metabolism during Exercise
After studying this chapter, the reader will be able to do the following:
CARDIOVASCULAR ANATOMY AND PHYSIOLOGY
Valves are present between the heart chambers, as well as within the heart and blood vessels. They function to control the volume of blood ejected from the heart and prevent the backflow of blood with each contraction. The right and left atrioventricular (AV) valves prevent the backflow of blood from the ventricles to the atria during ventricular contraction. The right AV valve is a tricuspid valve because it is composed of three cusps. The left AV valve only has two cusps and is therefore bicuspid. Two semilunar valves regulate the flow of blood from the ventricles. The right semilunar valve, also known as the pulmonary semilunar valve, is positioned between the right ventricle and pulmonary arteries. The left semilunar valve positioned between the left ventricle and the aorta is referred to as the aortic valve. The AV valves and semilunar valves have opposing functions; AV valves control ventricular filling during ventricular relaxation, called diastole, and semilunar valves control ventricular emptying during ventricular contraction, called systole.
RESPIRATORY ANATOMY AND PHYSIOLOGY


Lungs differ in both size and capacity, significantly contributing to the overall functional capacity of the respiratory system. Normative values of static, anatomical measurements of the respiratory system have been recorded in healthy adults (see the following box). Functional measurements have also been determined for dynamic components of respiration. These values are important determinants of aerobic capacity determining the efficiency of the cardiorespiratory system. Pulmonary minute volume (VE) is the amount of air moved in 1 minute. Minute alveolar ventilation (VA) is the amount of air capable of participating in gas exchange or the volume of air breathed each minute. During exercise, VAincreases with increases in metabolic rate and CO2 production. VE increases with the onset of exercise to meet the demands of VA to remove excess CO2. When exercise intensity reaches a particular level, blood flow to the exercising muscles becomes inadequate to provide the necessary O2.This is termed the anaerobic threshold and is the point at which anaerobic pathways become the primary source of energy production.
Evidence-Based Clinical Application: Lung Volumes
| Tidal volume (TV) | The amount of air inspired or expired in a normal breath at rest (0.5 L) |
| Inspiratory reserve volume (IRV) | The maximal amount of air that can be inspired beyond the TV (3 L) |
| Expiratory reserve volume (ERV) | The maximal amount of air that can be expired beyond the normal TV expiration (1L) |
| Residual volume (RV) | The volume of air that remains in the lungs after a forced, maximal expiration (1.2 L) |
| Inspiratory capacity (IC) | The maximal amount of air that can be inspired; equivalent to TV + IRV |
| Functional residual capacity (FRC) | The amount of air remaining in the lungs after normal exhalation; equivalent to ERV + RV |
| Vital capacity (VC) | The volume of air exhaled during a forced exhalation; IRV + TV + ERV |
| Total lung capacity (TLC) | TV + IRV + ERV + RV (4 L in females; 5.7 L in males) |
AEROBIC METABOLISM
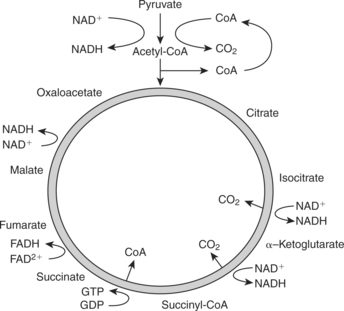
The primary sources of fuel driving the aerobic system are carbohydrates and fats. Fat molecules, or triglycerides, are composed of one glycerol molecule and three fatty acid chains. Because the body cannot store triglycerides in their ingested form, they are broken down during a process known as lipolysis into glycerol and fatty acid chains. Fatty acid chains, composed predominantly of hydrogen and carbon atoms, are stored either in fat cells or released into the bloodstream to be oxidized for energy. When taken up by mitochondria, free fatty acid chains undergo beta oxidation, a process that produces acetyl CoA and hydrogen. Acetyl CoA enters the Krebs cycle, and H+ is carried by nicotinamide adenine dinucleotide (NADH) and flavin adenine dinucleotide (FADH2) to the electron transport chain (ETC). For every two carbons in a fatty acid, oxidation yields five ATPs generating acetyl CoA and 12 more ATPs oxidizing the coenzyme, producing a net 17 ATP (Figure 4-1).
Carbohydrates are composed of carbon, hydrogen, and oxygen and classified on the basis of the number of sugar molecules that compose the compound (monosaccharide, disaccharide, or polysaccharide). Aerobic glycolysis is the process by which glucose is broken down into pyruvate. The Krebs cycle begins with pyruvate, the end product of glycolysis. The Krebs cycle produces two ATP molecules from guanine triphosphate (GTP) per molecule of glucose consumed. In addition, six molecules of NADH and two molecules of FADH2 are produced and enter the ETC. The ETC uses these molecules to produce ATP from ADP. The process ATP formation from aerobic pathways is referred to as oxidative phosphorylation. The resultant energy production in a net of 38 ATP0 molecules generated from one molecule of glucose is shown in Figures 4-2 and 4-3).
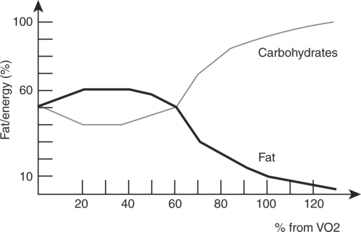
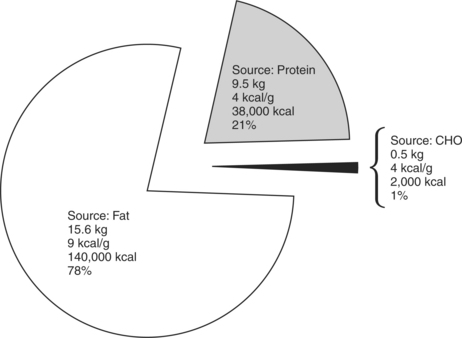
Efficiency is the proportion of total available energy that is used for work or is stored for future use. Fat is a more efficient fuel source during low-level activities because it is more readily available through fat stores and lipolysis. Energy produced from 1 g of fatty acids is 9 kcal compared with 4 kcal/g from carbohydrate or protein. The individual’s nutritional intake, as well as the intensity and duration of exercise performed, dictates whether fats or carbohydrates are the primary or secondary fuel source in aerobic metabolic pathways. Fats are primarily used during lower-intensity activities over a long duration. Carbohydrates are primarily used during more intense activities of shorter duration activities. At rest, more fats than carbohydrates are typically burned for fuel. As activity level increases, a shift from the utilization of fats to more carbohydrates occurs to meet the increasing energy demands (Figure 4-4).
 O2max) testing.
ACUTE CHANGES IN AEROBIC METABOLISM WITH EXERCISE
Cardiovascular System
Exercise rapidly increases the energy demands of the body. The CV system matches these energy requirements through the regulation of blood flow to working muscles. Increasing circulation ensures adequate O2 supplies for aerobic energy pathways and removal of waste products to prevent the accumulation of CO2, lactic acid, and heat. Changes in both central and peripheral centers aid in the regulation of O2 delivery and CO2 removal.
Central Mechanisms
HR is one of the most commonly used means to determine exercise intensity. As mentioned earlier, the number of times the heart contracts per minute in a resting state is referred to as the RHR. With the onset of both aerobic and resistance exercise, RHR rapidly rises.2 The rapid increase in HR is a function of parasympathetic stimulation by the ANS. Older, sedentary adults may have a more rapid increase in HR in response to low-intensity exercise compared with more active older adults or even sedentary, younger adults. HR continues to rise in a positive, linear fashion with an increase in exercise intensity. Maximal heart rate (MHR) is the maximum number of times the heart can beat in 1 minute. Prediction models have generated simple mathematical equations that easily predict MHR from age.


Stroke volume (SV) is the volume of blood ejected from the left ventricle with each beat. SV is the difference in volumes between the end diastolic volume (EDV), or amount of blood available in the left ventricle after diastole, and end systolic volume (ESV), or volume of blood available after systole. Initiation of aerobic exercise results in increased SV2 explained by the Frank-Starling mechanism. The Frank-Starling mechanism is a mechanical property of cardiac muscle stating that muscle contraction force is directly proportional to a muscle’s length. With exercise, there is an increase in left ventricular filling during diastole. The rise in circulatory blood volume increases the stretch, or length, on ventricular myocardial muscle. The greater muscle stretch yields a more forceful contraction during systole, ejecting a greater volume of blood with each heart beat. The volume of blood or fraction of EDV ejected from the heart with each beat is called the ejection fraction.
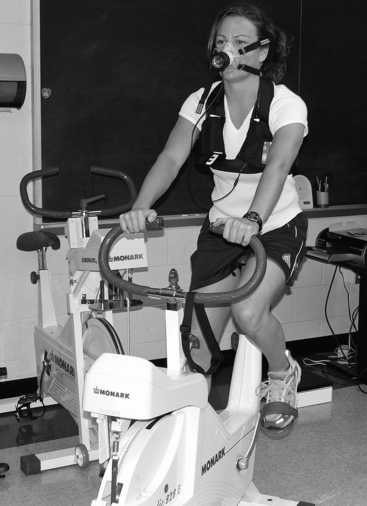
Evidence-Based Clinical Application: Assessing Aerobic Capacity
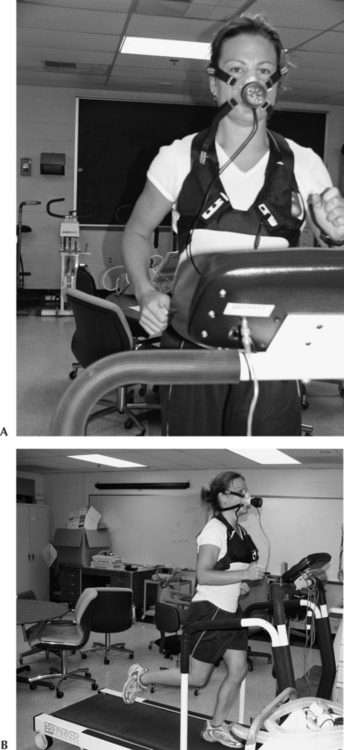
Aerobic capacity is the ability of the cardiovascular system to deliver and use O2. Assessment of aerobic capacity can be determined via direct, maximal test measures or indirect, submaximal testing. The “gold standard” for determining aerobic capacity is  O2maxtesting.
  O2max testing measures the amount of O2 consumed per unit of time. These values are derived from inspiratory and expiratory volume measures, as well as inspired O2 and expired CO2 concentrations. Treadmills, stationary bicycles, and upper body ergometers are the main methods used to determine aerobic capacity. During
  O2max testing individuals are asked to perform an activity while workload is progressively increased until an increase in workload does not elicit a further increase in O2 consumption (Figure 4-5).
Gold standard methods are not always easy to administer and are often time consuming, making them impractical clinical tests. Submaximal tests, although less accurate, have been validated through correlation of  O2max and physiological measures of submaximal exercise such as HR. Predictive equations have been derived on the basis of the linear relationships between HR and O2 consumption. Examples of submaximal assessments of aerobic capacity include the YMCA cycle ergometer test, 3-minute Step Test, Cooper 12-minute walk/run test, and the Rockport One-Mile Fitness Test (Figure 4-6).

Although SV rapidly rises with the onset of aerobic exercise,2,3 it reaches a plateau at which SV remains at a specific volume despite increasing exercise intensity. At 40% of maximal oxygen consumption ( O2max), SV approaches near maximum levels.3 The early increase in SV is a function of increased venous return. Heavy resistance training does not induce similar changes in SV. SV does not change or changes little in response to resistance exercise. During resistance training, individuals often hold their breath to generate greater force. This results in increased intra-abdominal and intrathoracic pressures, which limits venous return and subsequently does not significantly alter EDV. This mechanism of enhancing force-generating capacity is referred to as the Valsalva maneuver.

At the onset of aerobic exercise there is a concomitant rapid increase in CO as a function of increased HR and SV.2,3 As exercise intensity and exertion increase continue to rise, HR and SV and therefore CO continue to increase. As O2 uptake values approach maximum, CO reaches a steady-state or plateau at which CO remains constant despite increasing intensity.3 Increased myocardial contractility, increased blood flow to working muscles, constriction of venous blood vessels, and decreased total peripheral resistance also influence CO during exercise. CO can increase from 5.6 L/min at rest to 35 to 40 L/min with strenuous exercise in young adults. This represents a sevenfold to eightfold increase in CO.
Evidence-Based Clinical Application: The Valsalva Maneuver
The Valsalva maneuver, a natural response to lifting heavy loads, is characterized by a forced exhalation against a closed glottis. During forced exhalation, a sudden increase in intra-abdominal and intrathoracic pressures is produced by the contractions of the abdominal and respiratory muscles. Elevated pressures compress the blood vessels within the chest cavity, leading to a decrease in venous return and CO. In addition, compression of the aorta leads to stimulation of the baroreceptors, producing a reflex-induced bradycardia to compensate for the increased pressures. Aortic pressure subsequently rises, stimulating sympathetic activity. HR and BP rise in response to maintain CO and perfusion. At the cessation of the forced exhalation, venous return rapidly increases, intra-abdominal pressures drop, and CO is increased, dramatically increasing the mechanical load on the heart.4
The Valsalva maneuver can be dangerous due to the sudden and abrupt changes in BP. These dramatic changes in HR, BP, and CO may produce symptoms including dizziness, lightheadedness, and syncope. However, the Valsalva technique can help protect against injury during heavy weight lifting. The supporting ligaments of the spine can only support 4 to 5 lb of pressure before failing.5 Therefore performing the Valsalva maneuver during heavy lifts, such as the Roman dead lift, squats, bench press, and clean and jerk, assists core musculature in supporting the spine and decreases the compressive load on the intervertebral disks.6
BP is a function of CO and resistance to blood flow or total peripheral resistance (TPR). Increases in systolic blood pressure (SBP) are also evident at the onset of aerobic exercise, whereas small decreases, if any, are noted in diastolic blood pressure (DBP).2 SBP continues to increase in a positive, linear fashion as exercise intensity progressively increases. A 10- to 20-mmHg increase in SBP can be expected during dynamic exercise. DBP, on the other hand, has been observed to slightly decrease during dynamic treadmill exercise. Resistance training results in increased central/carotid SBP, although BP returns to preexercise levels within 30 minutes of the exercise bout.7
 O2max is a measure of the body’s utilization of O2 and is the greatest amount of O2consumed per minute at maximum effort.
  O2max is a major determinant of cardiopulmonary fitness and is often expressed relative to body weight (ml/kg/min). The rate of extraction of O2 in the tissues of an individual at rest is 4 to 5 ml of O2 per 100 ml of blood. The amount of O2 consumed and the percent of
  O2max used depend on body mass, exercise intensity, and mode of exercise. At the onset of aerobic exercise, O2 uptake increases progressively. As intensity increases and nears
  O2max, O2 extraction rate increases to approximately 13 to 16 ml of blood during maximal aerobic exercise intensity. As a general rule, the greater the percentage of muscle mass used during aerobic exercise, the greater the rate of O2extraction. Activities such as running, swimming, and cycling use a large percentage of
  O2max because larger muscle groups (i.e., quadriceps femoris, gluteal muscles, latissimus dorsi) are the prime workers.
Resistance training often takes the form of short bursts of physical activity and therefore does not significantly alter  O2max. However, programs consisting of low resistance and high numbers of repetitions model trends in O2 uptake similar to aerobic modes of training. For example, a continuous circuit resistance training exercise consisting of 10 exercises at 40% of 1 repetition max (RM) allows individuals to sustain O2 uptake at approximately 50% of
  O2max for more than a 15-minute period, although VO2 increases more rapidly with treadmill exercise. In addition, continuous circuit resistance training can result in higher exercise HRs of up to 10 beats/min faster than can be achieved during similar-intensity treadmill exercise.8 These changes are much less than typical aerobic endurance training protocols and are also not evidenced with traditional strength training programs.9,10 In addition, no further CV benefit is achieved as a result of combining strength training with endurance training.11,12
Respiratory System
Respiratory changes in response to aerobic exercise match the O2 uptake required for a particular activity level. A notable increase in gas exchange rate occurs within the first one to two breaths. This sudden response in gas exchange rate is triggered by altered levels of O2 saturation. O2 uptake continues to increase for the first few minutes until a steady-state is reached.13,14 During steady-state exercise, O2 demand equals O2 consumption. Increases in alveolar ventilation rate can be as high as 10 to 20 times the resting rate in response to heavy exercise in order to match the additional O2 demand and excrete excess CO2 imposed by increased physiological demand. Increased CO2 production also results from aerobic exercise as a function of increased O2 utilization. Increased blood CO2 levels cause a decrease in blood Po2, an increase in blood Pco2, an increase in blood H+ (more acidic), and an increase in core body temperature.
 O2max, the greater degree of exertion that can be exhibited before reaching oxygen debt. In addition, oxygen debt in individuals with large
  O2max is less than in individuals with smaller
  O2max.
After the completion of a bout of exercise, O2 uptake, respiratory rate, Po2, and Pco2 return to normal preexercise levels. The duration to which these measures return to their normal state depends on exercise intensity and duration of the exercise. The function of increased postexercise O2 uptake is to replenish deficient stores of ATP, remove lactic acid accumulation in muscle tissues, replace myoglobin O2 content, and replenish glycogen stores. Within 30 seconds of low-intensity aerobic exercise, approximately one half of the oxygen debt is replenished and return to baseline occurs within several minutes. With greater levels of exertion and longer duration of exercise, there is a more substantial increase in blood lactate levels, which may require up to 24 hours before returning to baseline.
Related posts:

Stay updated, free articles. Join our Telegram channel

Full access? Get Clinical Tree


