The Hip 
The hip (or femoroacetabular) joint is a ball-and-socket articulation, which connects the axial skeleton with the lower extremity. It is one of the largest joints in the body and helps retain balance and supports the body’s weight in both static and dynamic postures. The concave acetabulum articulates with the convex femoral head permitting a joint space, which is equal at each point with slight deviation to allow adequate lubrication. This symmetry allows for rotation about a fixed axis related to the action of four groups of muscles that permit adduction, abduction, flexion, and extension of the lower extremity.
Various diseases of traumatic, degenerative, infectious, and metabolic origin may affect the hip, similar to any other joint. A systematic imaging analysis and structured reporting is essential for optimal diagnostic assessment of the hip structures. In most situations, unilateral hip imaging provides better spatial and contrast resolution, due to the small field of view and use of a dedicated surface coil. Imaging of both hips as part of pelvis protocol is recommended in suspected osteonecrosis, decubitus ulcer or search for metastases. Intravenous contrast material may be used to determine the tissue viability in osteonecrosis and in cases of suspected infection or tumors. Direct MR arthrography is traditionally indicated in cases of suspected labral pathology, intra-articular bodies, osteochondral lesions, as well as for preoperative assessment of developmental hip dysplasia, especially on low field scanners. Alternatively, indirect MR arthrography can be performed by intravenous injection of gadolinium (1 mmol/kg) followed by 10 to 15 minutes of gentle exercise and subsequent acquisition of fat-saturated (fs) T1-weighted (T1W) images in all three orthogonal planes. With current high resolution and 1.5 T or 3T imaging, indications for arthrography are diminishing. On the most part, MR arthrography is performed if patients need a diagnostic or therapeutic pain injection as well. This chapter discusses the imaging evaluation approach and describes how to fill in the structured checklist in Box 1. Conceptual details of related MR physics and imaging protocol are discussed in the chapter of MR protocol optimization.
 IMAGE EVALUATION
The below-outlined stepwise interpretation approach is only a practical guide, and all hip structures should be evaluated in multiple planes for their optimal assessment. This will also help readers perceive which structures are best depicted and evaluated in which particular plane.
1. Line up the similar plane fs and non-fs images and synchronize them for tandem evaluation. Evaluate the visualized pelvic viscera, sacrum, and spine in all three planes, before assessing the hip for significant pathology or mass lesions.
2. Start with the coronal images and look for possible hip effusion, which will be evident by capsular distention. Evaluate the bones in regards of alignment, presence of femoral head and neck bump, fibrocystic change and shallow acetabulum, os acetabulum, and check the bone marrow for red marrow reconversion or other signal abnormality. Next, rule out cartilaginous or osteochondral bodies and ligamentum teres pathology, and check the gluteal, hamstring, and iliopsoas tendons for anatomic continuity, tears or adjacent insertional abnormalities (e.g., trochanteric bursitis, enthesopathy, avulsive cystic changes). Subsequently, evaluate the superolateral labrum and chondrolabral junction, and look particularly for paralabral cysts. Finally, check the articular cartilage for osteoarthritic changes or osteochondral lesions.
3. On sagittal images, evaluate the anterosuperior and posteroinferior labrum and the respective chondrolabral junctions. This is a good plane to assess for potential joint space loss, cartilage defects, fissures, and subchondral cysts, especially at the anterosuperior joint compartment, the most common site for labro-cartilagenous lesions. Finally, check for iliopsoas bursitis and tendon retraction, if there are gluteal, hamstring, or rectus adductor aponeurosis tears.
4. The axial plane is optimal for the evaluation of the anterior and posterior labrum (check again for paralabral cysts) and iliopsoas bursa, but also provides adequate assessment of the gluteal, hamstring, and iliopsoas tendons and their related bursae. Regional muscles, vessels, and nerves are also best evaluated on the axial images.
 BOX 1: The Structured Report: Hip
The checklist for structured reporting of MR imaging of the hip. For each field, Normal is considered default in the dictation whereas the rest of the elements describe various pathologies that could be encountered during imaging evaluation. See Appendices 1 and 2 at the end of the chapter for sample completed reports for normal and abnormal examination results.
EXAM: MRI OF THE [<RIGHT / LEFT>] HIP [<WITH / WITHOUT>] CONTRAST
FINDINGS:
Alignment: [<Normal> <Subluxation / Dislocation>]
Femoroacetabular impingement-related anatomy:
Pincer: [<Normal> <Retroversion / Overcoverage / Os acetabulare>]
Cam: [<Normal head-neck offset> <Fibrocystic lesion of femoral neck / Femoral head and neck bump>]
Dysplasia: [<None> <Shallow acetabulum / Labral hypertrophy>]
Fluid: [<Normal> <Small effusion / Moderate effusion / Large effusion> <Synovial hypertrophy>]
Trochanteric bursitis: [<Absent / Present>]
Labrum: [<Normal> <Degenerative fraying> <Tear> <Chondrolabral separation> <Paralabral cyst> <Labral ossification>]
Cartilage:
Femoral: [<Normal> <Low-grade thinning / High-grade thinning> <Low-grade defects/ High-grade defects>]
Acetabular: [<Normal> <Low-grade thinning / High-grade thinning> <Low-grade defects/ High-grade defects>]
Capsule/ligaments: [<Normal> <Thickened or sprained iliofemoral, ischiofemoral, or pubofemoral ligaments>]
Visualized muscles/tendons:
Gluteal: [<Normal> <Strain> <Tendinopathy> <Muscle atrophy> Enthesopathy>]
Adductors: [<Normal> <Strain> <Atrophy>]
Iliopsoas: [<Normal> <Strain>]
Lateral rotators: [<Normal> <Strain> <Piriformis asymmetry> <Ischiofemoral impingement-related edema and/or fatty infiltration of quadratus femoris>]
Hamstrings: [<Normal> <Strain> <Tendinosis> <Enthesopathy>]
Bones: [<Otherwise normal>]
Vessels: [<Normal / Abnormal>]
Nerves: [<Normal / Abnormal>]
Viscera: [<Visualized pelvic structures appear normal. No lymphadenopathy by size criteria. No significant free fluid in the pelvis / Ascites>]
Miscellaneous:
IMPRESSION:
[<In the order of importance with acute findings first>]
 HOW TO FILL THE STRUCTURED REPORT
ALIGNMENT: [<Normal> <Subluxation / Dislocation>]
FEMOROACETABULAR IMPINGEMENT-RELATED ANATOMY:
Pincer: [<Normal> <Retroversion / Overcoverage / Os acetabulare>]
Cam: [<Normal head-neck offset> <Fibrocystic lesion of femoral neck / Femoral head and neck bump>]
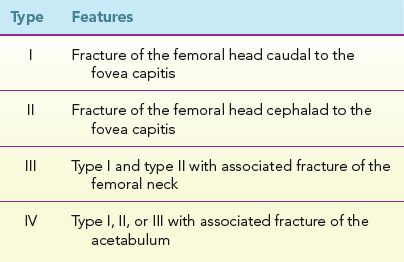
Evaluation of the bony structures and alignment is best performed on non-fs images, which provide accurate assessment of the bone marrow and cortex, as well as clear depiction of osteophytes. The spherical-shaped femoral head should normally be centered within the acetabular fossa (Fig. 1). In posterior subluxation/dislocation, the femoral head is placed superolaterally with respect to the acetabulum, and the condition may be complicated with injury to the sciatic nerve. In the less common anterior subluxation/dislocation, the femoral head is displaced anteroinferiorly with respect to the acetabulum, and the entity may be associated with injury to the femoral artery and nerve. In central dislocation, the femoral head protrudes into the pelvic cavity, and the entity may be complicated with intrapelvic soft tissue injury and hemorrhage. These can be commonly seen in association with underlying bone insufficiency, such as with osteoporosis, inflammatory arthropathy, or osteomalacia. When associated with femoral head fractures, hip dislocations may be classified according to the Pipkin classification, the key criterion of which is whether the fracture line lies above or below the fovea capitis (Table 1). Spina bifida may be associated with valgus hip posturing (coxa valga) (Fig. 2).
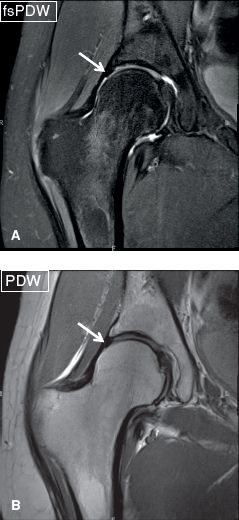
Fig. 1: Normal hip bony alignment. Coronal images (A, B) demonstrate the spherical-shaped femoral head centered within the acetabular fossa. Notice normal hypointense appearance of the labrum.
Fig. 2: Abnormal hip alignment. Axial (A) and coronal (B, C) images show a case of spina bifida (arrow in A) associated with valgus hip posturing (arrows in B, C).
TABLE 1: The Pipkin classification of femoral head fractures, when associated with hip dislocation
Femoroacetabular impingement (FAI) refers to chronic pathomechanical abutment of the femoral head–neck junction and acetabulum, which leads to acetabular labral tears and breakdown of the articular cartilage, and subsequent development of early osteoarthritis (OA) in otherwise normal hip. FAI may result from a “too big or posteriorly rotated (retroverted) acetabulum” configuration, which results in excessive coverage of the femoral head globally and anterolaterally, respectively by the acetabulum. It leads to abnormal contact between the acetabular rim and femoral head–neck junction (pincer-type FAI). Alternatively, a “too big head” configuration, which refers to a non-spherical femoral head or an inadequate femoral head–neck offset, leads to abnormal compression and stress between the acetabular labrocartilaginous complex and the prominent femoral head–neck junction during hip flexion, adduction, and internal rotation (cam-type FAI). Commonly, both mechanisms play together in the course of FAI and/or progression to OA. Prevention of irreversible degenerative joint changes is feasible by surgical intervention only in early stages of the disease; thus, prompt detection and grading of the disease are imperative to improve the patient prognosis. Some subjects depending upon their type and level of activities (e.g., golfing, soccer) may be predisposed to FAI at different degrees of femoroacetabular articulations (dynamic FAI) and the respective degree of correctional surgery may differ, meaning personalized to such subjects. It should be noted that FAI is a clinical diagnosis and it is best to describe the altered anatomy and refer in impression as “anatomy associated with FAI” with associated labrocartilaginous lesions.
Pincer-type FAI may be congenital (e.g., coxa profunda with global overcoverage, or acetabular retroversion with focal overcoverage at the anterolateral margin) or acquired (e.g., prior trauma, os acetabulare and marginal osteophytes). Coxa profunda is diagnosed on radiographs if the acetabular margin extends medial to the ilioischial line and on MRI if the center-edge angle is more than 39 degrees (normal 19 to 39 degrees). One can also draw the lateral center-edge (Wiberg) angle on coronal images, with the vertical and oblique lines intersecting through the center of the femoral head and the lateral acetabular margin, respectively. The angle is small (<19 degrees) in dysplasia and large (>39 degrees) in overcoverage. Another way one might diagnose overcoverage on MRI, would be using the axial images obtained through the midlevel of the femoroacetabular joint, where the center of the femoral head circumference will lie medial to the line drawn from the anterior to the posterior bony margins at the base of the labrum. A recent study showed that it is quiet common to see this finding on radiographs in asymptomatic subjects and it may not predispose to FAI. Acetabular retroversion is present when the alignment of the acetabular face is not directed in the normal anterolateral direction but inclines more posterolaterally. The condition may be part of a complex dysplasia or a single entity and is established on axial images when the anterior wall margin of the acetabulum is neutral or more lateral as compared to the posterior wall margin whereas in normal hip, the anterior wall lies more medially. This should be assessed on proximal 2 to 4 sections of the hip joint where one sees the complete femoral head. Correlation with available radiographs should be obtained, where one may see a figure-of-eight sign, that is, anterior wall crossing lateral to the posterior wall along the superior aspect of the acetabulum (Fig. 3). Current trend is to obtain pre-operative CT imaging in FAI patients to evaluate the hip anatomy and calculate the acetabular as well as femoral version in the same setting. Femoral version can either protect (antevesion making CAM deformity less likely to impinge) or make it more susceptible (relative retroversion making it more likely to impinge). Similar imaging can be done with MRI but this approach requires more time for acquisition with potential coil movement from hip to knee.
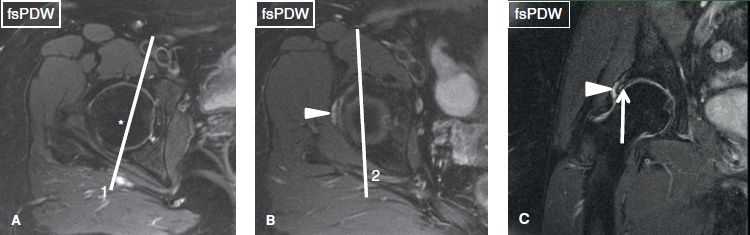
Fig. 3: Pincer-type femoroacetabular impingement presenting with left hip pain. Axial (A, B) and coronal (C) images. At the midlevel of the femoroacetabular joint (A), the center of the femoral head (asterisk) is lateral to the line (1) drawn from the anterior to the posterior labrum, indicating absence of global overcoverage. In a superior axial image (B), one can see anterior wall of acetabulum lateral to the posterior wall, line (2). Notice superolabral tear (arrow in C) with an associated paralabral cyst (arrowheads in B, C).
Common soft tissue imaging findings in pincer-type FAI include smaller anterosuperior and larger posteroinferior labral lesions (degeneration, truncation, hypertrophy, and tears with/without paralabral cysts), along with associated damage of the acetabular articular cartilage and/or subchondral cyst formation. Absence of large areas of cartilage abnormality or significant arthritis on MR imaging is good predictor of successful outcome in FAI cases. Other osseous findings include intralabral ossification at the lateral margin of the acetabular dome and the anterior margin of the hip joint, lateral acetabular rim fracture, as well as bony buttering and indentation with or without sclerosis at the femoral neck, due to pinching effect by the large acetabulum. Rim fracture is oriented perpedicular to the acetabular margin as compared to commonly found parallel oriented Os acetabulare. Additional finding of cartilage coverage over the rim is supportive for the diagnosis of a rim fracture. On delayed gadolinium-enhanced MR imaging of cartilage (dGEMRIC), one would see global T1 signal alteration reflective of diffuse glycosaminoglycan loss. The term “os acetabuli” refers to periacetabular ossicles, which should raise the suspicion for underlying labral pathology, especially in adult subjects. They should not be confused with ossification of the acetabular labrum, in which bone marrow signal intensity extends into the substance of the labrum (Fig. 4).
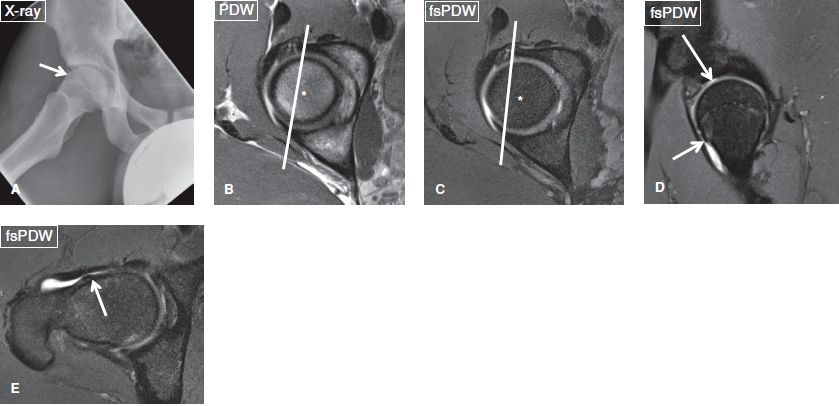
Fig. 4: Mixed (pincer- and cam-type) femoroacetabular impingement. A: Anteroposterior radiograph shows overcoverage with labral ossification (arrow). B, C: On axial images, the center of the femoral head (asterisks) is medial to the line drawn from the anterior to the posterior acetabular margins, indicating overcoverage that would cause pincer-type femoroacetabular impingement. D: Sagittal images reveal a bump (short arrow) at the femoral head–neck junction reflecting cam-type femoroacetabular impingement. Also note a high-grade cartilage defect of the anterosuperior acetabulum (long arrow). E: The bump (arrow) is also confirmed in the axial plane.
In cam-type FAI, a bony bump exists in the femoral head–neck junction, creating lack of normal concave offset (straightening or convex margin), which may be developmental or may be result of prior slipped capital femoral epiphysis (SCFE). The size of the associated fibrocystic change may vary from a tiny, few millimeter lesion (more common) to a giant lesion >1 cm (Figs. 5, 6). Other acquired etiologies include prior trauma and avascular necrosis (AVN) of the femoral head. The diagnosis can be established on oblique axial non-fs images, when there is decreased anteroposterior distance (<8 mm, normal >11 mm) between the lines drawn as tangents to the femoral head, and neck, respectively. Anterior femoral distance (AFD) may be measured as the distance between lines tangent to the neck and the bump. More than 3.6-mm AFD also confirms CAM-type impingement anatomy. The other widely accepted measurement to establish the abnormality is the alpha angle. The latter is again calculated on the oblique axial image or frog leg lateral view through the fovea by extrapolating one line along the long axis of the femoral neck through the center of the femoral head, and a second line from the center of the femoral head to a point on the anterior femoral head where it exits the radius of the best fit circle on the femoral head. A normal alpha angle is 42 degrees with an upper limit of 55 degrees (Fig. 7). Patients are usually symptomatic when the angle is more than 65 degrees. Depending upon the degree of bony protuberance of the femoral head and neck junction, the findings may be reported as lack of normal concave offset, or bump at the femoral head and neck junction (Fig. 8). Chronic abutment of the acetabulum over the anterosuperior femoral bump can cause small cortical defects on the latter, through which synovial tissue may herniate and create T2 hyperintense subcortical cysts, termed fibrocystic changes or herniations pits (Figs. 5, 6, 8). Other typical findings in cam-type FAI include anterosuperior and superolateral labrum tears (commonly with associated chondrolabral separations), cartilage loss with/without subchondral cysts at the anterosuperior aspect of the acetabular dome and/or femoral head, femoral collar osteophyte formation, thickening of the iliofemoral ligament, and occasionally regional scarring of the synovial lining under the iliofemoral ligament, aka soft tissue CAM lesion. Soft tissue cam lesion is composed of fibrocartilage and synovial proliferation, which may be associated with subcortical bone marrow edema of the femoral head and neck junction or subcortical sclerosis on CT. It basically reflects early stage of FAI, which may be diagnosed in adolescent children and relatively younger adults, before full-blown fibrocystic changes develop in the head and neck area. In advanced stage of FAI, one will see multifocal high-grade and full-thickness cartilage loss (usually worse on the acetabular side), large osteophyte formation, perifoveal osteophytes, joint space loss, intra-articular synovial thickening, and/or loose bodies (Figs. 8, 9). Detection of cartilage abnormality is essential to report since labral teas are virtually the rule in the setting of FAI anatomy and the surgeon would want to know the cartilage status ahead of time before intervening for these labral and bony lesions. Few pitfalls should be kept in mind. The bump and fibrocystic change may be anterior, lateral, or superolateral, therefore, close interrogation of the femoral head and neck junction in all three planes is recommended, ideally with 3D imaging on CT or MRI (Figs. 9, 10). The fibrocystic changes may have different signals of fluid, fibrous tissue, or fat depending upon the temporal evolution and chronicity; thus, evaluation of both fs and non-fs images in tandem is recommended. Other advantages of isotropic 3D imaging include lesion visualization in any arbitrary plane with similar resolution, CT-like bone reconstructions for preoperative mapping, and sharper definition of labral tears and cartilage fissures (Figs. 10–12). Finally, it should be noted that normal recesses (feature smooth margination) exist around the acetabular labrum underneath the iliofemoral ligament (perilabral sulcus) and at the anteroinferior and posteroinferior labral attachments with the transverse ligament, and these should not be mistaken for tears (irregular shape, intralabral signal alterations, abnormal labral morphology with truncation, and/or paralabral cyst).
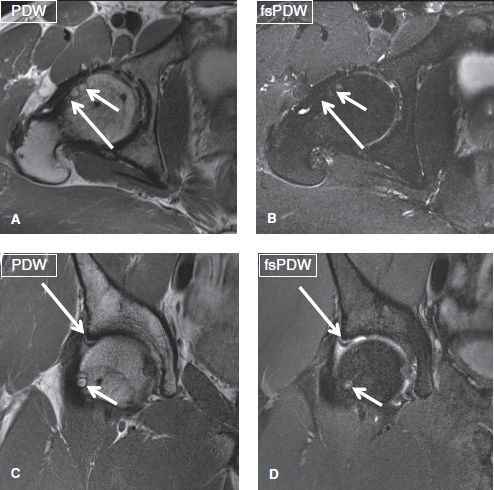
Fig. 5: Cam femoroacetabular impingement. A, B: Axial images at the midlevel of the femoroacetabular joint show inadequate femoral head–neck offset (long arrows), along with herniation pits (short arrows), some cystic and some partially fatty at the anterior aspect of the femoral head. C, D: The corresponding coronal images exhibit superolateral chondrolabral separation (long arrows). Note again the herniation pit/fibrocystic change (short arrows) of the femoral head and neck junction and a full-thickness cartilage defect of the superolateral acetabulum.
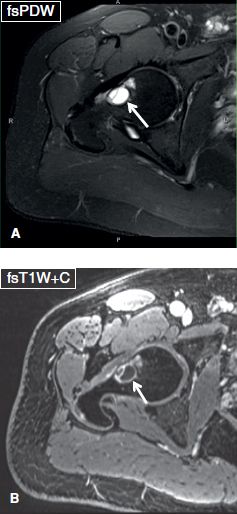
Fig. 6: Giant fibrocystic lesion. Axial images (A, B) show a large fibrocystic change (arrows) at the femoral head–neck junction, which demonstrates peripheral enhancement, reflecting herniated synovium in the setting of cam-type FAI.
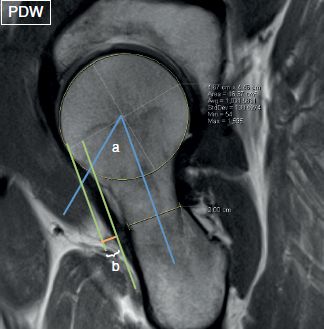
Fig. 7: Measurement of head–neck offset and alpha angle. Image acquired in oblique plane to reveal the full extent of the head–neck anatomic association displays the measurement of the alpha angle (a) and head–neck offset (distance b).
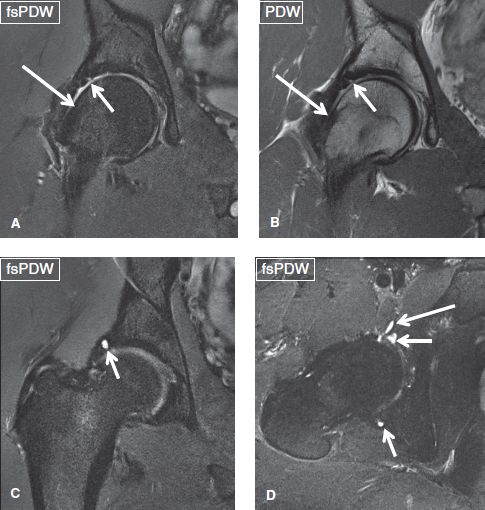
Fig. 8: Cam femoroacetabular impingement. Coronal (A–C) and axial (D) images exhibit lack of femoral head–neck offset (large arrows in A, B) and superolateral chondrolabral separation (short arrows in A, B). Notice intralabral cysts (short arrows in C, D), anteroinferior paralabral cyst (long arrow in D) and superolateral acetabular cartilage full-thickness defects with subchondral sclerosis.
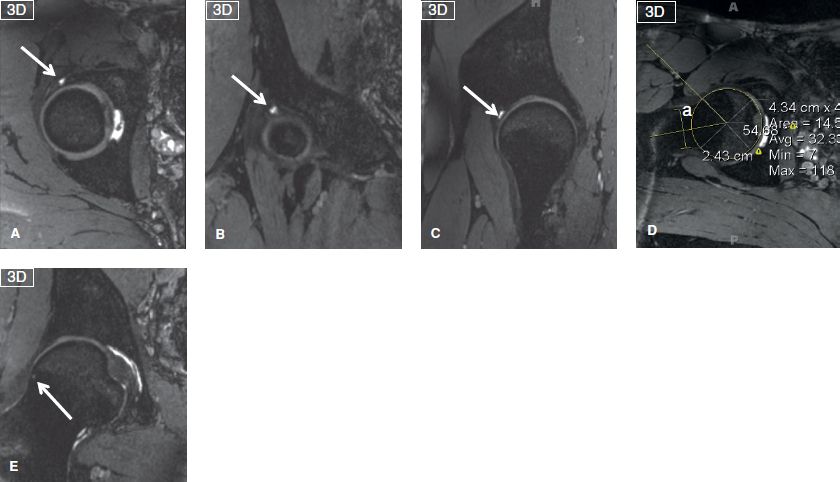
Fig. 9: Mixed (cam- and pincer-) type femoroacetabular impingement. Reconstructions in axial (A), coronal (B), and sagittal (C) planes from a three-dimensional isotropic steady state sequence show femoral head overcoverage, along with a intralabral cyst of the anterosuperior labrum (arrows). Reconstruction in oblique axial plane (D) shows an alpha angle measurement (a = 55 degrees). Another reconstruction in the coronal plane (E) exhibits the fibrocystic change (arrow) of the femoral head and neck junction.
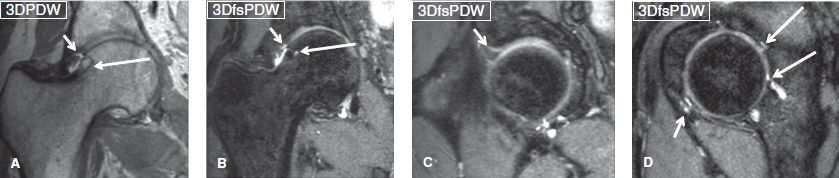
Fig. 10: Mixed (cam- and pincer-) type FAI on 3D isotropic spin-echo PDW and fsPDW images. Notice sharp definition of the superolateral chondrolabral separation (short arrows) and fibrocystic change with bump (long arrows) in coronal images (A) and (B). Sagittal images (C, D) show additional anterosuperior chondrolabral separation (short arrow in C), anteroinferior labral tear with intra- and paralabral cyst (short arrow in D) and full-thickness cartilage defects (long arrows in D) with multiple subchondral cysts.
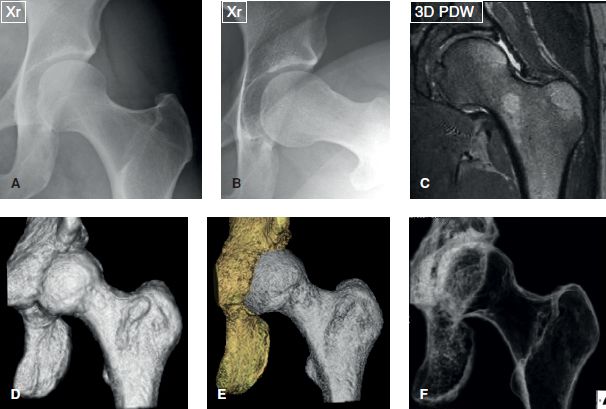
Fig. 11: Radiographs (A, B), respective coronal 3D MR image (C) and 3D models generated from the isotropic 3D PDW sequence show the bone modeling in various contrast renderings, producing opaque and radiolucent Xray type views.
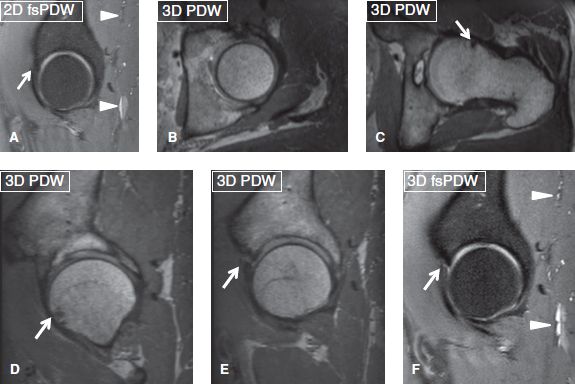
Fig. 12: Two-dimensional versus three-dimensional MRI: 2D coronal image: No labral tear seen. Isotropic 3D PDW (B–E) and 3D fsPDW (F) reconstructions show no overcoverage (B), bump and fibrocystic change (arrows in C, D) as well as anterosuperior labral tear (E, F). Also note sharper posterior gluteal veins (arrowheads) on 3D image (F) compared to 2D image (A).
Surgeons that specialize in FAI operations may ask for other measurements on CT or MR imaging. The more common ones include, femoral neck-shaft angle, acetabular version and femoral version. The femoral neck-shaft angle is measured on a coronal slice or thick slab through the center of the femoral head between the lines through the center of the femoral neck and the proximal diaphysis. It normally measures 120–140 degrees. The acetabular version is measured on the axial image between the line joining anterior and posterior acetabular bony margins, and the line perpendicular to the plane of the ischial tuberosities. One should correct for the pelvic tilt. The normal measurements are 5, 10 and 15 degrees respectively, at 1:00, 2:00, and 3:00 positions, respectively. The femoral version is measured on the axial image between the lines coursing through the femoral neck and the horizontal. Internal rotation constitutes a negative angle. Next, draw a line between the posterior femoral condyles and the horizontal. External rotation at the knee constitutes a negative angle. Add the two angles.
A single or a combination of surgical procedures may be performed to treat FAI, including femoral head and neck bump resection (osteotomy), labral debridement and/or repair, acetabular chondroplasty, as well as acetabular and/or iliac rotational osteotomies. In the setting of a rim fracture, screw fixation of the acetabular rim should be performed to avoid post-operative acetabular undercoverage. In the postoperative setting, imaging will show sharply concave femoral neck from prior CAM resection, and focal deficiencies of the iliofemoral ligament and joint capsule. The labrum may show post-debridement free edge truncation and fibrocartilage formation at the healed cartilage site (Figs. 13, 14). The role of MR imaging is to assess the adequacy of neck debridement and residual bump, and to detect labral retears (fluid-like signal on fsPDW image, gadolinium imbibition in the labrum or chondrolabral junction, abnormal labral morphology, tear in a location that was previously absent before the surgery, and any progression of chondral loss or new cartilage defects), as well as new complications, including infection, and insufficiency fracture of the femoral neck or acetabulum.
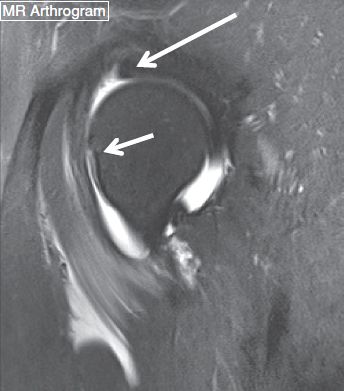
Fig. 13: Postoperative appearance of FAI correction surgery. Postsurgical follow-up sagittal MRA image demonstrates attenuated anterosuperior labrum (long arrow). Also note the normal appearance of the femoral osteotomy site (short arrow). No contrast imbibition in the labrum was seen on this postarthrogram image.
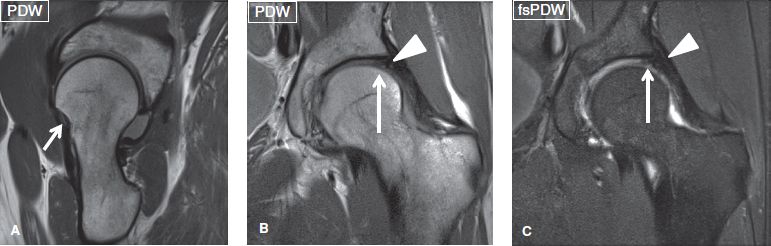
Fig. 14: Normal postoperative appearance. Post-FAI surgery and superolateral labral repair. Sagittal (A) image shows the femoral osteotomy site (small arrow). Coronal (B, C) images show the intact repaired labrum (arrowheads) and superolateral acetabular fibrocartilage formation (long arrows).
DYSPLASIA: [<None> <Shallow acetabulum / Labral hypertrophy>]
Similar to radiographs, developmental dysplasia of the hip can be diagnosed on coronal MR images by measuring the lateral center edge angle (Wiberg) as above. Shallow acetabulum is established when the angle is less than 19 degrees (19- to 25-degree borderline). One can also draw the acetabular angle, which is formed between the lines drawn horizontally through the superior aspect of both triradiate cartilages (Hilgenreiner’s line) and the superolateral bony edge of the acetabulum, with abnormal values exceeding 25 to 30 degrees. The angle should be measured on non-fs coronal images plane anterior to the fovea, where one sees obturator internus and externus muscles, otherwise the measurement may be falsely low (Fig. 15). In the dysplastic hip, the femoral head is located superiorly in the acetabulum, and the lateral aspect of the acetabular roof is oriented superiorly instead of inferiorly. The femoral head is normally 80% covered by the acetabulum. If more than 20% of the head is out laterally, it is called undercoverage, as observed in the dysplastic hips. If less than 10% is out, it means overcoverage (CE angle greater than 39 degrees), as can be observed in the setting of coxa profunda. In compensatory response to the increased load experienced by the front of the acetabulum, and to improve femoral head coverage and maintain joint lubrication, the labrum often undergoes developmental hypertrophy (and occasionally calcification or ossification and/or inversion), which predisposes it to impingement between the acetabulum and the femoral head, and subsequently further degeneration and tears. Additional soft tissue hypertrophy may be seen in the hyaline cartilage or the pulvinar fat pad. The condition leads to early degenerative joint changes and OA.
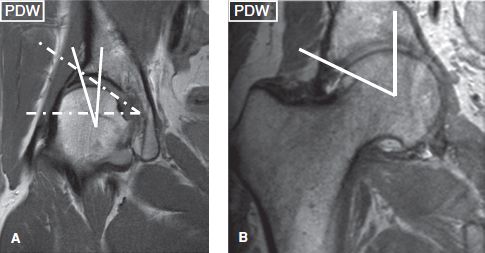
Fig. 15: Lateral center edge angle measurements. Dysplastic hip (A) versus overcoverage (B) show angles of 16 degrees versus 66 degrees, respectively. Notice abnormally high acetabular angle of 37 degrees (dashed lines in A).
MR imaging may detect unsuspected dysplasia, labral hypertrophy and/or tears (Fig. 16). It is also indicated in cases of unsuccessful hip reduction, to define the causative soft tissue component, such as an abnormal pulvinar fat pad, labrum intrusion, iliopsoas tendon interposition, and status of hyaline cartilage. In terms of prognosis, the chances of recurrent subluxations, chondral wear, and predisposition to AVN worsen with increasing levels of lateral uncovering (extrusion) of the femoral head (Fig. 17).
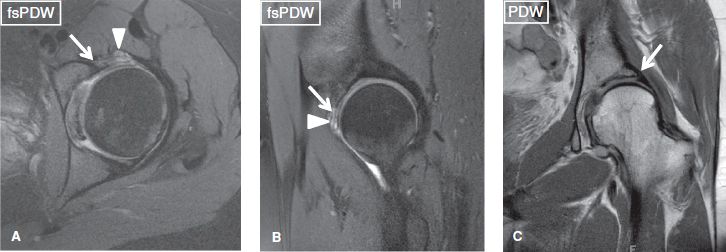
Fig. 16: Developmental dysplasia of the hip. Axial (A), sagittal (B), and coronal (C) images show a diffusely hypertrophied labrum (short arrows), which includes an intralabral cyst at its anterosuperior aspect (arrowheads). Notice underlying dysplastic hip with undercoverage of anterior femoral head.
Fig. 17: Developmental dysplasia of bilateral hips. Coronal (A) and axial (B, C) images exhibit bilateral shallow acetabuli and femoral head deformities, along with right dislocation and left femoral subluxation.
FLUID: [<Normal> <Small effusion / Moderate effusion / Large effusion> <Synovial hypertrophy>]
A small amount of synovial fluid is normally present in the hip joint. Joint effusion is diagnosed when fluid results in bulging of the joint capsule or its recesses, such that a bone to capsular distance exceeds 3 mm or when the latter distance is more than 2 mm asymmetric between the right and the left hips. Small, moderate, or large effusions are subjectively graded depending upon the distention of increasing number of recesses (inferior, posterior, or iliopsoas) (Fig. 18). Intra-articular strands or nodules of intermediate signal intensity are indicative of synovial thickening. Synovial thickening, debris, intra-articular cartilaginous (intermediate signal) or osteochondral bodies (dark ring with or without internal fatty marrow signal), synovial diverticula(e), and ganglion cysts should be reported, as they usually indicate underlying internal derangement. The bodies typically lodge in the inferior, posterior, or iliopsoas recesses. Numerous similar-sized bodies are seen in primary synovial osteochondromatosis and a small number of irregular-shaped bodies of variable size are seen in the secondary form of the disease. The latter is usually seen in older individuals and is associated with prior trauma or arthritis.
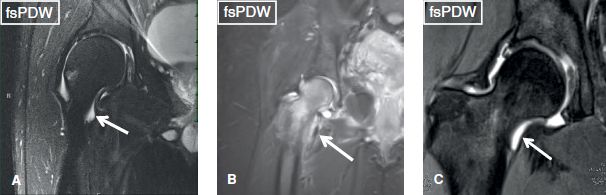
Fig. 18: Hip effusion. Coronal images demonstrate increasing degrees of capsular distention (arrows), indicating small (A), moderate (B), and moderate-to-large (C) effusion, respectively.
TROCHANTERIC BURSITIS: [<Absent / Present>]
Three distinct bursae exist around the greater trochanter: (a) The subgluteus medius bursa, which is located laterally and superiorly along the greater trochanter, immediately deep to the gluteus medius tendon muscle, (b) the subgluteus minimus bursa, which is situated anteromedial to the greater trochanter, deep to the superior aspect of the gluteus minimus tendon, and (c) the trochanteric bursa (or subgluteus maximus bursa), which is located along the posterior and lateral aspect of the greater trochanter and covers the insertion of the gluteus medius tendon. With repetitive frictional movements, chronic microinjury to tendons, or with acute trauma, one or more of the aforementioned bursae may become irritated, undergo inflammation, and fill with fluid with or without regional leakage. The bursitis is best depicted on axial or coronal images as fluid signal assuming either a crescentic shape with well-defined margins or an ill-defined configuration with a feathery shape infiltrating into the adjacent soft tissues (Figs. 19–22). Enhancement of the thin bursal wall is often seen after contrast administration as an asymptomatic finding. Trochanteric bursitis is often associated with gluteus medius and minimus tendinopathy and tears, most commonly with lateral facet insertional tears of the gluteus medius. One should look for tears of these tendons or underlying enthesopathy-related old bony avulsions. The bursitis can also been seen in the postoperative setting, particularly related to particle disease, metallosis, or pseudotumor formation (Fig. 23). Underlying bony findings include enthesopathy, avulsive bone marrow edema, or subcortical cystic changes of the trochanter. Trochanteric bursitis and/or gluteal tendinopathy may be responsible for chronic pain overlying the lateral aspect of the hip, in an entity known as the greater trochanteric pain syndrome. However, mild trochanteric bursitis, as well as T2 hyperintensity (and occasionally contrast enhancement) of the soft tissues lateral to the greater trochanter are found in up to 80% of asymptomatic individuals and should be correlated with the clinical symptoms, before attributing them to greater trochanteric pain syndrome. On the other hand, symptomatic subjects exhibit one or more of a combination of MR imaging findings of gluteal tendinopathy, tears of the gluteus minimus/medius tendons (so-called rotator cuff of hip), and regional peritendinous bone marrow or fascial edema.
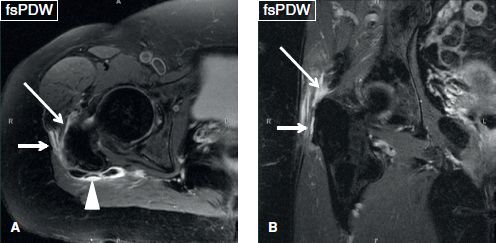
Fig. 19: Moderate trochanteric bursitis. Axial (A) and coronal (B) images reveal fluid collection within the subgluteus minimus (long arrows), subgluteus medius (short arrows), and subgluteus maximus (arrowhead) bursae.
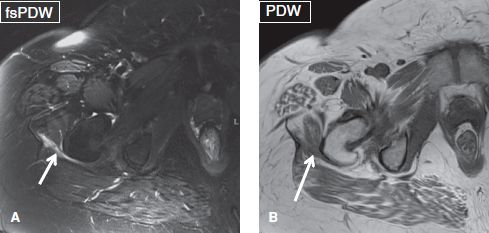
Fig. 20: Subgluteus maximus bursitis. Axial images (A, B) show small fluid collection (arrows) within the subgluteus maximus bursa.
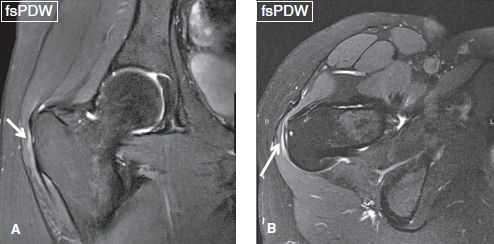
Fig. 21: Subgluteus medius bursitis. Coronal (A) and axial (B) images exhibit a trace amount of fluid within the subgluteus medius bursa (arrows).
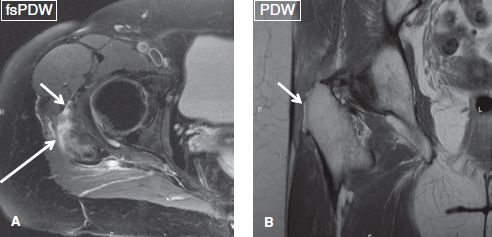
Fig. 22: Gluteus medius and minimus tendon tears with bursitis. Axial (A) and coronal (B) images demonstrate partial tears of gluteus medius (long arrow) and gluteus minimus (short arrows) along with moderate trochanteric bursitis. Notice underlying enthesopathy of the greater trochanter (arrow in B).
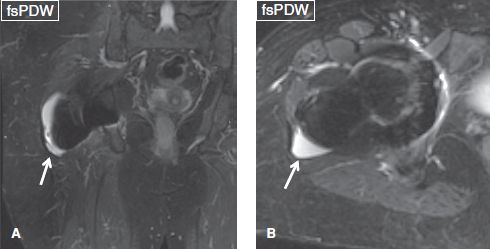
Fig. 23: Postsurgical trochanteric bursitis. Coronal (A) and axial (B) images show moderate fluid collection (arrows) in the trochanteric bursa in this patient with ipsilateral hip replacement.
LABRUM: [<Normal> <Degenerative fraying> <Tear> <Chondrolabral separation> <Paralabral cyst> <Labral ossification>]
The labrum is a fibrocartilaginous structure that is firmly attached to the osseous acetabular rim and overlies its hyaline cartilage, acting both as a static stabilizer, by maintaining negative intra-articular pressure and providing approximately 20% increase in articular surface. The labrum acts as a hyaline cartilage protective seal, keeping the joint fluid in the central compartment, thereby aiding in even the distribution of the compressive forces loading the articular cartilage. Inferiorly, the labrum blends with the transverse ligament at the margins of the acetabular notch, except for a small area where the two structures join and form a sulcus or recess, both anteriorly and posteriorly hosting a small amount of fluid (Fig. 24). The normal labrum is thinner anteriorly and thicker posteriorly, and demonstrates homogeneous low signal on all pulse sequences. It is usually triangular and less commonly round or flat shaped, with the apex pointing laterally. The superolateral and anterosuperior portions of the labrum are best visualized on the coronal images while the anterosuperior and posteroinferior portions are best evaluated on sagittal images. Axial images provide adequate evaluation of the anterior and posterior labrum. The normal recesses should be evaluated in all planes of acquisition before overcalling them as tears (Figs. 24–27).
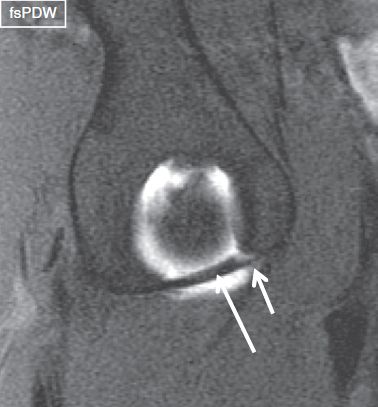
Fig. 24: Normal transverse ligament. Sagittal arthrography image demonstrates a normal transverse ligament (long arrow), bridging the anteroinferior and posteroinferior labrum. Notice normal synovial recess between the transverse ligament and the anteroinferior labrum (short arrow).
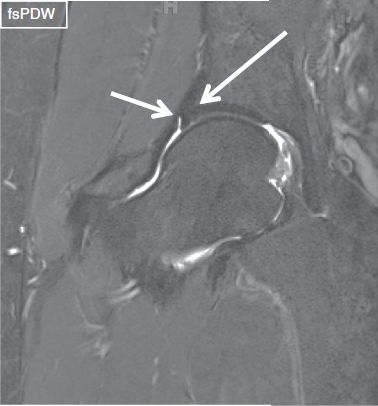
Fig. 25: Normal superolateral labrum and perilabral recess. Midcoronal image of the right hip shows a well-defined, triangular-shaped, and homogeneously hypointense superolateral labrum (long arrow). Note normal perilabral recess (short arrow).
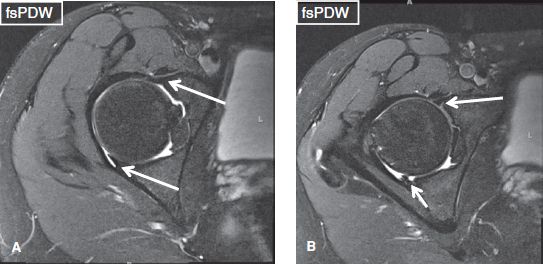
Fig. 26: Normal anterior and posterior labrum. Axial image (A) at the midlevel of the hip joint show well-defined, triangular-shaped, and homogeneously hypointense anterior and posterior labrum (long arrows). Axial image (B) shows a small anterior labral tear (long arrow). Short arrow in (B) exhibits the location of the normal recess at the posteroinferior labrum–transverse ligament junction.
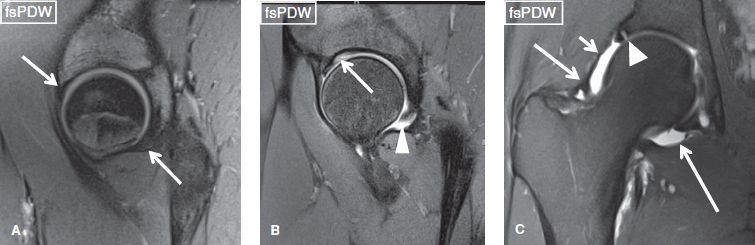
Fig. 27: Normal labrum. Sagittal (A, B) and coronal (C) images exhibit normal anterosuperior and posteroinferior labrum (arrows in A) under the iliofemoral and ischiofemoral ligaments, normal posteroinferior perilabral recess (arrowhead in B), and posterosuperior (arrowhead in C) sublabral recess. Notice normal cartilage undercutting the base of the labrum (arrow in B). C: Notice normal capsular thickenings, iliofemoral ligament (short arrow), zona orbicularis (medium arrow), and ischiofemoral ligament (long arrow).
In labral degeneration, the labrum demonstrates irregular fraying, attenuation or diffusely increased intrasubstance signal, which does not extend to the articular surface, similar to the meniscal tears. Occasionally, degeneration may be difficult to differentiate from a tear. Labral tears may be caused by acute trauma, FAI, degenerative disease, or capsular laxity. Their location can vary, for example, anterior, posterior, or superior (superolateral). The vast majority (>90%) of tears involve the anterosuperior labrum whereas tears of the posterior labrum are substantially less common and are usually associated with posterior instability, hip dislocation, pincer-type FAI, and underlying dysplasia. Labral tears are seen as (a) surface tears, appearing as linear fluid signal areas that extend to free edge or articular surface, or blunted labral margin (aka radial tear), (b) chondrolabral separation, which appear as focal or extended detachment of the labrum from the cartilage of the acetabulum (aka longitudinal peripheral tear). If it extends longitudinally from anterior to posterior similar to SLAP tear in shoulder, a linear high signal focus is depicted on true coronal images that is surrounded above and below by linear low signal (“reverse oreo cookie’’ sign), or it may be displaced to appear as flap tear or bucket-handle tear (Figs. 28, 29). Apart from the type of lesion characteristic, other features to report include the estimated length of the tear (small or large, e.g., less than or more than 1 cm), its location(s) either by defining the quadrant involved (anterosuperior, posteroinferior, superolateral, or anterior, etc.) or using a clock-face description, description of associated paralabral cysts, and any cartilage and bony changes, such as subchondral fracture (Fig. 30). Finally, describe any detached or displaced fragments.
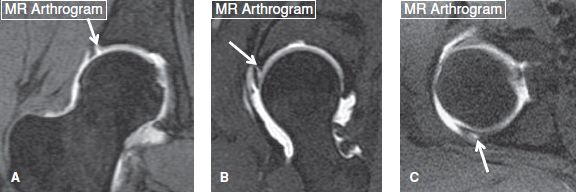
Fig. 28: Labral tears on MR arthrography. Coronal (A), sagittal (B), and axial (C) MRA images from different cases exhibit superolateral (arrow in A) and anterosuperior (arrow in B) chondrolabral separations, and posterior labral tear (arrow in C), respectively.
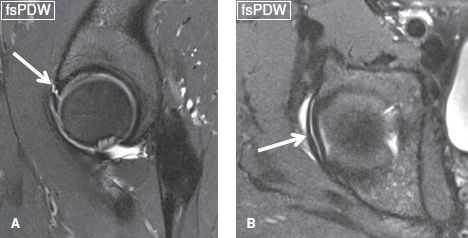
Fig. 29: Bucket-handle labral tear. Coronal (A) and axial (B) images show a complete longitudinal tear (arrows) along the superior labrum, anterosuperior to posterosuperior similar to a SLAP lesion in the shoulder with minimal displacement.

Fig. 30: FAI and associated hip joint abnormalities. Coronal (A, B), sagittal (C), and axial (D) images from the same individual show superolateral and anterosuperior labral tears (long arrows in A, C), a subchondral insufficiency fracture of the superior femoral head (short arrows in B, C), along with inadequate femoral head–neck offset with fibrocystic change (arrow in D), related to CAM-type femoroacetabular impingement.
Labral tears are commonly associated with intra- and paralabral cysts. These cysts confirm the presence of a tear and indicate that the tear has been around for some time. Occasionally, the labrum might show only degenerative fraying, truncation, or partial ossification adjacent to the paralabral cyst without demonstrable clear cut tear. These lesions appear as homogeneous well-circumscribed round or oval structures, usually multilocular, and show iso- to hypointense and hyperintense signal alterations on T1W and T2W images, respectively. The cysts can measure up to 4 to 5 cm in size, and infrequently feature intermediate signal appearance on T2W images due to gelatinous/mucinous material, debris or proteinaceous products (Figs. 3, 8, 31, 32). Long-standing paralabral cysts may cause adjacent bone erosion and form subcortical geodes. The differential diagnosis includes ganglion cyst unrelated to the labral tear, synovial diverticulum, perineural cyst traversing retrograde along innervating intra-articular branch of the adjacent sciatic or less commonly, femoral nerves sheath tumor, and iliopsoas bursitis. Differentiation between the iliopsoas bursitis and a labral tear is based on (1) the location of the lesion since paralabral cysts are usually lateral to the iliopsoas tendon whereas iliopsoas bursal fluid collections are located medial to the iliopsoas tendon, and (2) detection of direct communication of a paralabral cyst with the labral tear or intralabral cyst while iliopsoas bursitis communicates with the joint effusion. It should be noted that a paralabral cyst, if identified correctly, should always raise a strong suspicion of an underlying labral tear.
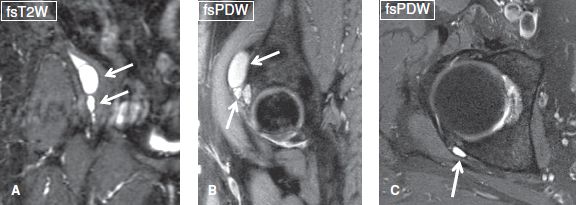
Fig. 31: Paralabral cysts. Coronal (A), sagittal (B), and axial (C) images show typical cases of different paralabral cysts (arrows).
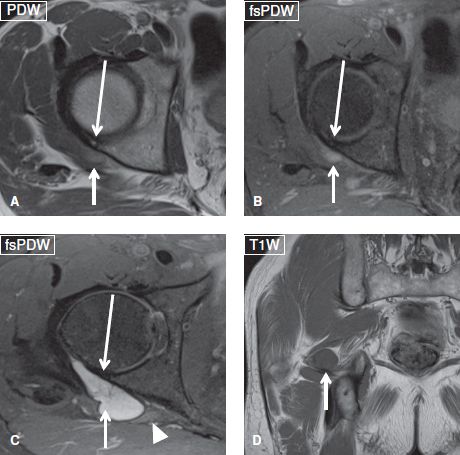
Fig. 32: Large paralabral cyst, asymptomatic. Axial (A–C) and coronal (D) images from the same individual show a large paralabral cyst (short arrows) with minimal degenerative change of the labrum and no clear cut tear (long arrows). The cyst displaces and compresses the sciatic nerve (arrowhead). The patient had no posterior symptoms and complained of anterior groin pain.
Several pitfalls should be avoided when establishing labral tears:
 The normal perilabral recess, which extends between the joint capsule and the capsular side of the labrum, most prominent on the coronal images (Fig. 25)
 The sublabral sulcus, which is located under the posterosuperior labrum in up to 18% of individuals and can be differentiated from a tear by its morphology (shallow, sharply marginated, linear in shape, and located posterosuperiorly, beyond 12 o’clock position in contrast to tears, which tend to be deeper, nonlinear, and are anterosuperior or superolateral)
 The labrum–transverse ligament recess, which forms at the junctions of the anteroinferior and posteroinferior labrum with the transverse ligament (Figs. 26, 27)
 Cartilage undercutting refers to mildly increased signal of the labrum–cartilage interface, similar to the glenoid labrum–cartilage interface in the shoulder, and it should not be misinterpreted for a tear since it has uniform intermediate signal and is present on nearly all sequences (Fig. 27)
 The iliopsoas tendon–labrum sulcus, which is created by the tendon as it crosses anterior to the labrum at 12 o’clock position on the axial image and creates a linear hyperintense interface with the latter that can mimic a tear
 Synovial diverticulum from prior capsular injury mimicking paralabral cyst, as the former features smooth margins, is at labrocapsular junction and is unilocular
 Enlarged or hypertrophied labrum in individuals with dysplastic hip (Fig. 16)
CARTILAGE:
Femoral: [<Normal> <Low-grade thinning / High-grade thinning> <Low-grade defects/ High-grade defects>]
Acetabular: [<Normal> <Low-grade thinning / High-grade thinning> <Low- grade defects/ High-grade defects>]
The horseshoe-shaped articular surface of the acetabulum is covered by hyaline cartilage, except (a) at the acetabular fossa, which extends from the central portion down to the acetabular notch, and is filled with fatty tissue, referred to as the pulvinar, (b) the stellate crease, a small bony indentation, which is located slightly superior to the acetabular fossa with an attached ligament (Fig. 33). Similarly, the femoral head is almost entirely covered by articular cartilage, except for a central area, known as the fovea capitis. The articular cartilage of the femoral head becomes thicker from the periphery to the center; whereas, the articular cartilage of the acetabulum becomes thicker from the center to the periphery, though they are both extremely thin, measuring only about 2 mm in thickness. The suprafoveal femoral head articular cartilage and the cartilage over the lateral acetabular dome are assessed primarily on coronal and secondarily on sagittal images whereas the anterior and posterior acetabular cartilages are best evaluated on the axial images.
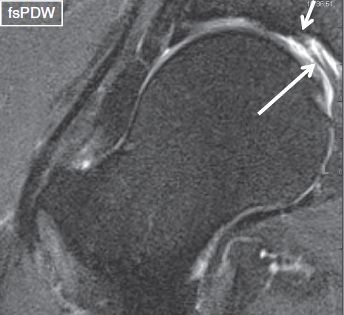
Fig. 33: Stellate crease. Coronal image demonstrates the acetabular fossa with the ligament (long arrow) and the superiorly located stellate crease (short arrow).
The normal cartilage demonstrates smooth surface and homogeneous intermediate signal intensity (darker toward the bone surfaces) on all pulse sequences. Defects appear as lesions where fluid signal replaces the normal intermediate signal, more commonly on the acetabular surface as compared to the femoral surface (Figs. 4, 5, 34–36). In FAI, anterosuperior or posteroinferior cartilages are more commonly eroded, as described above. In hip OA, there is multifocal or diffuse cartilage thinning or loss, which is again more prominent at the acetabular roof and superior surface of the femoral head. Cartilage delamination is seen as fluid-like signal undercutting the cartilage–bone interface (debonding of cartilage from bone) with or without buckling of the overlying cartilage. Similar to other joints, the evaluation of the cartilage should include the assessment of the size, location, and grade (low or high) of cartilaginous defects; the subchondral bone interface irregularity; and the subjacent marrow signal alterations of edema, cyst, and/or sclerosis.
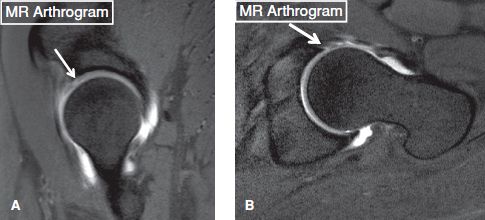
Fig. 34: Acetabular cartilage lesion. A: Sagittal MRA image shows a high-grade cartilage defect in the anterior superior aspect of the acetabulum (arrow). B: Oblique axial MRA image from the same patient demonstrates associated anterior labral tear (arrow).
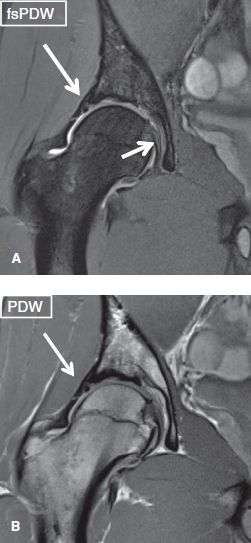
Fig. 35: Labro-cartilage lesion. Coronal images exhibit a high-grade cartilage fissure with associated superolateral labral tear (long arrows). Notice normal ligamentum teres (short arrow).
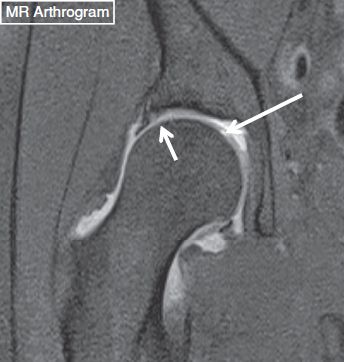
Fig. 36: Femoral articular cartilage flap. Coronal MRA image shows a high-grade cartilage flap (long arrow) of the femoral head. Also note a superolateral labral tear (short arrow).
CAPSULE/LIGAMENTS: [<Normal> <Thickened or sprained iliofemoral, ischiofemoral, or pubofemoral ligaments>]
The joint capsule attaches proximally along the osseous rim of the acetabulum and inserts near the base of the labrum, creating the perilabral recess. Distally, it attaches along the anterior aspect of the femoral neck at the base of the trochanters. Thickened layers of the joint capsule form three longitudinally oriented ligaments, which stabilize the joint, particularly during upright positioning or walking. These include the following.
 The triangular-shaped iliofemoral ligament, the strongest ligament of the body that extends from the ilium (between the anterior-inferior iliac spine and the superior border of the acetabulum) to the intertrochanteric line of the anterior femur and is best visualized transversely in the axial and axial-oblique planes and longitudinally in the sagittal plane
 The pubofemoral ligament, which attaches via a broad base on the iliopubic eminence, superior ramus of the pubis, obturator crest and membrane, extends inferolaterally to attach onto the intertrochanteric line and is best depicted on the sagittal images
 The spiral-shaped ischiofemoral ligament that arises from the inferior part of the ischium and attaches to the femoral neck, which is best depicted on axial and oblique-axial images (Fig. 27).
Injuries to the extracapsular ligaments are rarely reported in the absence of traumatic hip dislocation. Injury to the above ligaments usually occurs following hip dislocation or subtle subluxation (mostly in contact sport activities) and appears as ligament sprain and capsular edema (Fig. 37). Of the three ligaments, the iliofemoral ligament injuries are most commonly observed. Thickened iliofemoral and ischiofemoral ligaments may be normally seen in athletes or in symptomatic FAI subjects and it could potentially lead to decreased range of motion similar to adhesive capsulitis in the shoulder joint.
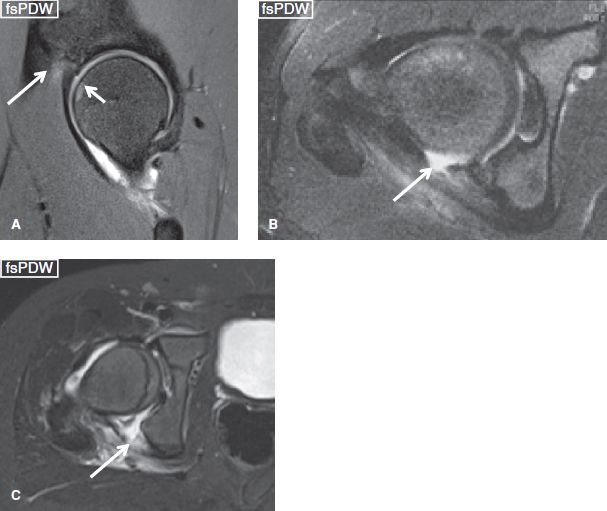
Fig. 37: Hip ligament sprains. Sagittal image (A) shows focal hyperintensity (long arrows) at the iliac insertion of the iliofemoral ligament in keeping with grade I sprain. Also note the underlying contusion (short arrow) of the femoral head from recent injury. Axial images (B, C) in two different subjects show grade III sprains of ischiofemoral ligaments from recent posterior hip dislocations.
Related posts:


Stay updated, free articles. Join our Telegram channel

Full access? Get Clinical Tree


