Abstract
Background
Isometric strengthening has been rarely studied in patients with coronary heart disease (CHD), mainly because of possible potential side effects and lack of appropriate and reliable devices.
Objective
We aimed to compare 2 different modes of resistance training, an isometric mode with the Huber Motion Lab (HML) and traditional strength training (TST), in CHD patients undergoing a cardiac rehabilitation program.
Design
We randomly assigned 50 patients to HML or TST. Patients underwent complete blinded evaluation before and after the rehabilitation program, including testing for cardiopulmonary exercise, maximal isometric voluntary contraction, endothelial function and body composition.
Results
After 4 weeks of training (16 sessions), the groups did not differ in body composition, anthropometric characteristics, or endothelial function. With HML, peak power output ( P = 0.035), maximal heart rate ( P < 0.01) and gain of force measured in the chest press position ( P < 0.02) were greater after versus before training.
Conclusion
Both protocols appeared to be well tolerated, safe and feasible for these CHD patients. A training protocol involving 6 s phases of isometric contractions with 10 s of passive recovery on an HML device could be safely implemented in rehabilitation programs for patients with CHD and improve functional outcomes.
1
Introduction
Physical activity is considered an effective non-pharmacological intervention for both primary and secondary prevention of coronary heart disease (CHD) . For the last 30 years, resistance training combined with aerobic endurance exercises has been an integral part of international recommendations for prevention and rehabilitation in patients with CHD and is now considered by the medical community as an essential part of exercise programs. Muscle mass and muscle strength decrease by about 30% between the third and sixth decades of life . With aging, the total number of muscle fibres decreases, especially fast-twitch muscle fibres, which are recruited during the development of force. In CHD patients, increasing muscle strength and function can help improve health features such as insulin resistance, endothelial function, and quality of life . As well, resistance exercise positively affects proprioceptive abilities, thereby leading to a gradual improvement in coordination and gait control, which reduces the risk of falls .
Unfortunately, the range of techniques or devices available to increase the efficacy of cardiac rehabilitation (CR) remains limited . Among new devices, the Huber Motion Lab (HML), a motorised rotating platform, seems to feature the qualities needed in such programs because it allows patients to perform exercises that simultaneously involve balance, coordination and strength training. In 2015, our team showed that exercise sessions with the HML, based on very short periods of exercise (6 s) at 70% of the maximal isometric voluntary contraction (MVC), interspersed with short periods of passive recovery were safe and well tolerated for selected patients with stable coronary disease . Moreover, a recent study showed that 8 weeks of training on the HML had a positive impact on body composition (especially decreased body fat), anthropometric data (reduced waist circumference), muscle performance (strength) and walking economy in healthy people .
HML training and traditional strength training (TST) have never been compared for efficacy in patients with CHD. We aimed to compare a conventional rehabilitation program associating global aerobic reconditioning with dynamic/segmental aerobic muscle strengthening and a program combining aerobic training and isometric exercises predominantly based on the HML in such patients.
2
Materials and methods
2.1
Patients
We recruited 50 patients with CHD from the cardiovascular rehabilitation centre of Saint Orens (France). Inclusion criteria were ≥ 70% arterial diameter narrowing of at least one major coronary artery and/or documented previous myocardial infarction. Exclusion criteria were recent acute coronary syndrome (≤ 1 month), significant resting electrocardiography (ECG) abnormality, severe arrhythmia, history of congestive heart failure, uncontrolled hypertension, bypass surgery ≤ 3 months, percutaneous coronary intervention ≤ 1 month, left ventricular ejection fraction ≤ 45%, pacemaker installation, modification of medication < 2 weeks, and musculoskeletal conditions making exercise on a cycle ergometer difficult or contraindicated. Patients provided written informed consent. The research protocol was approved by the Committee for the Protection of Human Subjects (Toulouse, France).
2.2
Study design
All patients were enrolled in an outpatient CR program (CRP). On the first and last visit, patients underwent a complete medical evaluation that included measurement of height, weight, body composition, resting ECG variables, endothelial function, muscular function, quality of life, quality of sleep, and fitness based on a maximal cardiopulmonary exercise test (CPET) performed on a cycle ergometer. After the first visit, patients were randomly assigned to the HML or TST group. The sole difference between groups was the strength training activity (HML or resistance training machines). The CRP focused on optimizing the medical treatment, controlling cardiovascular risk factors, diet monitoring, therapeutic education sessions and psychological support when needed.
The exercise program lasted 3 hr/day, 4 days/week. The daily activity training included 1) a 45-min strength training activity using machines (TST) or HML (HML group) and 2) a 45-min walking session outside or 45-min of cycling at the target heart rate determined during the stress test (i.e., 60–80% of the heart rate reserve) . Furthermore, the patients participated in relaxation sessions or aquatic relaxation sessions (45 min). Each session was monitored by a physiotherapist and was supervised by a cardiologist. In addition to the exercise protocol, patients were involved in therapeutic education sessions conducted by a multidisciplinary team with workshops and conferences on cardiovascular risk factors and treatment knowledge (∼3–4 hr/week).
2.3
Exercise sessions
2.3.1
Whole-body strength training with HML and assessment of MVC
The Huber Motion Lab (LPG Systems, France) is an oscillating platform with 2 large handles mounted on a movable column. Several feet and hand positions are marked on the platform and handles, respectively ( Fig. 1 ). HML exercises consist of adopting specific positions, defined as a combination of various foot and hand positions, and developing low-high force levels against the handles. These actions require the synergistic activation of various muscle groups of the lower limbs, trunk and upper limbs. The handles are equipped with strain gauges, and feedback about the force developed is provided to users. Additionally, an interactive interface, shown as a target, informs the subject about their ability to maintain the required force level. This “game-like” control panel is intended to increase the user’s motivation to practice and adhere to the HML training program .
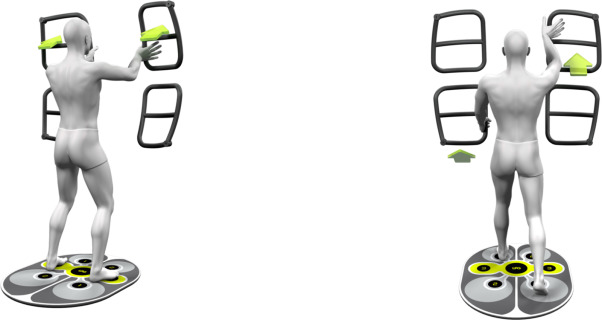
MVC was measured in standardized positions before each subsequent position ( Fig. 1 ). Patients were asked to exert maximal isometric pushing and pulling forces (i.e., opposite actions with the 2 hands on the handles). For each position, pulling and pushing forces were recorded by the strain gauges on the handles. Patients performed two 6 s MVCs for each position. A third trial was performed when the difference in results between the first 2 trials was > 5%. Verbal encouragement and visual feedback about the force developed were provided to patients during each MVC. The greatest mean force produced over the 6 s period was retained as the MVC value for each action (i.e., pulling and pushing force).
2.3.2
HML sessions
The velocity/inclination of the plate (rotation) was set at 30/30 (See HML instructions manual). Both exercises consisted of 6 exercise blocks in different postures. The positions are presented in Fig. 1 . Each block consisted of 8 contractions of 6 s alternating with 10 s of passive recovery, repeated twice. The total duration of the session, which included a 3-min warm-up, 10 min of MVC assessment, 27 min of exercise and 5-min recovery, was 45 min. The intensity of isometric contraction was set at 70% of the MVC . All patients performed a familiarization session in the days before the protocol. To validate and start the protocol, patients had to validate a coordination score corresponding to a minimum of 60% . Because the MVC was calculated at each session, the exercise intensity was automatically adapted to enable progression.
2.3.3
TST sessions and assessment of MVC
TST sessions involved a circuit training including 6 different machines: leg press, chest press, vertical traction (shoulder press), low row (working back), pectoral (butterfly) and leg extension. Movements allowed for dynamically working the same muscle groups as with the HML. According to the guidelines for resistance training in cardiac rehabilitation, we set the intensity at 60% of MVC. At each position, patients were asked to repeat 3 series of 12 repetitions. With TST, the MVC was calculated by using the one-repetition maximum test (1-RM) on each machine at the beginning of each week during the program.
2.4
Measures
Measures were recorded twice by a cardiologist, a physiotherapist and a nurse the day after admission (pre) and the evening before hospital discharge (post).
2.4.1
Anthropometric variables and body composition
The formula used for calculating BMI was weight in kilograms (kg) divided by height in meters (m) squared. The waist circumference was determined by use of a measuring tape (e.g., K & E type) placed halfway between the lower part of the ribcage and the hipbone . Body composition was measured by bioelectrical impedance by using the BODYSTAT 1500 (Bodystat Ltd., British Isles).
2.4.2
Endothelial function
Reactive hyperemia index (RHI), a measure of endothelial function, was assessed by using the EndoPAT 2000 device (Itamar Medical, Israel). This measurement was calculated by using a computerised automated algorithm provided with the accompanying software (v3.1.2) and performed according to the manufacturer’s instructions. Briefly, patients were in a supine position for a minimum of 20 min before measurement in a quiet, temperature-controlled (21–24 °C) room with dimmed lights. Patients were asked to remain as still as possible and silent during the entire measurement period. Each recording consisted of 5 min baseline measurement, 5 min occlusion measurement, and 5 min post-occlusion measurement (hyperemic period). Occlusion of the brachial artery involved the nondominant upper arm. The occlusion pressure was at least 60 mmHg above the systolic blood pressure (BP) (minimally 200 mmHg, and maximally 300 mmHg). The natural logarithmic scaled RHI (L_RHI) was calculated from the ratio between the digital pulse volume during RH and at baseline .
2.4.3
MVC
Patients were seated on the extremity of a bench. The bench was raised to ensure that the feet did not contact the floor. The knee joint tested was set in the gravity-neutral position. The thigh was strapped to the bench. The MVC of the quadriceps was tested by using a strain gauge system, the Meas FN3148 Load cell with mechanical stops (Measurement Specialities, Aliso Viejo, CA). This strain gauge has an accuracy of 0.05% and range of 0–2000 N. It is quality certified. Extremities of the strain gauges were attached to steel cables by hooks. One of the steel cables was attached to a bench hook and the other end to the ankle by use of a strap. The strain gauge and strap were set perpendicular to the line of force. Analogic strain gauge readings were transferred to software on a computer via a sensor interface. Once installed in the apparatus, patients, with their arms crossed over their chest, were asked to extend their knee as strongly as possible against the resistance of the cable steel for a contraction period with a 1 s transition period and a 4- to 5 s plateau that is supposed to be sufficient to achieve maximal isometric contraction. The time force motion was numerically registered and visualized during extension. The peak force was identified on the curve according to the reliability of the decision by 2 assessors. Three trials separated by 1-min rest intervals were proposed. The best peak force between the trials was recorded as the maximal force contraction of the quadriceps for the study. The same method was used in the chest press position to measure the strength of the upper body.
2.4.4
Cardiopulmonary stress test
The peak power output (PPO) was determined by a test on an ergocycle with electromagnetic braking (Ergometrics 900, Ergoline, Germany). The PPO corresponds to the power reached at the last threshold of the test. The initial power was set to 30 W with an increment of 15 W/min. This progressive increase test was performed with continuous 12-lead ECG monitoring. Blood pressure was checked every 2 min during the stress test and during 6-min recovery (3-min active recovery and 3-min passive recovery). The Borg scale was used to evaluate the rate of perceived exertion from 6 to 20 . The stress test was stopped when the patient was not able to maintain the required power or when the score of perceived exertion was 15–17/20, in case of severe angina pectoris (> 5/10), severe arrhythmia, decrease in BP >10 mmHg or ST-segment elevation > 2 mm . Metabolic equivalents (METs) were calculated from the Watts obtained at PPO, considering that 1 litre of O 2 = 5.05 Kcal and 1 MET = 3.5 mL O 2 /Kg body weight/min.
2.4.5
Quality of life
Health-related quality of life was measured by using the French version of the Medical Outcomes Study Short Form 36 (SF-36) . The SF-36 includes 36 questions grouped into 8 categories corresponding to physical activity, limits due to the physical state, physical pain, self-perceived health, vitality, relationships with others, psychological health and limits related to the psychological state. For each category, the sum of the item scores was translated linearly to a scale from 0 (maximal exhaustion) to 100 (no exhaustion). Physical activity, physical pain and limits related to the physical state reflect the physical component score (PCS), and self-perceived health, vitality, psychological health, relationships to others and limits related to the psychological state reflect the mental component score (MCS). PCS and MCS were computed by using equations developed by Ware and Kosinski .
2.4.6
Sleep quality
The Pittsburgh Sleep Quality Index (PSQI) assesses sleep quality during the previous month and differentiates “good” and “bad” sleepers . Sleep quality is a complex phenomenon that implies several dimensions, each analysed by the PSQI. This questionnaire includes 19 self-assessment questions and 5 questions asked of the life partner, spouse or roommate (as appropriate). The questions correspond to 7 components: subjective sleep quality, sleep latency, sleep duration, habitual sleep efficiency, sleep disturbances, use of sleeping medication, and daytime dysfunction. Only the self-assessment questions are included in the final score. Scores for the 7 components add to a final global score from 0 to 21 points, 0 meaning no sleep difficulty and 21 major difficulties. A global PSQI score > 5 suggests significant sleep disturbances.
Related posts:
 Vitamin D deficiency related to physical capacity during cardiac rehabilitation
Fixed-distance walk tests at comfortable and fast speed: Potential tools for the functional assessment of coronary patients?
Contemporary issues regarding nutrition in cardiovascular rehabilitation
Exercise training-induced modification in autonomic nervous system: An update for cardiac patients
High-intensity interval training in patients with coronary heart disease: Prescription models and perspectives
Assessment tools for personalizing training intensity during cardiac rehabilitation: Literature review and practical proposals
Vitamin D deficiency related to physical capacity during cardiac rehabilitation
Fixed-distance walk tests at comfortable and fast speed: Potential tools for the functional assessment of coronary patients?
Contemporary issues regarding nutrition in cardiovascular rehabilitation
Exercise training-induced modification in autonomic nervous system: An update for cardiac patients
High-intensity interval training in patients with coronary heart disease: Prescription models and perspectives
Assessment tools for personalizing training intensity during cardiac rehabilitation: Literature review and practical proposals
Stay updated, free articles. Join our Telegram channel

Full access? Get Clinical Tree


