Muscle degeneration in muscular dystrophies often includes a period of edema before fatty replacement of muscle tissue. Magnetic resonance imaging (MRI) has been used successfully to characterize muscle and fat patterns in several types of muscular dystrophies. Recent MRI techniques enable characterization of edema in tissues. This article reviews the advantages of using MRI assessment of edema and fat in muscle tissue to evaluate disease progression, and discusses inflammation and sarcolemma compromise as sources of edema in muscular dystrophy. Lastly, refining current techniques and adapting other MRI capabilities may enhance detection and assessment of edema for better evaluation of disease progression and treatment outcomes.
Numerous major forms of muscular dystrophy have been identified. The type of muscular dystrophy influences the progression of muscle degradation and the pattern of muscle involvement ( Table 1 ). An increasing number of defects in specific genes have been identified as the underlying cause of different forms of muscular dystrophy. Many of these genes encode for components of transmembrane and membrane-associated proteins that form a structural linkage between the F-actin cytoskeleton and the extracellular matrix in muscle. One example of this is the dystrophin–glycoprotein complex (DGC), an assembly of proteins that are organized into three subcomponents: the cytoskeletal proteins, sarcoglycans, and sarcospan. Several of the subtypes of limb girdle muscular dystrophy (LGMD) arise from primary mutations in genes encoding components of this complex. At least four sarcoglycan subunits (α, β, γ, and δ subunits) are present in muscle, and mutations here also result in a form of muscular dystrophy. Alpha laminin-2 (LAMA2) is a basement membrane protein and binds to β-dystroglycan. Mutations in the LAMA2 gene result in another form of muscular dystrophy.
| Type | Typical Age of Onset | Muscles Affected |
|---|---|---|
| Myotonic | 20–30 y | Facial, neck, forearm, cardiac |
| Duchenne | Childhood | Leg, pelvis, arm, shoulder, cardiac |
| Becker | 11–25 y | Leg, pelvis, arm, shoulder, cardiac |
| Limb-girdle | Childhood to adulthood | Shoulder, hip |
| Facioscapulohumeral | 15–40 y | Facial, shoulder, upper arm, leg |
| Congenital | Childhood | Generalized |
| Oculopharyngeal | 40–50 y | Eyelid, facial, throat, tongue, proximal limbs |
| Distal (Miyoshi) | 40–60 y | Forearm, hand, lower leg, feet |
| Emery-Dreifuss | 10–25 y | Upper arm, lower leg, shoulder, facial, cardiac |
Mutations in the dystrophin gene that result in a complete loss of dystrophin lead to the Duchenne muscular dystrophy (DMD) phenotype. Mutations that cause reduced amounts of dystrophin or a truncated, dysfunctional form of dystrophin result in the Becker muscular dystrophy (BMD) phenotype. Mutations in components of the DGC complex are thought to lead to a loss of sarcolemmal integrity and render muscle fibers more susceptible to activity- or exercise-induced muscle injury. The mechanisms of muscle injury are relatively well characterized in the dystrophinopathies (ie, DMD/BMD). In others, the genetic basis has only recently been described and the mechanisms of injury are yet to be elucidated (eg, production of the protein DUX4 in facioscapulohumeral muscular dystrophy [FSHD]). Furthermore, even though the genetic basis for a particular muscular dystrophy may be known, in some cases multiple genes or epigenetic modifications may modulate disease expression.
Despite the variation in the pattern and rate of muscular involvement, affected muscles follow a largely similar course of compromise in which the muscles begin to leak creatine kinase and take on excess calcium. The affected muscle fibers lose integrity, resulting in fiber degeneration and weakness. Ultimately, two primary paths result: shortening of the muscle fibers and tendons, leading to muscle atrophy; or replacement of muscle fibers with fat and connective tissue. Less affected or unaffected muscle groups may compensate with hypertrophy. During the course of muscle degeneration, multiple factors may modulate or influence the pathology seen, such as reversible injury, pseudohypertrophy (in which fat has replaced muscle to a degree that the tissue appears hypertrophied by gross examination), atrophy, and fatty replacement over time. These morphologic changes may be readily appreciated with MRI.
Progression of muscle change assessment with imaging
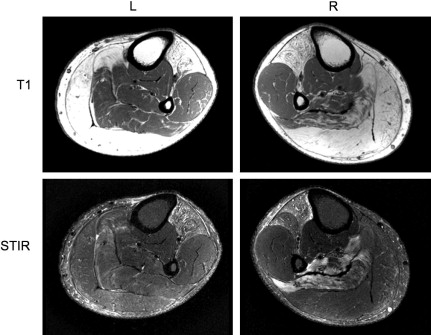
In most forms of muscular dystrophy the muscle cell membrane (sarcolemma) is weakened, making it susceptible to contraction-induced damage and loss of homeostasis. Over time, the muscles become progressively weaker as they are replaced by fat and connective tissue. The rate of progression, severity of changes, and pattern of involvement are related to the type of muscular dystrophy. Considerable phenotypic variation is common in many muscular dystrophies, such as in patients with FSHD ( Fig. 1 ). Although evaluation of disease progression can be assessed through muscle strength and function clinically, overlapping muscle function and compensatory hypertrophy limit this assessment, particularly in diseases with patterns of selective muscle involvement. Imaging assessment of muscle pathology has the advantage of independent evaluation of individual muscles and potential detection of pathologic changes not appreciable in functional tests. MRI in particular, with its sensitivity to soft tissue contrast and lack of ionizing radiation, has become the primary modality in soft tissue imaging and therefore has been increasingly applied to evaluation of muscular dystrophies.
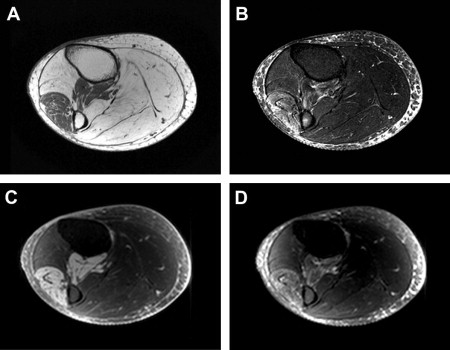
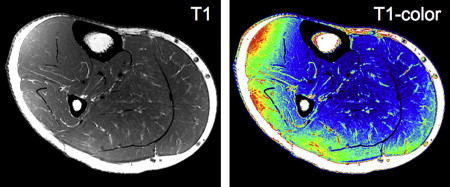
Standard MRI is based on the response of hydrogen atoms in a magnetic field to radiofrequency energy deposition (radiofrequency pulse). This radiofrequency pulse causes a perturbation alignment of the hydrogen atom spin. The hydrogen atom then gives off a radiofrequency signal as the spin relaxes back to baseline alignment in the magnetic field. Two types of relaxation behavior describe this return: T1 (longitudinal relaxation) and T2 (transverse relaxation), which are variably altered depending on the particular tissue microenvironment (as described in the later section on Quantitative Assessment of Muscle). The MRI acquisition parameters can be altered to produce T1-weighted or T2-weighted images ( Fig. 2 ). Furthermore, although standard MRI images are formed using the relative differences in signal intensity between tissues, imaging sequences can be used that allow calculation of the actual T1 and T2 relaxation rates (quantitative imaging). Finally, signal from fat can be suppressed using particular sequences, such as short-tau inversion recovery (STIR), because of T1 differences between fat and muscle. This fat suppression proves to be particularly useful in identifying excess fluid (edema) in many tissues (see Fig. 2 ). A further point, discussed in more detail later, is that STIR relies on the inversion and nulling of the fat signal, which may be variable in degree, influenced by magnetic field inhomogeneities, and may appear brighter near the margins in acquisitions using surface or phased array coils ( Fig. 3 ).
Other fat suppression techniques that rely on radiofrequency pulse tuned to fat signal are also used in some MR imaging sequences. However, adipose tissue may be composed of several types of fat with differing T1 and T2 values. Techniques that rely on fat-suppression pulses typically suppress the single large component (triacylglycerols ), with the assumption that the remaining signal will be fairly fat-free. Signal from other fat components may remain, which, through interaction, can lead to over- and/or underestimation of the measured signals, thus compromising the quantification of these features of tissue.
MRI can differentiate soft tissues and characterize edema, which is often seen in the course of changes between healthy muscle and the ultimate fatty replacement or atrophy typical of muscular dystrophies. Although the presence of edema is not specific to any one mechanism of muscle degeneration, it is seen at stages, for instance in both DMD and FSHD, and therefore potentially affords the ability to characterize a dynamic stage of injury, thereby serving as a marker of disease earlier in the disease process.
MRI images depend on the uniformity of the magnetic field, and surface coils are often used to enhance signal quality. If the magnetic field is susceptible to inhomogeneities, distortions can appear in the image. In addition, the variation inherent in surface coil sensitivity can produce artifacts near the outer edges of the image. In STIR images, these artifacts can look like edema.
Earlier imaging studies of the muscular dystrophies (DMD, BMD, LGMD) explored muscle involvement using low-field MRI. These typically used a semi-quantitative scale of qualitative images to assess muscle alteration ( Table 2 ), such as rating the extent of T1 signal hyperintensity in the muscle reflecting the presence of fat. Results showed that muscles in both the thigh (proximal) and calf (distal) were affected. No association with muscle fiber type (Type I or II muscle fibers) seemed to be predictive of the observed pattern of fat infiltration into the muscle. Observations of hyperintense signal on T2-weighted images led the authors to hypothesize that intramuscular water also increases with disease. A comparable MRI study found similar T1 and T2 changes in myotonic muscular dystrophy (MMD) and FSHD, while also detecting T2 hyperintensities, suggesting an increase in free water fraction.
| Grade 1 | Normal muscle signal intensity (homogeneous, hypointense signal, contrasting sharply with subcutaneous and intermuscular fat) |
| Grade 2 | Slightly hyperintense, patchy intramuscular signal changes |
| Grade 3 | Markedly hyperintense, patchy but widespread intramuscular signal changes |
| Grade 4 | Total, homogeneous hyperintense signal change in whole muscle, equaling the signal intensity of adjacent subcutaneous or paramuscular fat |
Patterns of muscle change in muscular dystrophy
DMD, as an example, presents with a pattern of edema and fatty changes in involved muscles similar to other muscular dystrophies. In DMD, a progression of general muscle changes in the legs are observed on MRI images:
- •
Patchy edema/inflammation in the hamstrings and quadriceps and gluteus muscles with sparing of the gracilis ( Fig. 4 ). These changes are accompanied by fat infiltration between muscles and a mild infiltration of fat within the gluteus muscles.
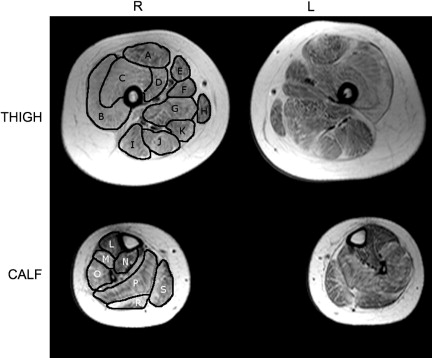
Fig. 4
Thigh and calf cross sections in a muscular dystrophy patient. Muscles in the right thigh are identified: (A) rectus femoris a ; (B) vastus lateralis a ; (C) vastus intermedius a ; (D) vastus medialis a ; (E) sartorius; (F) adductor longus; (G) adductor magnus; (H) gracilis; (I) biceps femoris (long head) b ; (J) semitendinosus b ; (K) semimembranosis b . Muscles in the right calf are identified: (L) tibialis anterior; (M) extensor digitorum longus; (N) tibialis posterior; (O) peroneus longus; (P) soleus c ; (R) lateral gastrocnemius c ; (S) medial gastrocnemius c . a muscles of the quadriceps; b muscles of the hamstrings; c muscles of the calf.
- •
Fatty infiltration that continues in the anterior thigh muscles (adductor magnus, rectus femoris, biceps femoris) with sparing of gracilis and sartorius. Fatty infiltration progresses to the gastrocnemius and soleus muscles, accompanied by edema/inflammation. Pseudohypertrophy is often present in the calf.
- •
In fatty-replaced muscle, atrophy can occur, whereas spared muscles may hypertrophy.
- •
For final stages, edema/inflammation diminishes and fatty replacement with fibrosis occurs in affected muscles.
A similar pattern of change is observed in BMD, although the changes are much milder with a protracted time course. In LGMD, early affected muscles are found in the hamstrings and calf, although subtypes of LGMD can vary greatly in the specific muscles involved. Likewise, in congenital muscular dystrophy (CMD) and Emery-Dreifuss muscular dystrophy (EDMD), distinct patterns of muscle features depend on the subtypes (eg, Ullrich CMD displays distributed involvement of posterior and lateral muscles in the thigh, sparing the gracilis, sartorius, adductor longus, and often rectus femoris; EDMD2 appears as moderate to severe vastus lateralis and intermedius in the thigh and medial gastrocnemius in the calf, whereas the recessive X-linked EDMD has minimal thigh involvement, with the soleus affected in the calf). Although variation in clinical and functional impairment among patients can make the task of pattern definition imprecise, a unifying theme to all types of muscular dystrophy seems to be the presence of edema that likely progresses to fatty replacement, suggesting that, opposed to mere fat/muscle ratios, detailed evaluation of edematous changes might be most useful in characterizing evolving changes.
Although not often the focus of published work, examples of edema are seen in a range of muscular dystrophies. For example, muscle changes in MMD show compartmentation (muscle/edema/fat), with the tibialis anterior, soleus, and gastrocnemii displaying MRI abnormalities (edema-like abnormalities, fatty infiltration, atrophy), whereas the tibialis posterior was least affected. STIR images showed the tibialis anterior, extensor hallucis longus, and flexor hallucis longus to have edema-like abnormalities, whereas the medial gastrocnemius and soleus experienced the most atrophy, with less atrophy apparent in the tibialis anterior, flexor hallucis longus, and extensor hallucis longus. The authors suggested that the edema-like presentation could indicate muscle degeneration, and may serve as a useful biomarker of muscles on the path to degeneration. Likewise, in distal muscular dystrophy, myoedema was observed to occur first, followed by fatty replacement.
A study of changes specific to leg muscles in FSHD showed that posterior leg muscles are infiltrated by fat (hamstrings, gastrocnemii, and soleus) and resemble pseudohypertrophy in these muscles. Not uncommonly, some asymmetry exists in the pattern of affected muscles, as shown in Fig. 1 . Clinically in patients with FSHD, foot drop is often noted as one of the first functional deficits in the legs, reflecting loss of strength changes in the tibialis anterior, yet these authors noted that in imaging studies, the proximal muscles (hamstrings) were affected before distal muscles. Other imaging studies have noted a similar proximal to distal severity of muscle involvement in the lower extremities. An earlier study noted that fat replacement was more apparent at the myotendon junction than in the muscle belly. Recently investigators suggested that within a muscle, disease progression occurs from distal to proximal, and this is supported in the figures presented in another study. These findings support an overall progression of muscle involvement that generally occurs proximally to distally, although specific muscles clearly can also be affected without such a strict gradient of involvement. Locally within individual muscles, the tissue alterations seem to occur from the distal to the proximal end. Verification of this hypothesis in the lower extremity would require full leg imaging in a longitudinal study, a goal that may be worthwhile to pursue in a range of dystrophies.
A recent review that described the general patterns of disease progression in a range of neuromuscular diseases illustrates the usefulness of MRI in evaluating muscle changes. As a subset of conditions explored, muscular dystrophies were evaluated as discussed later, with T1 and STIR sequences used to identify fat and edema. However, as noted, STIR brightness can be caused not only by muscle edema secondary to necrosis, inflammation, or trauma but also as a result of muscle denervation. Thus, the term edema-like is preferred by some, because the cause of the STIR brightness is nonspecific. A growing number of studies have attempted quantitative methods to evaluate edema and fat fractions in muscular dystrophies, discussed in more detail later. The fundamental advantage of focusing on edema is that it may be the earliest indicator of compromised muscle. Although other quantitative methods focused on fat may be useful in evaluating general disease burden, these methods have confounds for detecting edema.
Patterns of muscle change in muscular dystrophy
DMD, as an example, presents with a pattern of edema and fatty changes in involved muscles similar to other muscular dystrophies. In DMD, a progression of general muscle changes in the legs are observed on MRI images:
- •
Patchy edema/inflammation in the hamstrings and quadriceps and gluteus muscles with sparing of the gracilis ( Fig. 4 ). These changes are accompanied by fat infiltration between muscles and a mild infiltration of fat within the gluteus muscles.
Fig. 4
Thigh and calf cross sections in a muscular dystrophy patient. Muscles in the right thigh are identified: (A) rectus femoris a ; (B) vastus lateralis a ; (C) vastus intermedius a ; (D) vastus medialis a ; (E) sartorius; (F) adductor longus; (G) adductor magnus; (H) gracilis; (I) biceps femoris (long head) b ; (J) semitendinosus b ; (K) semimembranosis b . Muscles in the right calf are identified: (L) tibialis anterior; (M) extensor digitorum longus; (N) tibialis posterior; (O) peroneus longus; (P) soleus c ; (R) lateral gastrocnemius c ; (S) medial gastrocnemius c . a muscles of the quadriceps; b muscles of the hamstrings; c muscles of the calf.
- •
Fatty infiltration that continues in the anterior thigh muscles (adductor magnus, rectus femoris, biceps femoris) with sparing of gracilis and sartorius. Fatty infiltration progresses to the gastrocnemius and soleus muscles, accompanied by edema/inflammation. Pseudohypertrophy is often present in the calf.
- •
In fatty-replaced muscle, atrophy can occur, whereas spared muscles may hypertrophy.
- •
For final stages, edema/inflammation diminishes and fatty replacement with fibrosis occurs in affected muscles.
A similar pattern of change is observed in BMD, although the changes are much milder with a protracted time course. In LGMD, early affected muscles are found in the hamstrings and calf, although subtypes of LGMD can vary greatly in the specific muscles involved. Likewise, in congenital muscular dystrophy (CMD) and Emery-Dreifuss muscular dystrophy (EDMD), distinct patterns of muscle features depend on the subtypes (eg, Ullrich CMD displays distributed involvement of posterior and lateral muscles in the thigh, sparing the gracilis, sartorius, adductor longus, and often rectus femoris; EDMD2 appears as moderate to severe vastus lateralis and intermedius in the thigh and medial gastrocnemius in the calf, whereas the recessive X-linked EDMD has minimal thigh involvement, with the soleus affected in the calf). Although variation in clinical and functional impairment among patients can make the task of pattern definition imprecise, a unifying theme to all types of muscular dystrophy seems to be the presence of edema that likely progresses to fatty replacement, suggesting that, opposed to mere fat/muscle ratios, detailed evaluation of edematous changes might be most useful in characterizing evolving changes.
Although not often the focus of published work, examples of edema are seen in a range of muscular dystrophies. For example, muscle changes in MMD show compartmentation (muscle/edema/fat), with the tibialis anterior, soleus, and gastrocnemii displaying MRI abnormalities (edema-like abnormalities, fatty infiltration, atrophy), whereas the tibialis posterior was least affected. STIR images showed the tibialis anterior, extensor hallucis longus, and flexor hallucis longus to have edema-like abnormalities, whereas the medial gastrocnemius and soleus experienced the most atrophy, with less atrophy apparent in the tibialis anterior, flexor hallucis longus, and extensor hallucis longus. The authors suggested that the edema-like presentation could indicate muscle degeneration, and may serve as a useful biomarker of muscles on the path to degeneration. Likewise, in distal muscular dystrophy, myoedema was observed to occur first, followed by fatty replacement.
A study of changes specific to leg muscles in FSHD showed that posterior leg muscles are infiltrated by fat (hamstrings, gastrocnemii, and soleus) and resemble pseudohypertrophy in these muscles. Not uncommonly, some asymmetry exists in the pattern of affected muscles, as shown in Fig. 1 . Clinically in patients with FSHD, foot drop is often noted as one of the first functional deficits in the legs, reflecting loss of strength changes in the tibialis anterior, yet these authors noted that in imaging studies, the proximal muscles (hamstrings) were affected before distal muscles. Other imaging studies have noted a similar proximal to distal severity of muscle involvement in the lower extremities. An earlier study noted that fat replacement was more apparent at the myotendon junction than in the muscle belly. Recently investigators suggested that within a muscle, disease progression occurs from distal to proximal, and this is supported in the figures presented in another study. These findings support an overall progression of muscle involvement that generally occurs proximally to distally, although specific muscles clearly can also be affected without such a strict gradient of involvement. Locally within individual muscles, the tissue alterations seem to occur from the distal to the proximal end. Verification of this hypothesis in the lower extremity would require full leg imaging in a longitudinal study, a goal that may be worthwhile to pursue in a range of dystrophies.
A recent review that described the general patterns of disease progression in a range of neuromuscular diseases illustrates the usefulness of MRI in evaluating muscle changes. As a subset of conditions explored, muscular dystrophies were evaluated as discussed later, with T1 and STIR sequences used to identify fat and edema. However, as noted, STIR brightness can be caused not only by muscle edema secondary to necrosis, inflammation, or trauma but also as a result of muscle denervation. Thus, the term edema-like is preferred by some, because the cause of the STIR brightness is nonspecific. A growing number of studies have attempted quantitative methods to evaluate edema and fat fractions in muscular dystrophies, discussed in more detail later. The fundamental advantage of focusing on edema is that it may be the earliest indicator of compromised muscle. Although other quantitative methods focused on fat may be useful in evaluating general disease burden, these methods have confounds for detecting edema.
Related posts:
 Safety Concerns and Multidisciplinary Management of the Dysphagic Patient
Patient Safety in Cancer Rehabilitation
The Utility of Electromyography and Mechanomyography for Assessing Neuromuscular Function: A Noninvasive Approach
Cardiac MRI in Muscular Dystrophy: An Overview and Future Directions
New Opportunities and Novel Paradigms to Support Neuromuscular Research
Neuromuscular Ultrasonography: Quantifying Muscle and Nerve Measurements
Safety Concerns and Multidisciplinary Management of the Dysphagic Patient
Patient Safety in Cancer Rehabilitation
The Utility of Electromyography and Mechanomyography for Assessing Neuromuscular Function: A Noninvasive Approach
Cardiac MRI in Muscular Dystrophy: An Overview and Future Directions
New Opportunities and Novel Paradigms to Support Neuromuscular Research
Neuromuscular Ultrasonography: Quantifying Muscle and Nerve Measurements
Stay updated, free articles. Join our Telegram channel

Full access? Get Clinical Tree


