Neuromuscular ultrasonography can be used both descriptively and quantitatively in the evaluation of patients with neuromuscular disorders. This article reviews the quantitative use of this technology, particularly measurements of the size and echogenicity of nerve and muscle, as a tool for assessing the severity, progression, and response of these tissues to therapeutic interventions. Neuromuscular ultrasonography has several features, including portability and noninvasiveness, that make it an attractive research tool for advancing the diagnosis and treatment of neuromuscular disorders.
There is an inherent conflict between interpreting ultrasound imaging, which generates rich, highly textured complex representations of 3-dimensional space, and the rendering of these images into discrete measures for statistical analysis Reducing images to a small set of numbers, by necessity, ignores vast amounts of useful data, but the process is a prerequisite for generating objective information that can be shared by the clinical community. This article illustrates how ultrasound imaging is used in quantitative ways. The goal is not to supplant or diminish the importance of descriptive findings but to make the field amenable to statistical methods and standards for making diagnoses and designing therapeutic trials of new interventions. The discussion focuses first on muscle ultrasonography, a technique that was developed more than a decade earlier than nerve ultrasound, to illustrate key elements in determining how to best extract quantitative information from complex images. The discussion then applies some of these same principles to the study of 2 common nerve disorders.
Muscle ultrasonography
Size Measurements
Conceptually, the simplest way to identify muscle is to measure its size. All ultrasound instruments are equipped with electronic calipers so that once a muscle is imaged, its boundaries can be identified and measured. However, there are several caveats :
(1) In the relaxed state, the muscle is compressible and even slight pressure on the transducer can lead to significant changes in measured thickness. A commonly used effective strategy is to place the transducer on the muscle with ample gel, optimize the image, and then use the minimal pressure required to not lose transducer contact with the skin surface.
(2) Muscle dimensions vary with location, so selecting a reliable and consistent site for measurement is a prerequisite for obtaining normative data or for performing serial measurements over time. Bony landmarks, and fixed or proportional distances from them, are commonly used.
(3) Careful transducer management is required to ensure that the probe is held precisely in a parallel or transverse manner toward the muscle of interest so as for optimal size measurements and to ensure that the angle of insonation is perpendicular to the long dimensions of the muscle to ensure optimal echogenicity measurements.
(4) Muscle dimensions change with contraction/relaxation, so it is critical to ensure that the subject is cooperating for either full relaxation or contraction.
(5) Muscle blood flow increases significantly with even low levels of exertion, and this can influence measured size of the muscle ; typically patients are imaged after a brief period of rest. Muscle mass is largely composed of water (75%), and, because muscle represents a large portion of the body water reserve (30%), it may change with dehydration or fluid overload.
Several clinical studies, discussed later, have shown that the technical issues of muscle size measurements can be managed and that the technique is capable of providing useful information about muscle function and dysfunction. Using a series of simple questions, the following sections address the evidence that supports the value of ultrasound measurements of muscle size.
Are ultrasound measurements of muscle size reliable?
The studies that have looked at the test-retest reliability of muscle thickness and cross-sectional area show that there is a correlation coefficient of 0.98 to 0.99 and a correlation of 0.99 with magnetic resonance imaging (MRI) measurements of muscle. Because of the way ultrasonography processes speed of sound, which is slightly faster in muscle than average human tissue, the technique may consistently underestimate muscle thickness by a few percentage points, but, because this underestimate is invariant and directly related to measures obtained by MRI, its significance is moot.
Can ultrasonography accurately quantify changes in muscle thickness with activation?
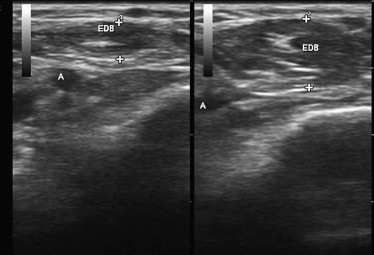
There are several simple ways to evaluate the ability of ultrasonography to measure variations in muscle thickness. The simplest is to show that it can measure changes in muscle size and shape in response to muscle contraction. This has been well documented in published studies and is easily demonstrated by imaging any muscle in the relaxed and contracted state ( Fig. 1 ).
Is ultrasonography capable of demonstrating an increase in muscle size with exercise?
A somewhat greater test of the utility of ultrasonography as a tool for measuring muscle size derives from studies that evaluate the effect of exercise. Ultrasonography proves to be a reliable and valid method for measuring the hypertrophy of muscles in the extremities, pelvic floor, and diaphragm that results from formal exercise programs. Four illustrative studies ( Fig. 2 ) are worth reviewing in more depth. Downey and colleagues studied the response of diaphragm thickness to inspiratory muscle training exercises in healthy young adults. After 8 weeks of training, which involved deep breathing against large inspiratory loads, diaphragm thickness increased by 10% and inspiratory muscle strength increased 25%. Enright and colleagues showed a similar improvement in diaphragm thickness in healthy controls and also showed an almost 20% increase in diaphragm thickness in adults with cystic fibrosis after this same type of training. In healthy controls, even an exercise program of biceps curls and sit-ups can lead to significant increases in diaphragm thickness. In all studies, there was improvement in a variety of other measured parameters of pulmonary function in tandem with the changes seen on ultrasonography.
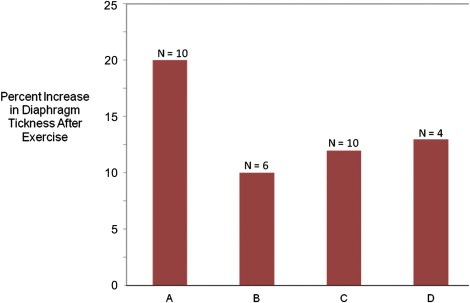
Fujiwara and colleagues showed that heel-raising exercises in elderly women significantly increased gastrocnemius (6%) and soleus (12%) thickness, and McNee showed that strength training in children with cerebral palsy increased the volume of the medial and lateral gastrocnemius muscles by about 15%. As such, it is clear that exercise training, in healthy young and old controls and diseased individuals, leads to increased muscle thickness and improves measures of strength and function. However, studies have yet to confirm significant effects of exercise on neuromuscular disease outcomes. So, although ultrasonography is a valid way to measure direct effects of exercise on muscle size, establishing this measure as a marker of clinical benefit requires additional studies. The link seems likely, and, given its ease of use and availability, confirmatory studies can be performed without undue expense or delay.
Can muscle ultrasonography measure loss of muscle size with disuse?
Another way to evaluate the usefulness of muscle ultrasonography is its ability to assess loss of muscle mass in nonneuromuscular conditions commonly associated with atrophy. Kawakami and colleagues used ultrasonography to show that muscle mass in the lower extremities decreased significantly (3%–4%) after 20 days of strict bed rest in healthy controls. Reid and colleagues showed that muscle thickness decreases even more rapidly in critically ill patients, 1.6% per day. Triandafilou and Kamper showed that ultrasonography sensitively detects the loss of muscle mass in the affected hands of patients who have had a stroke and that this loss significantly exceeds the difference of muscle sizes expected between dominant and nondominant hands.
Is ultrasonography capable of measuring the size differences of muscles between populations of children, seniors, and adult men and women?
Another test of the utility of muscle ultrasonography measures involves how well it assesses differences in muscle size in large populations of individuals. As adults grow older, there is an age-specific decline in muscle size, particularly in the quadriceps. This effect is muted in those who remain physically active in old age. Ultrasonography has proven to be a robust tool for demonstrating this effect in a more cost-effective manner than MRI. Similarly, ultrasonography confirms differences in the thickness of the dominant versus nondominant upper extremity and between men and women. Ultrasonography also shows the increase in muscle mass in children that occurs with maturation.
Is it possible to track progressive loss of muscle mass in chronic neuromuscular disorders?
A more direct test of the clinical relevance of muscle ultrasonography is its ability to track changes in muscle size in progressive neuromuscular diseases. Studies in large groups of patients with adult and childhood motor neuron disease and muscular dystrophy have used ultrasound to show that those with longer duration or severity of symptoms have smaller muscle size. Pseudohypertrophy of muscles occurs in some disorders such as Duchenne muscular dystrophy, a finding ultrasonography also readily quantifies. In addition to cross-sectional disease population studies, there are 2 recent smaller studies that show ultrasonography can be used to serially measure muscle size changes over time in patients with amyotrophic lateral sclerosis (ALS). Lee and colleagues showed that there was a statistically significant progression of muscle atrophy over time in patients with motor neuron disease in a sample of 3 muscles; however, in a larger sample of muscles in a greater number of patients, Arts and colleagues were unable to show a significant progression of atrophy in patients with ALS. Taken together, these studies provide evidence that ultrasonography has the potential for being a useful biomarker in neuromuscular disease, but, in ALS at least, further studies are needed to determine if this technique can be used as a surrogate end point for treatment outcomes. Ultrasonography can measure muscle size and its change over time, but the question remains if muscle loss in ALS is sufficiently distributed in multiple muscles and linearly progressive to be amenable to standard statistical calculations for estimating functional disability and disease severity.
Can ultrasonography measure the effect of drugs on causing either loss or enhancement of muscle thickness?
A final test of the usefulness of ultrasound measurements of muscle size is to assess its responsiveness to drug treatment. Hamjian and Walker, in a series of healthy controls, showed that muscle ultrasonography of the extensor digitorum brevis was a sensitive indicator of atrophy after small doses of botulinum toxin. In hemiplegic patients admitted to an intensive care unit, Moukas and colleagues showed that serial ultrasound measurements of muscle size could demonstrate an enhanced rate of atrophy in those treated with steroids and neuromuscular junction blockers. Candow and colleagues, in healthy exercising adults, showed that creatine supplementation significantly enhanced muscle thickness. Cardiac ultrasonography, a technique of considerable similarity to skeletal muscle ultrasonography, has been used to detect changes in heart muscle size in health and disease for many years. This technique is responsive to reductions in cardiac wall thickness in heart transplant recipients treated with sirolimus and to increases in wall thickness in patients undergoing hemodialysis treated with growth hormone. These findings show that ultrasonography is a measure that can detect bidirectional changes in muscle size in response to a variety of pharmacologic interventions in even fairly small samples of patients.
How promising are ultrasound measurements of muscle size as potential surrogate end points of disease severity?
It seems clear that ultrasonography is a useful technique for measuring muscle size and that this property has immediate diagnostic implications and the potential to be a useful tool for clinical decision making. This technique meets the requirements of a useful surrogate end point of neuromuscular disease as listed, in a simplified form, in Box 1 . Of 5 key variables that characterize an ideal surrogate end point, the cost and convenience of ultrasonography is self-evident in that it is noninvasive, painless, safe, and routinely available with just a modest amount of training. It is clearly valid from both a technical and clinical perspective. The technique is simple, reliable, and well standardized as a measure of tissue size. From a clinical perspective, atrophy is a robust manifestation of most neuromuscular diseases. Muscle size is known to correlate strongly with strength, a variable of clinical significance. Furthermore, normalization of atrophied muscles is almost a necessity for therapeutic intervention to work in a neuromuscular disorder; put another way, it would be difficult to envision a mechanism of action that would not involve increase in muscle size. Although not discussed in detail, the measurement precision of ultrasonography is quite good, with known standards of biological variation in the populations studied and straightforward image acquisition and measurement techniques. These are objective and amenable to central oversight if needed. Perhaps of greatest significance is that the studies demonstrate bidirectional responsiveness and sensitivity of ultrasound measurements of muscle size to a variety of diseases and the outcomes of diverse therapeutic interventions. However, to become fully acceptable as a surrogate end point, muscle ultrasonographic measurements of muscle size need to be validated in a pivotal clinical trial of therapeutic benefit. Because there are few currently meaningful therapies for progressive neuromuscular disorders, such validation likely will have to await the emergence of newer interventions.
- 1.
Validity (technical/clinical)
- 2.
Responsiveness to disease and treatment
- 3.
Measurement precision
- a.
Biological variation
- b.
Acquisition process
- a.
- 4.
Convenience; for example speed of use, portability, patient tolerance
- 5.
Cost
An ideal surrogate marker should identify a physiologic process on a direct pathway between treatment and outcome.
Echogenicity Measurements of Muscle
Another useful parameter to study muscle is ultrasound echogenicity. Healthy muscle tissue is normally echolucent or dark. Given the highly organized structure of muscle, sound mostly is transmitted through the tissue with reflections occurring primarily at sites of fibrous structures in the muscle, such as the vasculature, perimysium, and epimysium. However, in myopathies and neurogenic disorders, muscle tissue undergoes atrophy, necrosis, inflammation, fatty infiltration, and fibrosis. These changes set up multiple new planes of sound reflection in muscle, and, as a result, diseased muscle becomes progressively more echogenic, with loss of the normal heterogeneity of healthy muscle and its supporting fibrous stroma.
Measuring muscle echo intensity, however, is technically more complex than measuring muscle size. There is no set convention among ultrasound instrument manufacturers as to how to best display brightness, so the relationship between the brightness displayed on a screen and the actual intensity of reflected echoes varies somewhat from instrument to instrument, depending on proprietary software used by each manufacturer. In fact, there is no set standard for image contrast or brightness in the field. Sonographers may differ in their opinions on optimal brightness settings for performing certain types of diagnostic studies. The subjectivity of brightness settings is further limited by the absence of any good correlative measurement, other than microscopic anatomy, which, at best, provides an indirect correlation. Although muscle size as measured by ultrasonography is subject to comparisons of size as measured by other techniques, echo intensity measurements are only directly apparent by ultrasonography.
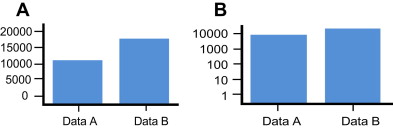
Further complicating the display of echogenicity is the nature of human visual perception. In general, the brightness of most objects depends largely on the extent of ambient illumination and fairly little with respect to the object perceived. An object’s perceived size, in contrast, is constant regardless of illumination. Studies of human perception have shown that size is cognitively coded in a linear manner. As such, even if a subject cannot tell the relative height in inches of 2 adjacent objects, they can give accurate estimates of their relative size. In contrast, brightness is coded cognitively in an exponential manner ; as such, the relative brightness of 2 objects is nonlinear and not easily appreciated in a quantitative manner. Using a standard oscilloscope display, amplitude mode (A-mode) ultrasonography can display the amplitude of an ultrasound signal precisely but only for the display of a single element from the multiple elements in a linear array transducer. Such 1-dimensional displays are of limited use and are impractical in modern imaging. Although necessary for tissue imaging, the use of brightness mode (B-mode) ultrasonography requires mapping amplitude as brightness. However, something is lost in translation because this conversion, from a perceptual perspective, involves displaying amplitude information on a log scale instead of a linear scale. Although difficult to characterize the impact of this translational shift, Fig. 3 helps to show the difference of expressing something on a linear versus a log scale. This subject is discussed in more detail elsewhere.
Further complicating the interpretation of ultrasound brightness is the number of operator-controlled parameters that alter echogenicity of a tissue. These parameters include time gain compensation, the angle of incidence of the transducer, and power and gain settings. Fortunately, these are manageable through careful technique, which includes standardized instrument settings, transducer positioning, and using the same instrument. However, such settings may be not be equivalent on different instruments, given the differences in proprietary display parameters. Alternatively, a somewhat more complex process involving backscatter analysis allows for comparison of data from different instruments. In either case, technical factors can be managed effectively to obtain useful data on echogenicity. One factor, however, which is a patient variable that is more difficult to control, is the variability of the sound-absorbing characteristics of superficial layers of tissue on the echogenicity of deeper layers. In practice, this variability does not seem to be particularly problematic in that most muscle imaging involves muscles fairly close to the surface and the variation present in most superficial tissue is minimal. However, excess subcutaneous edema, superficial fat, or hypertrophic skin disorders can distort echogenicity measurements and may play a significant role in the evaluation of certain groups of patients (eg, critically ill patients with pronounced edema).
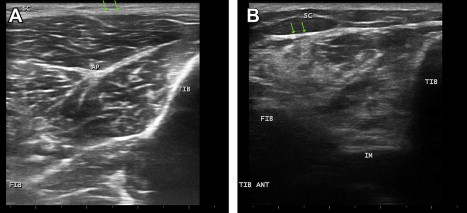
As would be expected, there are fewer studies that have measured echogenicity in neuromuscular diseases than studies that have measured muscle thickness. Nonetheless, increased echogenicity was recognized early as a key parameter in the diagnosis of chronic neuromuscular disease ( Fig. 4 ). The finding has been validated numerically using digital technology, descriptively and by qualitative rating scales scored by blinded investigators. At least as a diagnostic parameter, ultrasound echogenicity measurements of muscle provide added value.
Does increased echogenicity serve as a useful measure of disease severity?
In cross-sectional studies of groups of patients, there is some evidence to suggest that greater echogenicity is seen in more advanced forms of motor neuron disease or at least in disease of longer duration. The change of echogenicity over time has not been as well studied in human muscular dystrophy. However, in dystrophic mice, there is evidence to suggest that it might be a useful progressive disease biomarker. There is also evidence that increased echogenicity of muscle inversely correlates with survival in ALS. This effect is most pronounced when estimating the rate of change of echogenicity from baseline based on normal values and the known duration of symptoms. When looked at serially over 6 months in a group of 31 patients with ALS, however, the change in echo-intensity over time was too variable and inconsistent to track disease severity. As a marker of the presence of muscle disease, echogenicity is quite useful; however, as a marker of disease evolution or regression, the limited data available are unconvincing.
One potential problem with ultrasound echogenicity is its predicted responsiveness to disease therapy. There are concerns that changes in echogenicity may not be reversible even should patients improve from their underlying disorder. Because increased echogenicity results from fibrosis and fatty changes in muscle, it may be that changes in echogenicity are chronic and may not necessarily repair with clinical improvement. For example, old polio patients may have markedly asymmetric recovery from paraplegia. Ultrasound images from affected limbs, one that is flaccid and one that shows normal strength, may show virtually equal echogenicity. Further improvements in techniques for quantifying echogenicity may help in determining if ultrasonography can detect a reduction in preexisting echogenicity or forestall the progression of echogenicity in neuromuscular disorders undergoing effective therapy.
Muscle Dynamics
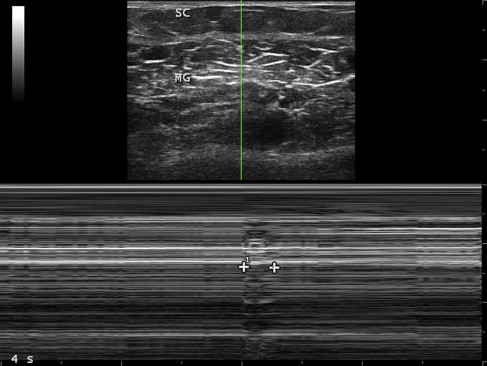
By its very nature, measuring movement is typically more complex than measuring findings on a still image, because movement involves measurements across multiple images. However, certain techniques can simplify such measurements. Motion mode (M-mode) imaging can capture movement on a single still image, such as the duration of a compound muscle action potential or fasciculation ( Fig. 5 ). Ultrasonography records the duration of a mechanical event, such as muscle contraction, whereas electromyography records the duration of a compound surface membrane potential, an electrical event that is far shorter.
Related posts:
 Safety Concerns and Multidisciplinary Management of the Dysphagic Patient
Patient Safety in Cancer Rehabilitation
The Utility of Electromyography and Mechanomyography for Assessing Neuromuscular Function: A Noninvasive Approach
Skeletal Muscle Edema in Muscular Dystrophy: Clinical and Diagnostic Implications
Cardiac MRI in Muscular Dystrophy: An Overview and Future Directions
New Opportunities and Novel Paradigms to Support Neuromuscular Research
Safety Concerns and Multidisciplinary Management of the Dysphagic Patient
Patient Safety in Cancer Rehabilitation
The Utility of Electromyography and Mechanomyography for Assessing Neuromuscular Function: A Noninvasive Approach
Skeletal Muscle Edema in Muscular Dystrophy: Clinical and Diagnostic Implications
Cardiac MRI in Muscular Dystrophy: An Overview and Future Directions
New Opportunities and Novel Paradigms to Support Neuromuscular Research
Stay updated, free articles. Join our Telegram channel

Full access? Get Clinical Tree


