Musculoskeletal Magnetic Resonance Imaging: Introduction
Magnetic resonance imaging (MRI) relies on the intrinsic spin of protons, each of which has a magnetic moment. Protons tend to align their magnetic poles along the direction of a magnetic field. When protons are placed in a magnetic field, they can also absorb and then reemit electromagnetic radiation in the form of radiofrequency signals. Nuclei absorb energy from radiofrequency pulses and may resonate. This resonance induces orientation to the magnetic field; the required frequency of the pulse is determined by the strength of the magnetic field and the chemical properties of the target.
When the radiofrequency signal is removed, absorbed energy is released. This energy can be recorded as an electrical signal that can be used to create images, with the strength of the emitted radiowave corresponding to the signal intensity of a given area. This intensity depends on the concentration of protons and the longitudinal and transverse relaxation times, which in turn depend on the properties of water molecules within the given tissue.
Two relaxation times are important for MRI. The T1 (longitudinal) relaxation time describes the return of protons back to equilibrium after a radiofrequency pulse. The T2 (transverse) relaxation time describes the loss of phase coherence between individual protons immediately after the pulse. Different pulse sequences can be used to enhance the differences between T1 and T2, thus creating image contrast. Sequences with short repetition times (TR) (ie, <800 msec) and short echo times (TE) (ie, <30 msec) are termed T1-weighted and provide good anatomic detail. Sequences with long TR (>2000 msec) and TE (>60 msec) are termed T2-weighted and are useful for evaluating pathology. Sequences with intermediate TR (>1000 msec) and short TE (<30 msec) are termed proton density sequences. These provide good anatomic detail with maximal signal-to-noise ratios, at the cost of impaired tissue contrast. In musculoskeletal imaging, suppression of fat signal can often be useful for evaluating pathology. Thus, using the short tau inversion recovery (“STIR”) technique, the effects of prolonged T1 and T2 relaxation times are cumulative, leading to the suppression of fat signal (“fat saturation”). Fat saturation can also be performed using frequency-selective (chemical) techniques that improve spatial resolution.
Faster imaging techniques such as gradient-recalled echo (GRE) have become popular because they shorten imaging time. With GRE, pulse sequences are performed using variable flip angles of less than 90 degrees, which shortens imaging time since the low flip-angle radiofrequency pulses destroy only a portion of the longitudinal magnetization with each pulse cycle. In musculoskeletal imaging, GRE sequences are useful for imaging ligaments, tendons, and cartilage.
The musculoskeletal system is ideally suited for evaluation by MRI because different tissues demonstrate different signal intensities on T1- and T2-weighted images. For example, fat displays high signal on T1-weighted images and intermediate signal on T2-weighted images. Air, cortical bone, ligaments, tendons, and fibrocartilage demonstrate low signal on both T1- and T2-weighted images. Fluid displays intermediate signal on T1-weighted images and high signal on T2-weighted images. Traumatic, inflammatory, and infectious disorders are therefore evaluated effectively by MRI, since these conditions typically result in edema and associated hyperintensity on T2-weighted images. Figures 65–1, 65–2, 65–3, 65–4, 65–5, 65–6, 65–7, 65–8, 65–9, 65–10, 65–11, 65–12, 65–13, 65–14, 65–15, 65–16, 65–17, 65–18, 65–19, 65–20, and 65–21 show MRI findings in various rheumatic conditions.
Figure 65–1.
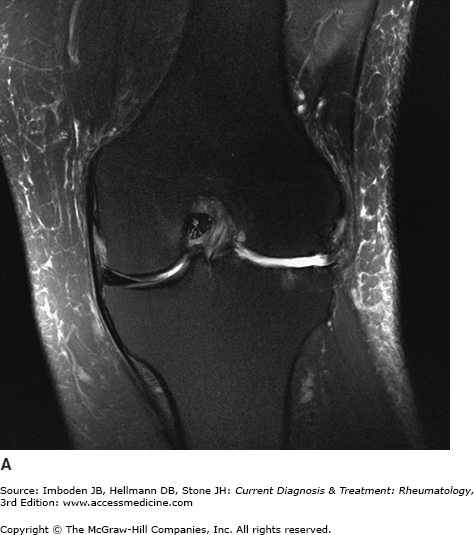
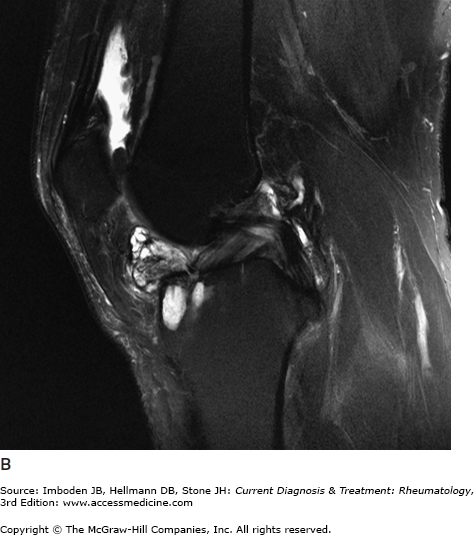
Osteoarthritis of the knee. Coronal T2 fat saturated (A) images of the knee demonstrate absence of the lateral meniscus with adjacent full-thickness cartilage loss, cortical irregularity, marrow edema, and marginal osteophytes. Sagittal images (B) demonstrate a lobulated parameniscal cyst in Hoffa fat pad arising from the extensively torn lateral meniscus. A degenerative cyst is also seen underlying the insertion of the anterior cruciate ligament on the tibia.
Figure 65–2.
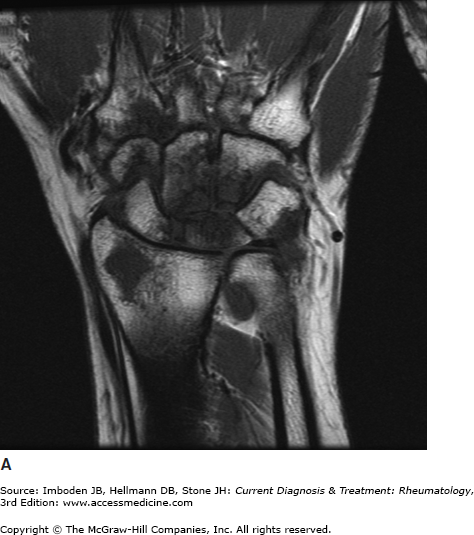
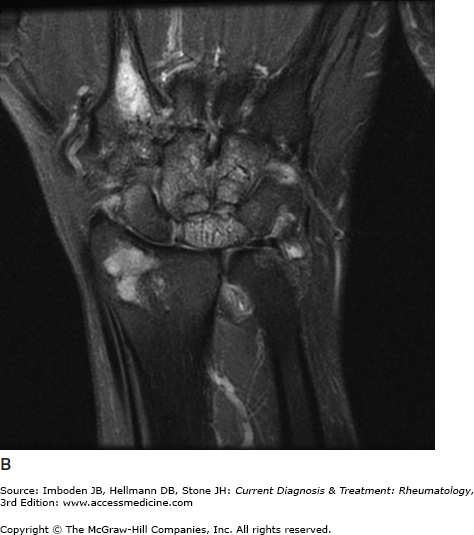
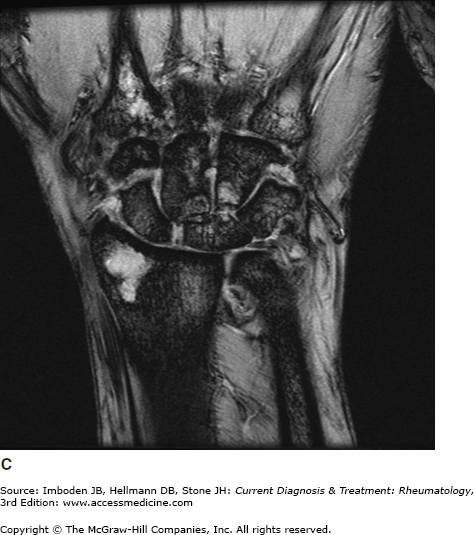
Rheumatoid arthritis of the wrist. Coronal T1 (A), T2 fat saturated (B), and gradient-recalled echo (GRE) (C) images of the wrist demonstrate diffuse cartilage loss throughout the carpal bones with joint-space narrowing, intraosseous cysts, and extensive marrow edema. Small periarticular cortical erosions are seen in the lunate.
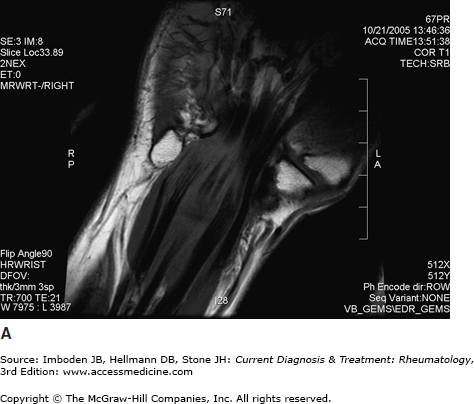
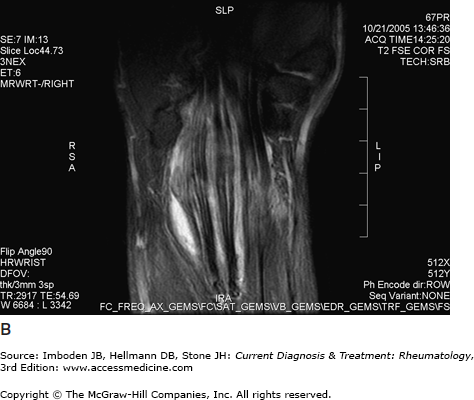
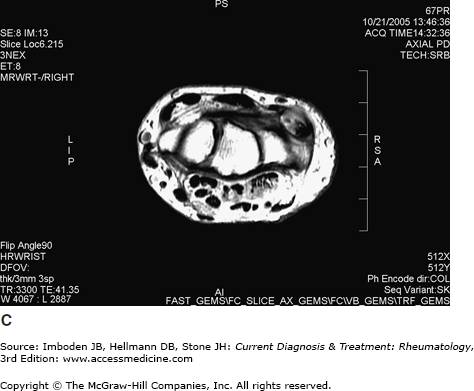
Figure 65–5.
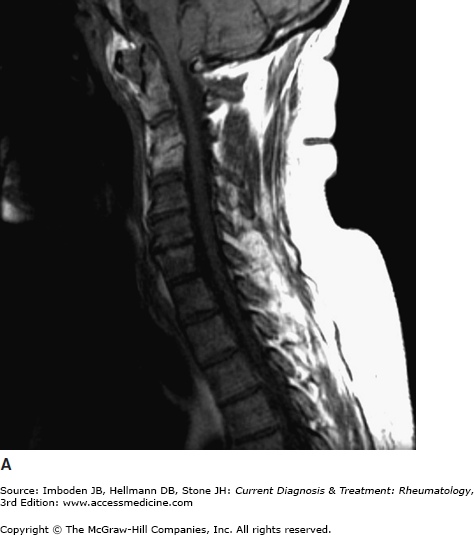
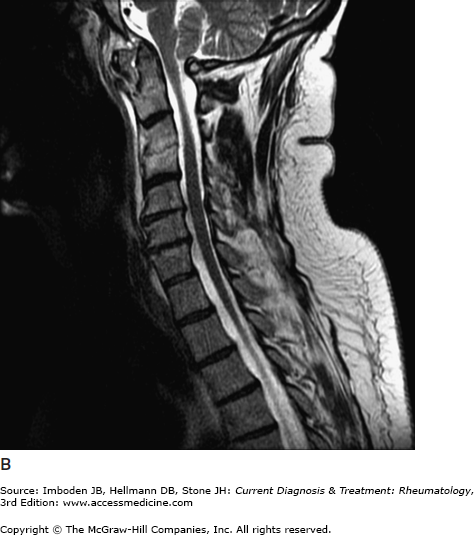
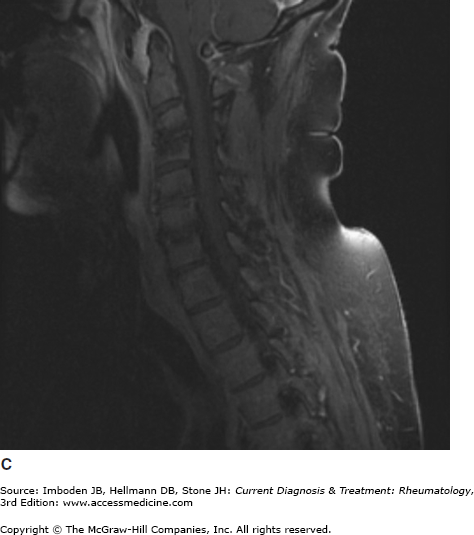
Rheumatoid arthritis of the cervical spine. Coronal T1 (A), T2 (B), and T1 post-contrast fat saturated (C
Related posts:

Stay updated, free articles. Join our Telegram channel

Full access? Get Clinical Tree


