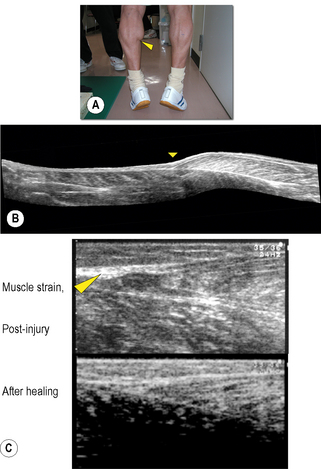
Chapter 8.2 Imaging Ultrasonography is now widely used to examine human as well as animal tissues. For this purpose, brightness-mode (B-mode) ultrasonography is often used. This mode creates a two-dimensional image of a tissue section by visualizing the portions where acoustic impedance (tissue density × acoustic velocity) changes (Noce 1990). There are distinct differences in acoustic impedance at interfaces between adipose and muscle tissues and bones, thereby enabling delineation of their peripheries by ultrasonography. Ultrasound is also emerging as a useful tool to image and measure the structure and organization of the connective tissue network in normal and pathological conditions. During ultrasound imaging of biological materials, echoes generated by relatively homogeneous material (e.g., fat-containing areolar connective tissue) produce diffusely scattered signals, while echoes generated by interfaces of organized tissues (e.g., dense connective tissue layers) produce more correlated “specular” signals (Insana et al. 1985; Garra 1993; Kremkau 1998; Lizzi et al. 2006). Dense and areolar connective tissue planes, respectively, appear as echogenic and echolucent bands in two-dimensional ultrasound images (Langevin et al. 2007). Ultrasonography, therefore, is a useful tool to both visualize and quantify the structural characteristics of the dense and areolar connective tissue components of fasciae. Ultrasonography was first applied to humans by Howry & Bliss (1952), and used for the purpose of viewing the cross-section of skeletal muscles (Howry 1965). B-mode ultrasonography was then used to measure cross-sectional areas of skeletal muscles by Ikai & Fukunaga (1968). Since then, B-mode ultrasonography has been used to obtain sectional images of skeletal muscles in vivo. Spatial, as well as time resolution, of ultrasonography is rapidly improving. When an ultrasonic probe of appropriate frequency (normally between 3 and 10 MHz, depending on the depth of the muscle) is placed on the skin in a longitudinal direction of the underlying muscle, one can observe hypoechoic striae within the muscle between the horizontal echoes (Fig. 8.2.1a). The former are from echogenic structures between perimysia such as fibroadipose septa (Fornage 1989), and the latter from the epimysia and aponeuroses. Kawakami et al. (1993) and Narici et al. (1996) confirmed that the striated patterns represent orientations of fascicles. Fascicle length and angle (with respect to aponeuroses) can be determined by measuring the length of a representative echo within the muscle and its angulation relative to the underlying echo (Fig. 8.2.1a). Among the factors affecting the force that a muscle can produce, the length and contractile velocity of its fibers are particularly important. This is because the force exerted by a muscle fiber is determined by its length and contraction velocity. For muscles like the triceps surae, in which muscle fibers run from the proximal to distal end of each fascicle (Kawakami et al. 2000a), measurement of the fascicle length can provide information of how muscle fibers develop forces. In this regard there is a particular advantage of ultrasonography, in that it enables measurement of fascicle behavior during contraction in real time. The disadvantage of ultrasonography may be a relatively limited scan area and two-dimensional, planar information of fascicles and tendinous structures which in reality are three-dimensional (Scott et al. 1993). These drawbacks can be partly solved by a three-dimensional ultrasound system in which multiple ultrasound images are reconstructed three-dimensionally (Fig. 8.2.1b) (Kawakami et al. 2000b). Fig. 8.2.1 • B-mode ultrasound images of human muscles. From ultrasonic observation of individuals with widely varying hypertrophic status of skeletal muscles, Kawakami et al. (2006) found relationships between muscle size and fascicle angles for some limb muscles. Fig. 8.2.1c illustrates longitudinal images of the triceps brachii muscle that show an outstanding hypertrophic response (Kawakami et al. 1993; 2006). In a highly hypertrophied triceps, fascicles are packed curvilinearly with large angles from the deep aponeurosis. The angulation of fascicles relative to aponeuroses is typically seen in pennate muscles, and determines the component of muscle fiber forces in the direction of the line of action of muscle (Huijing et al. 1989). Large variability of fascicle angles suggests different degrees of fiber–tendon force transmission between individuals, and there is some evidence in support of this (Ikegawa et al. 2008). Figure 8.2.1(d) shows longitudinal ultrasonic images of the gastrocnemius medialis muscle at rest and during maximal isometric contraction (Kawakami & Fukunaga 2006). Although this is a fixed-end contraction where the whole muscle-tendon unit length is kept constant, one can clearly observe changes in fascicle orientations by contraction: fascicles shorten with increasing angles. Contraction thus induces deformation of fascial organization of the muscle. Shortening of fascicles occurs at the expense of elongations of the tendinous structures (Griffiths 1991; Kawakami et al. 1998). During dynamic human movements, this muscle-tendon interaction plays an extremely important role. Kawakami et al. (2002) used ultrasonography to track length changes of the gastrocnemius fascicles during ankle hopping preceded by a counter-movement, and showed that fascicles contract isometrically when the muscle-tendon unit is being lengthened. In this phase, tendinous structures are lengthened and store elastic energy which is released during the shortening phase that follows, to add to positive mechanical work. A similar mechanism has been found during human walking (Fukunaga et al. 2001). Previous studies have shown that the mechanical properties of tendinous structures, especially those of the aponeuroses, depend on the contractile status (passive or active, static or dynamic, long or short lengths) of fascicles (Zuurbier & Huijing 1992; Zuurbier et al. 1994; Lieber et al. 2000; Kato et al. 2005; Sugisaki et al. 2005). Hence, the mechanical behavior of the whole fascial continuum could change during contractions involving dynamic fascicle length changes under varying contraction intensities. If so, the interface between the aponeurosis, tendon, and fascicles could be stressed locally. In the human gastrocnemius muscle, this position corresponds to the distal end of the muscle belly, where muscle strain frequently occurs (Fig. 8.2.2). Fascial structures inside and outside the muscle, and their behavior during contraction, are therefore physiologically and clinically relevant, and ultrasonography is a powerful tool to examine these in vivo.
Ultrasound
Introduction
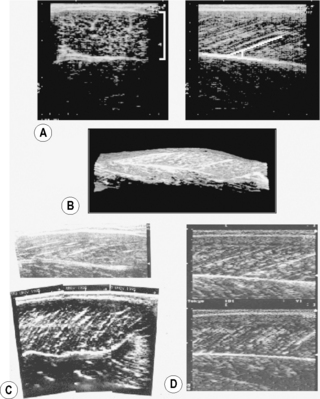
(A) Transverse (left panel, lateral-medial) and longitudinal (right panel, distal-proximal) B-mode ultrasound images of the human gastrocnemius medialis muscle. From top to bottom, skin to deep layer. In the right panel, a white line is drawn along a representative echo parallel to fascicle orientation. (B) Three-dimensional reconstruction of ultrasound images of the human gastrocnemius medialis muscle (Kawakami et al. 2000a). A part of the soleus muscle is also visualized. (C) B-mode ultrasound images of the triceps brachii muscle (long head) of a normal individual (top panel) and a highly trained bodybuilder (bottom panel). From right to left, distal to proximal. (D) B-mode ultrasound images of the gastrocnemius medialis muscle at rest (top) and during maximal isometric contraction (bottom). From right to left, distal to proximal.
![]()
Stay updated, free articles. Join our Telegram channel

Full access? Get Clinical Tree


Musculoskeletal Key
Fastest Musculoskeletal Insight Engine