Imaging
Clive Perry
Introduction
This chapter will review the current position of medical imaging, the general principles of imaging and the way it can be used to solve clinical questions.
With the discovery of X-rays by Wilhelm Conrad Roentgen in 1895, the age of medical imaging was born. With the advent of the technological age, new discoveries have added other modalities, providing unique information regarding anatomy, pathology and the function of living organs. The relatively low cost and power of modern computers has allowed very large image data sets to be generated quickly. New software allows multiple display formats including three-dimensional, multiplanar, real-time, fused and functional images. This has enabled imaging to remain a relevant and essential part of modern clinical decision-making, resulting in increased efficiencies and better outcomes. The digital nature of modern images allows the efficient storage and dissemination of information to the referring physician and radiologist via local networks and the internet.
Basic principles
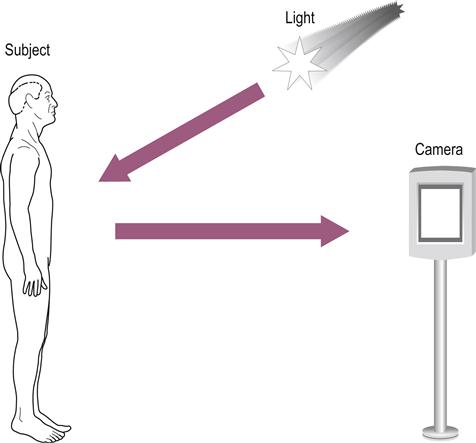
All medical imaging has the same basic requirements. The first is an energy source that interacts benignly with biological tissue and is capable of representing the structure and/or function of this tissue. The second is an ability to capture and store the energy or data that result from this interaction and display them as an image. As an example, let us look at the photograph. The energy source, light, is reflected from the subject and captured on photographic film or digitally to produce an image, the photograph (Fig. 14.1).
Imaging modalities
X-rays
X-rays, like light, are part of the electromagnetic spectrum but have a higher energy and shorter wavelength, which allows them to pass into and through the human body (Fig. 14.2). Different tissue types absorb different amounts of the X-ray beam: bone, a very dense tissue, absorbs most of the beam whereas lungs, consisting mainly of air, do not. As a result, varying amounts of X-rays exit the body, reflecting the different tissue types that the X-ray beam has passed through. As Roentgen discovered, the X-rays will stimulate a fluorescent screen to produce light, which can be captured on specialized photographic film to produce an image of the body part. This is referred to as a radiograph or X-ray. Obtaining a good radiograph has many similarities to obtaining a good photograph. For example, if the subject moves, the photographic image will be blurred; if not enough light is available, the image will be dark. Similarly, if the radiograph is not exposed correctly, the image will be limited. This is particularly a problem with large patients. These issues are the same for all imaging studies.
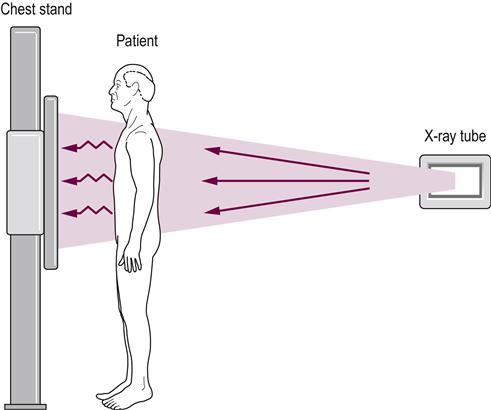
X-rays are produced by the X-ray tube. X-rays have a higher energy than light and pass through the patient; the X-ray film contained within the chest stand captures them. The X-rays are absorbed to a different degree by different tissues as explained in the text. The end result is a chest radiograph, as seen in Figure 14.3A. Note the X-rays enter the patient posteriorly and exit anteriorly. This orientation produces the best image and is a posterior to anterior radiograph, better known as PA, chest X-ray (CXR).
Radiographs are relatively inexpensive, quick to perform and widely available. As a result, they continue to make up the bulk of imaging studies. Similar to the camera, radiographic images have moved away from film and are now mainly of digital format.
Image quality depends on the ability to discriminate between two adjacent objects, also called spatial resolution; with X-rays, this is very good. However, the ability to see a structure also depends on the difference in the attenuation of the X-ray beam between different tissues, i.e. tissue contrast. For example, bone, which attenuates most of the beam, is well outlined against adjacent soft tissue such as muscle, which does not attenuate the beam as much. Similarly, the lung parenchyma and cardiac silhouette is differentiated well from the surrounding air (Fig. 14.3A). However, differentiating soft tissue is a problem because of a similar attenuation of the beam; this means that the tissues all have a similar gray appearance, i.e. little or no contrast (Fig. 14.3A). This can be overcome to some extent by using contrast agents. Oral contrast with a barium solution, e.g. a barium enema, is used for evaluating the gastrointestinal tract. Intravenous and intra-arterial iodinated contrast agents for evaluating blood vessels and organs are used in arteriography and intravenous urograms.
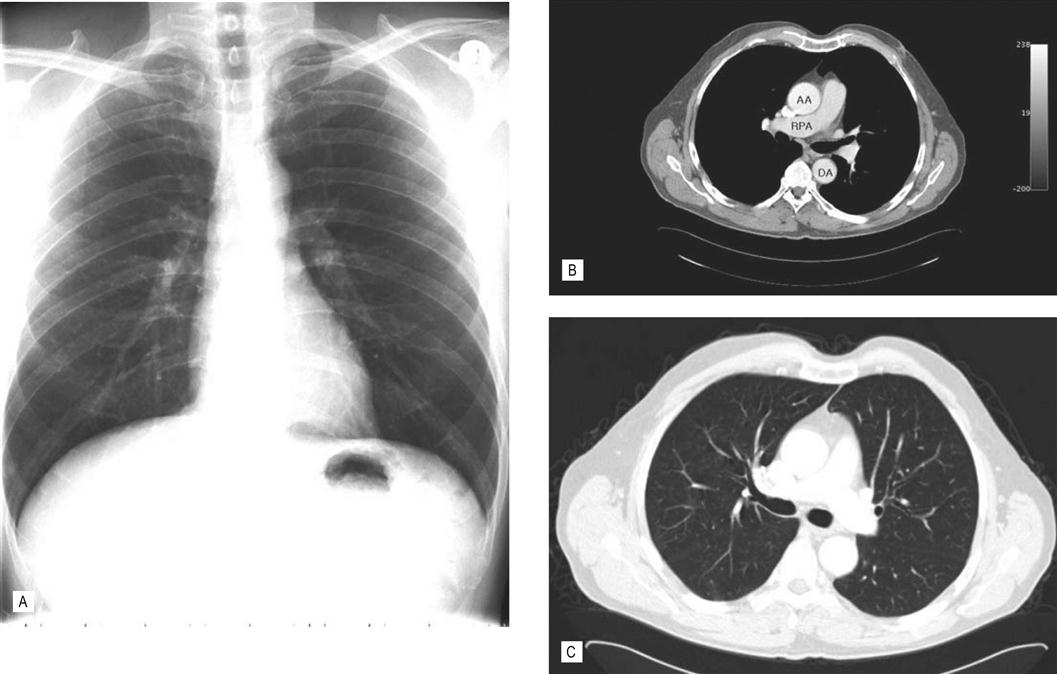
(A) Chest radiograph. The radiograph provides a quick and inexpensive overall view of the chest. The air-containing lungs are black because of little attenuation of the X-ray beam. The central pulmonary arteries and heart are well defined by the surrounding lung. However, the chest wall soft-tissue structures are poorly seen because of similar attenuation of the beam, i.e. lack of contrast. The denser bones, e.g. clavicles and ribs, are white. The heart overlies and obscures the thoracic spine in this view. (B and C) Axial CT chest. In (B) the viewing settings are optimized (i.e. window and level) to show the soft tissues to best effect. AA, ascending thoracic aorta; DA, descending thoracic aorta; RPA, right pulmonary artery. (C) Same patient and same level. However, by changing the viewing settings the lungs are now seen in exquisite detail. Note the improved anatomical depiction and improved tissue contrast in the CT images. CT solves the problem of overlapping structures obscuring the anatomy. The mediastinal and chest wall structures are now well seen.
Fluoroscopy uses continuous X-rays (in reduced doses) to allow real-time images. A device known as an image intensifier allows you to view the images on a TV screen. Although the radiation dose used to produce a particular image is much reduced compared with a standard radiograph, care must be taken not to prolong the procedure and cause unwanted exposure of the patient to high doses. Types of procedures using this technique include barium studies, arteriograms and internal fixation of fractures in the operating room.
Standard X-ray images produce a two-dimensional display of a three-dimensional structure; this means that there is an overlap of structures resulting in part of the anatomy being hidden. For example, on a frontal chest radiograph, the overlying heart obscures the spine (compare the chest radiograph in Fig. 14.3A with the chest CT in Fig. 14.3B and C). This can be alleviated somewhat by obtaining additional views such as a lateral view. However, the problem of overlapping structures has been overcome following the introduction of computerized axial tomography (CAT or CT scan) in the 1970s, made possible with the advent of the computer and the ability to capture and store data digitally.
Computed tomography
A computed tomography (CT) scan also utilizes X-rays to produce images but, instead of being stationary, the X-ray tube rotates around the patient (Fig. 14.4). Specialized detectors collect the emerging X-rays and produce an electrical signal that is fed into a computer; this information is then used to construct a cross-sectional image (Fig. 14.3B). The initial CT technique took several hours to acquire the data and several days for the computer to reconstruct the images. Modern scanners are very fast and can image the entire abdomen and pelvis in seconds. Multislice CT scanners are now replacing single-slice technology and, as the name indicates, multiple slices can be produced per rotation of the X-ray tube. This has the advantage of covering more territory and shortening scan times. This technology can produce very thin axial slices allowing the production of isotropic data sets, i.e. it has the ability to acquire a volume of data that can be viewed in any plane without distorting the image. Until this innovation, CT scans were generally limited to an axial display; now images can routinely be displayed in any plane giving multiplanar (MPR) and three-dimensional reconstruction capabilities. This allows more information to be gleaned from the study and improves diagnostic accuracy (Figs 14.5 and 14.6), particularly with complicated pathology such as complex fractures (see Fig. 14.7).
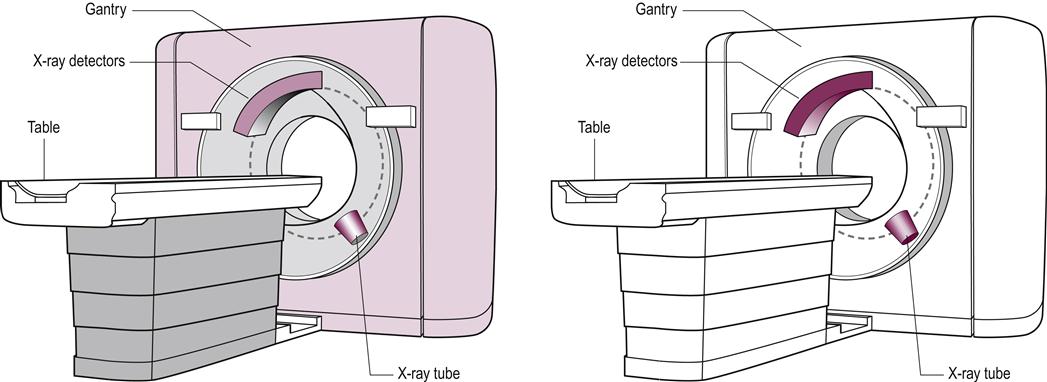
(A) The table on which the patient lies and the gantry through which the patient passes during a CT scan. (B) The position of the X-ray tube and detectors within the gantry. The X-ray tube and detectors rotate around the patient. The X-rays pass through the patient and are collected by the detectors, which lie opposite. The detectors produce an electrical signal, which is fed into a computer to construct a cross-sectional image.
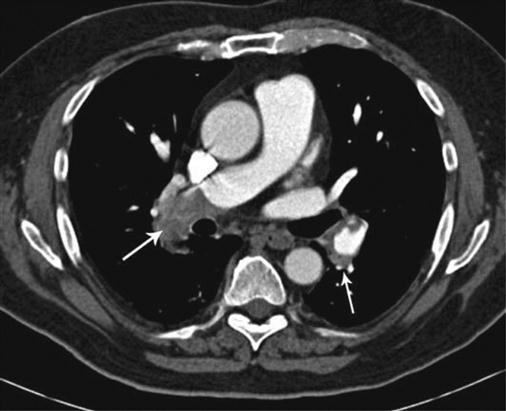
CT is now being used increasingly for evaluating acute chest pain. Here is an example of an acute pulmonary embolus. This 72-year-old male presented with bilateral leg pain and swelling, chest pain and shortness of breath. The lower limb ultrasound (not shown) demonstrated bilateral deep vein thrombosis. The CT (above) was obtained following intravenous contrast. Note that the contrast in the right pulmonary artery shows an abrupt cut-off, and low attenuating gray material (representing the embolus) is seen in the proximal right lower lobe pulmonary artery (right arrow). Compare with normal chest CT in Figure 14.3. This represents a large pulmonary embolus. A smaller embolus is seen on the left side (left arrow). CT plays a major role in evaluating chest disease. The scan takes a few seconds, making it an ideal modality for emergency situations such as this.
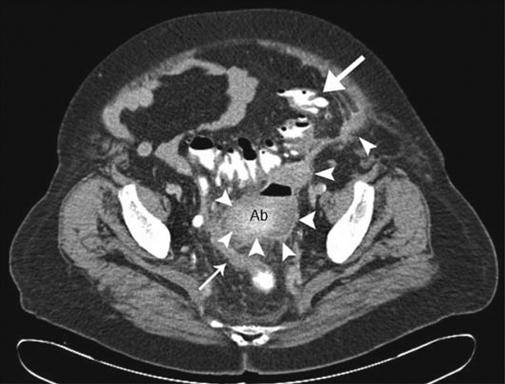
This can be difficult to evaluate on clinical grounds alone in the elderly as illustrated in this case of diverticulitis and diverticular abscess. This is a CT scan of the pelvis of a 70-year-old woman with minimal abdominal pain. Acute intra-abdominal processes can be a diagnostic dilemma in the elderly as symptoms and signs may be minimal or absent, as in this case. CT is very helpful in this situation. The CT demonstrates diverticular disease involving the barium-filled sigmoid colon (large arrow). The arrowheads show the track of the perforation leading to the abscess in the pelvis (Ab). The rectum is seen to the right and posterior to the abscess (small arrow). The abscess was drained surgically along with resection of the sigmoid colon. Note how the intra-abdominal and subcutaneous fat acts as a natural contrast, allowing separation and good delineation of adjacent soft tissues; this is one of the few advantages of being overweight.
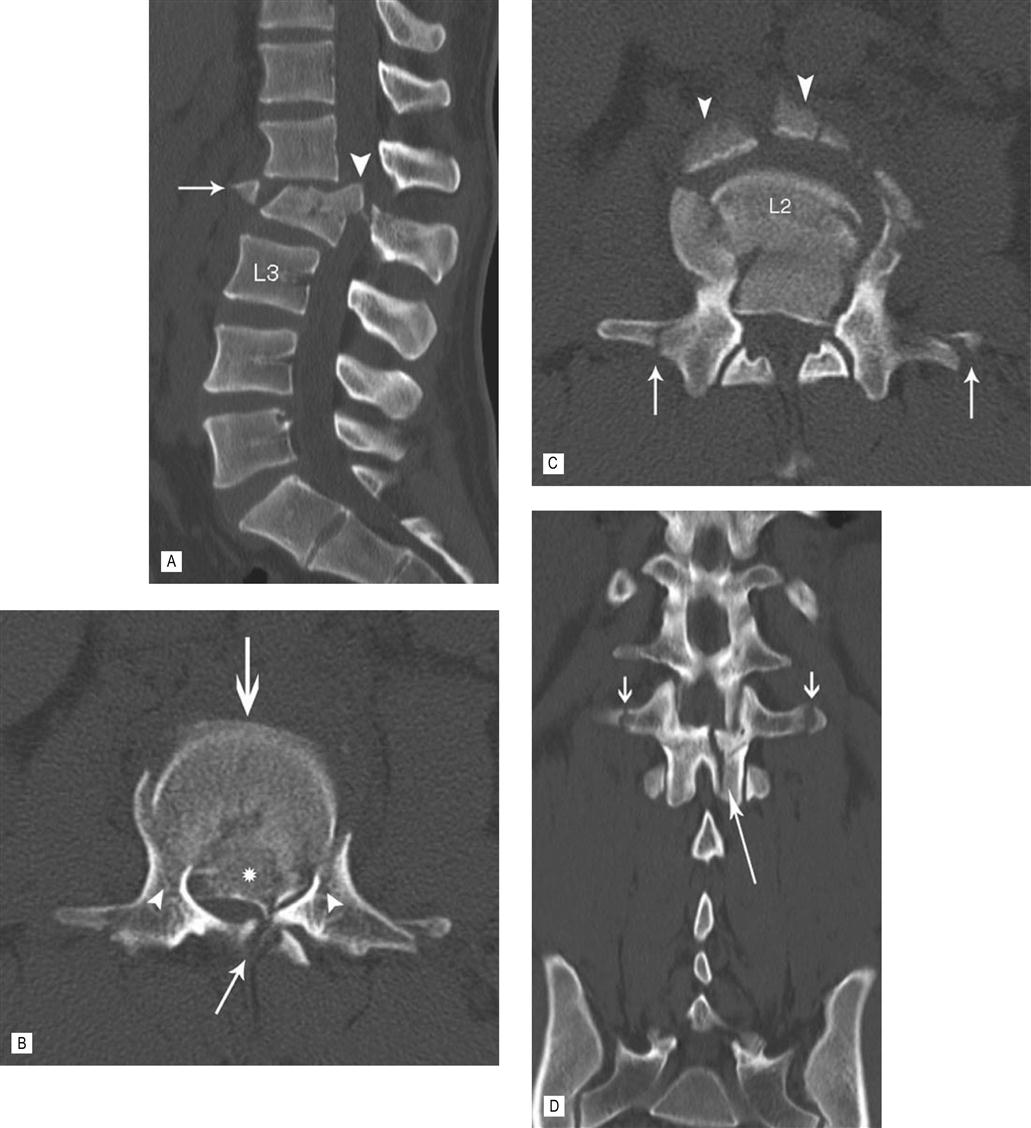
CT with multiplanar (MPR) reconstruction vividly demonstrates the components of this complex fracture, which resulted following a motor vehicle accident. (A) The sagittal MPR shows posterior displacement of the body of L2. There is a large, central, superior retro-pulsed fragment. An anterior and superior fragment has been avulsed. (B) The axial image at the level of the retro-pulsed fragment (*) demonstrates severe narrowing of the spinal canal. The vertebral body has been driven between the pedicles with fractures at the junction of the vertebral body and pedicles. (C) Just caudal to (B) shows the avulsed anterior fragments (arrow head) and fractures through both transverse processes (arrows). (D) There is widening of the interpedicle distance and a sagittal fracture through the lamina best seen on this coronal MPR. The fracture is unstable with disruption of all three columns. The patient had a significant neurological deficit and was treated with spinal decompression and instrument fixation.
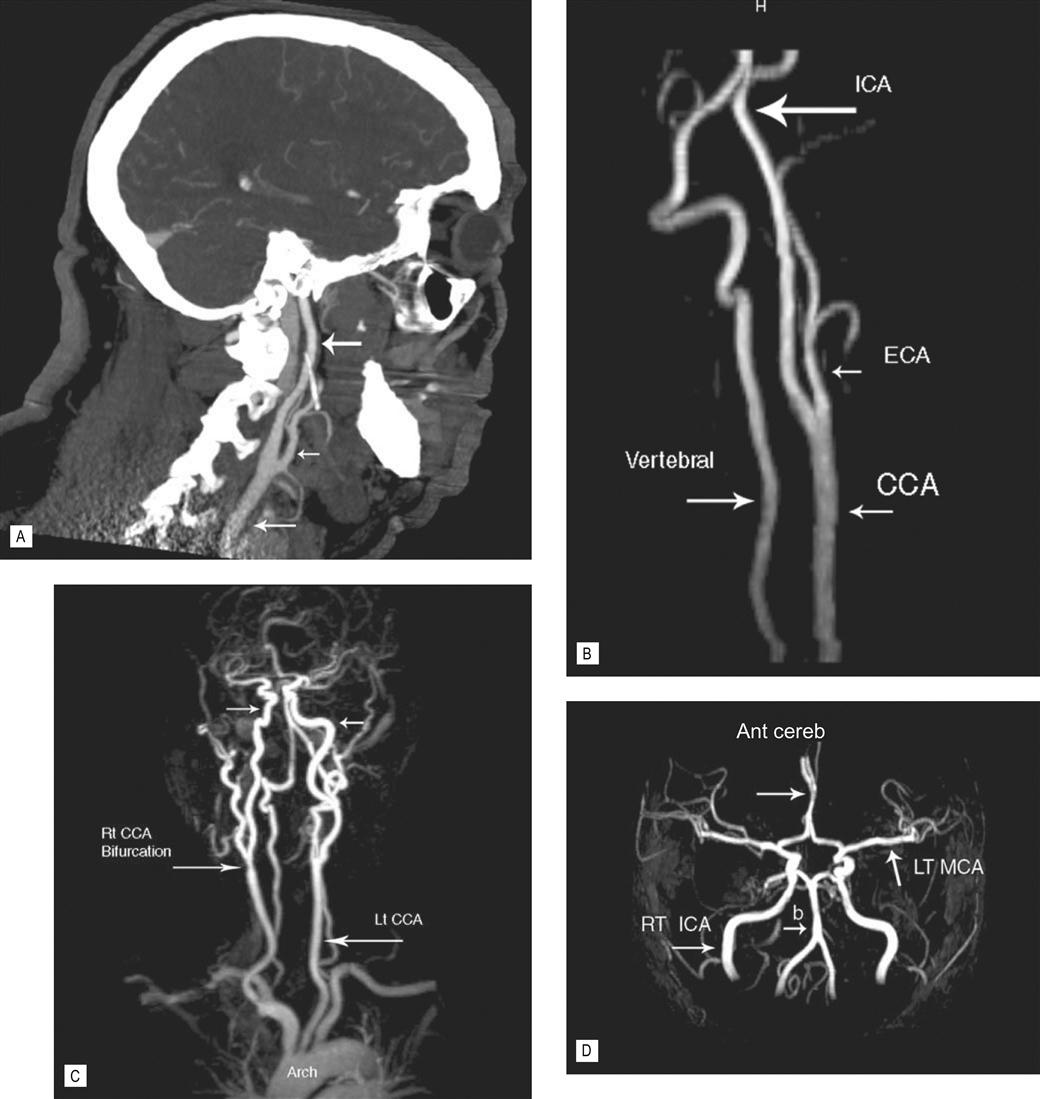
CT scanning is used to image all parts of the body. The speed of the examination makes this a particularly attractive investigation for older patients who may find it difficult to lie still for long periods of time. It also makes it the preferred method for examining very sick and injured patients when time is of the essence (Figs 14.5 and 14.6). The relatively large size of the gantry (the part of the machine that the patient passes through) (see Fig. 14.4) has almost eliminated the problem of claustrophobia. As with standard X-rays, CT demonstrates superb lung and bone detail (Figs 14.3C and 14.7). Fluids, such as ascites and cystic structures are well defined as are calcifications and acute and subacute hemorrhage (see Fig. 14.12A–C). Fat, particularly in the abdomen, is a natural contrast agent and is useful in defining adjacent organs and inflammation (see Fig. 14.6); however, CT still requires additional contrast agents to improve visualization. Oral contrast, usually in the form of dilute barium, aids visualization of the bowel (see Fig. 14.6), and intravenous contrast is used to optimize the evaluation of veins and arteries and the vascularity of organs. The addition of intravenous contrast material also allows further uses of CT, for example pulmonary embolism is now routinely evaluated by this method (see Fig. 14.5). The speed of the new multislice scanners allows the beating heart and coronary arteries to be evaluated. The ability of CT to demonstrate an artery is now as good as the more invasive procedure of diagnostic arteriography and, in complex anatomical situations, may be better. As a result, many arterial lesions, such as aneurysm, dissection and stenosis, are diagnosed and evaluated with CT (Fig. 14.8), and the more invasive diagnostic arteriogram is now mainly used for therapy (e.g. treatment of a narrowed artery and aortic aneurysm with specially designed stents, which can be placed percutaneously via adjacent non-diseased vessels).
Ultrasound
Ultrasound has been used since the 1950s to produce medical images using sound waves. The frequency of the wave used to produce the images is in the range of 1–20 MHz. It is called ultrasound because this frequency is above the human audible range of 2–20 kHz. The probe or transducer used during the examination is responsible for both producing the sound and collecting the sound waves reflected from the patient’s organs and tissues. The received sound is converted to an electrical signal and, from this, an image is developed by a computer and displayed in real time on a TV monitor. In addition, by using the Doppler effect, the returning sound waves can be used to evaluate blood flow. It is excellent for imaging soft tissues and has a long list of uses, including imaging of the major abdominal and pelvic organs. Superficial structures are particularly well seen, for example, the thyroid, superficial tendons, muscles, veins and arteries (see Figs 14.14C and 14.15E and F).
The combination of real-time, multiplanar and vascular imaging makes ultrasound an excellent tool for imaging the heart. The lack of ionizing radiation and substantiated adverse effects have made it a popular imaging technique in all age groups. The relatively inexpensive equipment costs and portability have added to this. It is an excellent tool for guiding percutaneous needle biopsies, especially superficially located lesions such as breast and thyroid masses. There are some negative aspects of ultrasound. Unlike all other imaging methods, it relies heavily on the expertise of the sonographer/sonologist to produce diagnostic images. Sound is reflected by bone and air, limiting evaluation of the chest, abdominal organs, which may be hidden by overlying gas-filled loops of bowel, and the brain, which is surrounded by the protective cranium.
Magnetic resonance imaging
The phenomenon of magnetic resonance was discovered in the 1930s and initially used to determine the composition of chemical compounds. In the 1970s, it was realized that the same techniques could be used in medical imaging and, by the 1980s, magnetic resonance imaging (MRI) units were in clinical use. Magnetic resonance uses radio waves and a strong magnetic field to produce the image; as with ultrasound, it does not use ionizing radiation. The technique relies on the fact that some atomic nuclei have magnetic properties that act like microscopic magnets when placed in a strong magnetic field. The human body has an abundance of these in the form of the hydrogen ion that makes up water. These align with the direction of the bore of the magnet when the patient lies in the MRI machine (Fig. 14.9). If these nuclei are stimulated by a radio wave at a specific frequency, known as the resonant frequency, they gain energy and move into a transverse plane, perpendicular to the main magnetic field. This results in a radio wave being emitted by the rotated nuclei, which allows their position to be recognized. The radio waves are emitted and received by a device called a radio frequency (RF) coil, analogous to the ultrasound transducer that transmits and receives the sound waves. The coils are placed close to the patient. The head coil, used to image the brain, looks like a cylindrical cage that surrounds the patient’s head (Fig. 14.9A). As with ultrasound, the received signal, in this case radio waves, creates an electrical signal, which is fed into a computer to produce an image (Fig. 14.10A, B).
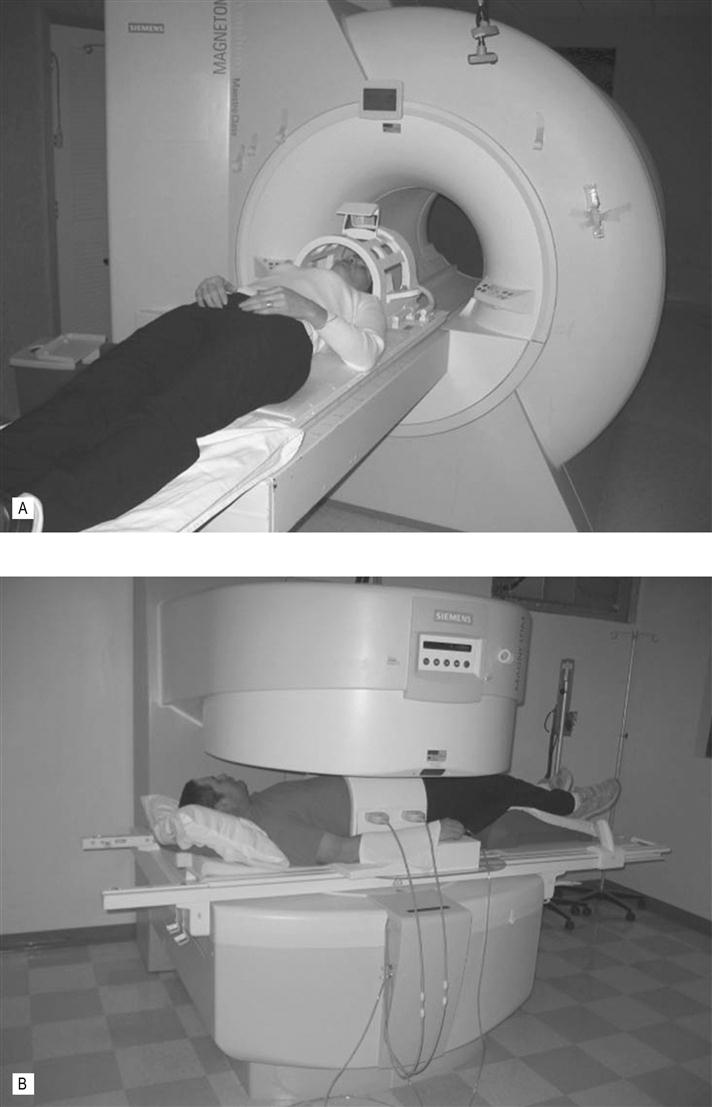
(A) This patient is getting ready for a head scan in this closed, high field strength MRI scanner. The cage around the head contains the radiofrequency (RF) coils. Note that the bore of the magnet is fairly long and not that wide. This can be a problem for large patients and patients who suffer from claustrophobia. Elderly patients may become disorientated in this enclosure. New wide-bore MRI scanners help alleviate this problem. (B) Example of an open MR scanner. These scanners may not be capable of all the imaging sequences and can take longer to acquire the images but image quality is good and they are usually well tolerated by patients who suffer from claustrophobia. The large belt around the patients abdomen is an RF coil.
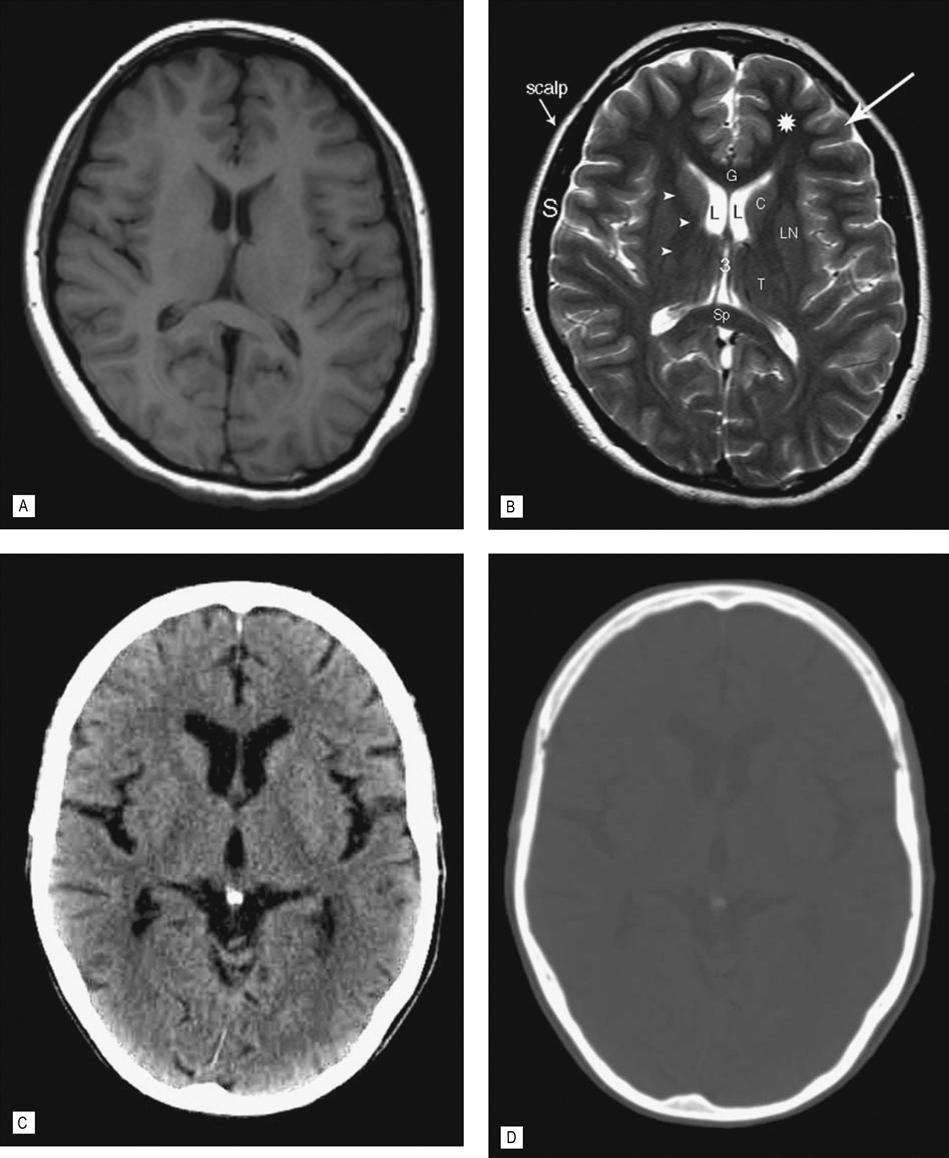
(A) T1-weighted spin echo (SE) image (T1WI) and (B) T2-weighted turbo spin echo (TSE) image (T2WI). (C) CT optimized for viewing soft tissues. (D) Same CT optimized for viewing bone. All obtained without intravenous contrast at the level of the lateral (L) and third (3) ventricle. The T1 and T2 images are the basic sequences used in MRI, but there are several other sequences that are used which display certain pathologies to greater effect. CT, however, has only one sequence but by altering the level of attenuated tissues displayed the bony skull is seen to better effect. This is demonstrated in (D), which shows the same CT scan with the view settings (level and window) optimized to demonstrate bone. Note the improved tissue contrast with MR allowing improved definition of the gray matter in the cerebral cortex (arrow) versus the white matter in the adjacent left frontal lobe (*). CSF in the third, lateral ventricles and sulci on the T2WI is bright and dark on the T1WI and CT. Note the skull is bright on CT, indicating increased attenuation of the X-ray beam. Calcium in the pineal gland is also bright (image C). The bright area surrounding the brain on the two MRI images, however, is subcutaneous fat in the scalp. Cortical bone does not produce a signal and the signal void (black area) between the scalp and the brain is the skull (S). G, genu and Sp, spenium of the corpus callosum; C, head of the caudate nucleus; L, lentiform nucleus; T, thalamus; arrow heads, internal capsule.
The high tissue contrast (i.e. the difference in signal between tissue types) afforded by magnetic resonance is responsible for the excellent depiction of soft tissue anatomy. There are two main types of pulse sequences used in MRI, which produce images of the same area but with a different contrast; these are known as T1- and T2-weighted images. This is achieved by varying the time when the RF pulse is emitted and when the returning RF wave is received. Fluid gives a low signal on T1 images and a bright signal on T2 images, whereas fat gives a high signal on T1 and T2 images (when using the faster T2 turbo spin echo [TSE] sequence). Unique to MRI is the ability to selectively remove or null particular tissues from the image. For example, fat, which is bright and may obscure pathology, can be removed by a technique called fat saturation or ‘fat sat’ for short (see Figs 14.13E and 14.15D). This is an extremely useful technique, which also makes it possible to confirm that a structure is fat-containing (e.g. a lipoma) by obtaining images before and after fat saturation.
MRI is also routinely used to evaluate blood vessels (see Fig. 14.8). These images can be generated without the use of intravenous contrast agents although contrast-enhanced studies are also used to acquire additional information. The latest and faster MRI sequences allow routine evaluation of the beating heart and are a valuable tool in complementing cardiac ultrasound and cardiac nuclear medicine studies. Magnetic resonance spectroscopy has the ability to evaluate the chemical composition of tissue and has shown promise in the diagnosis of cerebral tumors. MRI is also used to evaluate brain function, the so-called functional MRI.
Nuclear medicine
There are some fundamental differences between nuclear medicine and the other imaging modalities. Whereas the other modalities rely mainly on a change in anatomy caused by a pathological process, nuclear medicine is able to show images of changes in function or physiology as a result of pathological change. The energy source in nuclear medicine is a radionuclide that emits ionizing radiation in the form of gamma rays, which come from the same part of the electromagnetic spectrum as X-rays. The radionuclides are tagged with a biological compound that is used by a living tissue; this combination is called a radiopharmaceutical. Unlike the other forms of imaging, the radiopharmaceutical is placed inside the patient, usually by an intravenous route, and taken up by the organ/cells or pathological process of interest. During decay of the radionuclide, gamma rays are emitted and pass out of the body and are collected by a gamma camera to produce an image. The most common radionuclide used is technetium 99 m, and a common study is a bone scan in which the technetium is labeled with diphosphonate (Tc-MDP) (Fig. 14.11A, B). This is quickly taken up by bone, particularly in areas of bone remodeling, for example fracture repair and most bone metastases. The camera is positioned over the area of interest and images obtained in a two-dimensional plane (the planar image) (Fig. 14.11C). As in CT, images can also be obtained by rotating the camera slowly around the patient to obtain a cross-section or tomogram. This is referred to as SPECT (single photon emission tomography), and is used in, for example, SPECT bone imaging and thallium SPECT imaging of the heart.
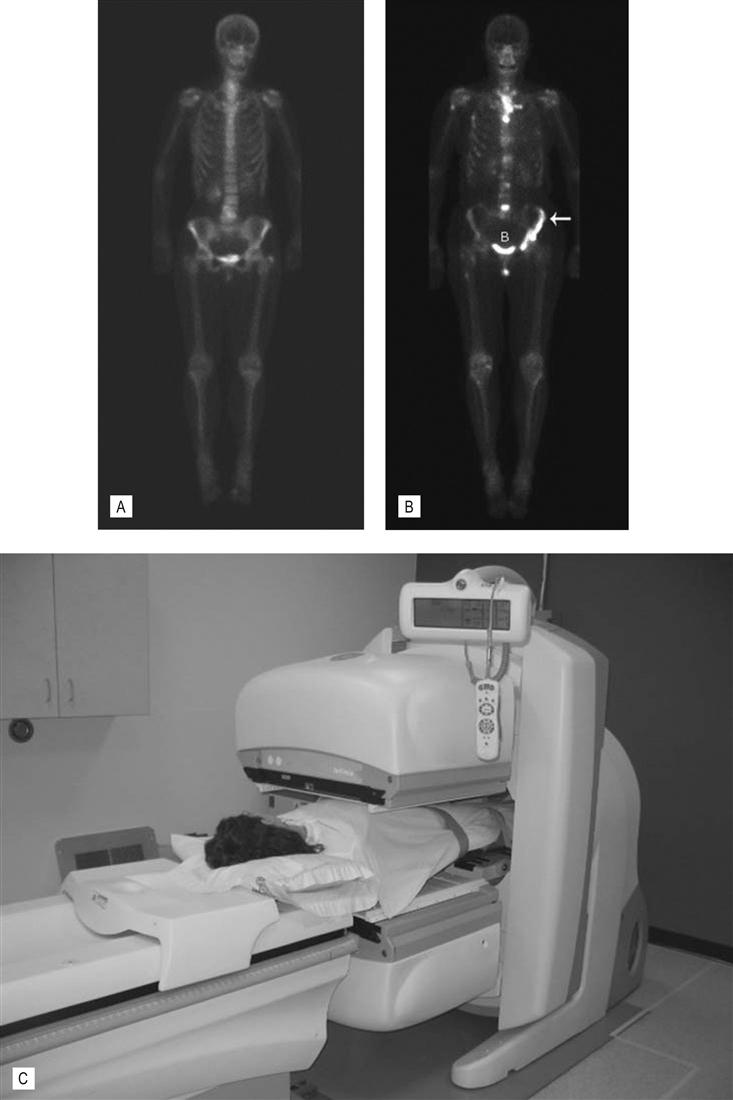
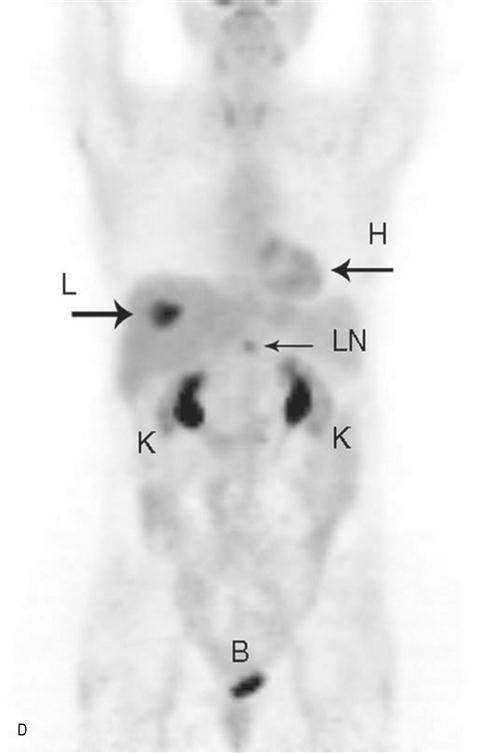
(A) Normal bone scan. This anterior view was obtained 4 h after the intravenous injection of the radionuclide – Tc99m MDP. The images show expected bone uptake in a 60-year-old female. The scan is routinely delayed to allow clearance of the radionuclide from the blood and soft tissues which would interfere with bone visualization. Note the symmetry of uptake. Increased activity at the shoulder and iliac wings in the pelvis is normal. Activity in the lower neck is due to normal thyroid cartilage activity. The tracer is cleared through the kidneys hence expected increased activity in the bladder and kidneys. Increased activity at L4/5 is due to degenerative disk and facet joint disease. (B) Bone metastases. Anterior view of a 65-year-old woman with metastatic bone disease from breast carcinoma. Increased activity is seen in the spine, left ilium (white arrow), sternum, the proximal right humerus and femur. The bone scan is used to diagnose the presence, extent and response of disease to treatment. (C) Nuclear medicine gamma camera. There are two gamma cameras (dual head), one above and one below the patient. This allows anterior and posterior images to be collected simultaneously, speeding up the examination. The cameras can be rotated around the patient to allow oblique and lateral projections. (D) Positron emission tomography (PET). Example of a PET scan with fluorodeoxyglucose (FDG). It was obtained to stage the colon cancer in this 60-year-old woman. Note the round area of increased activity in the liver (L arrow) from a single metastasis. This confirmed the CT findings. Increased activity in a small upper abdominal lymph node (LN) is also consistent with metastatic disease. This was not suspected on CT which relies on lymph node enlargement to make the diagnosis. FDG is excreted via the kidneys, hence the normal activity in the kidneys (K) and bladder (B). Normal activity is also seen in the heart (H).


Stay updated, free articles. Join our Telegram channel

Full access? Get Clinical Tree


