Number of different sports/events
Number of registered athletes
Incidence of injuries per 1000 registered athletes
Percentage of time-loss injuries
Main location or diagnoses
Main causes
Disciplines with higher injury risk
Summer OG 2008 [35]
28/302
10,977
96.1
50
Ankle sprain Thigh strain
Contact with another athlete (33 %), overuse (22 %), noncontact (20 %)
Football (soccer), taekwondo, hockey, handball, weightlifting, and boxing
Summer OG 2012 [21]
26/302
10,568
128.8
35
Thigh, knee, and lumbar spine
Sprain, strain, and contusion
Overuse (25 %), noncontact trauma (20 %), contact with another athlete (14 %), contact with a stationary object (12 %)
Taekwondo, football, BMX, handball, mountain biking, athletics, weightlifting, hockey, and badminton
Winter OG 2010 [20]
7/86
2,567
111.8
23
Face, head and cervical spine, and knee
Contusion, sprain, strain
Noncontact trauma (23.0 %), contact with a stagnant object (21.8 %), contact with another athlete (14.5 %)
Bobsleigh, ice hockey, short track, alpine freestyle, and snowboard cross
Winter OG 2014 [62]
7/98
2,780
140
39
Knee sprain (first time-loss injury diagnosis)
Contact with a stationary object (25 %), overuse with gradual onset (14 %), noncontact trauma (13 %)
Aerial skiing, snowboard slopestyle, snowboard cross, slopestyle skiing, half-pipe skiing, moguls skiing, alpine skiing, and snowboard half-pipe
1.4 Epidemiology of Injuries in Team Sports
1.4.1 Football
In players of the Union of European Football Association, Ekstrand et al. [19] reported, during a prospective cohort study over 7 seasons using a consensual methodology [28], 8 time-loss injuries per 1000 h of practice among 2226 football players. Incidence was higher during match than training. Most of injuries were located on the thigh (≈20 %) and the knee (≈20–30 %) and involved the tendon (≈20 %) and muscles (≈30 %) [19]. During world football tournaments from 1998 to 2012, using the same methods as Junge et al. [32], Junge and Dvorak [36] reported a total of 3944 injuries from 1546 matches, equivalent to 2.6 injuries per match; about 40 % were time-loss injuries. The majority of injuries (80 %) were caused by contact with another player, compared with 47 % of contact injuries by foul play. The most frequently injured body parts were the ankle (19 %), lower leg (16 %), and head/neck (15 %). Contusions (55 %) were the most common type of injury, followed by sprains (17 %) and strains (10 %).
1.4.2 Rugby
In rugby union, Williams et al. [71] in a meta-analysis reported an overall incidence of injuries in senior men’s professional rugby union of 81 injuries per 1000 player hours of match and 3 injuries per 1000 player hours of training, without differences in injury severity between match and training injuries. Muscle/tendon and joint (non-bone)/ligament injuries were the two most prevalent injury groups. In a retrospective analysis of catastrophic cervical spine injuries in French rugby during the period 1996–2006 (including all injuries causing neurological disorder), the rate of injury was 2.1 per 100,000 players per year during the 1996–1997 season and 1.4 during the 2005–2006 season (p < 0.01) because of the effectiveness of the preventive measures as the modification of the rules of scrum [6].
1.4.3 Handball
Seil et al. [59] reported, in German handball players, 2.5 time-loss injuries per 1000 h among 186 handball players during one season. Traumatic injuries were located on the knee (10 %), the fingers (9 %), the ankle (8 %), and the shoulder (7 %), and overuse injuries were located on the shoulder (19 %) and the low back (17 %). In a prospective study in a cohort 517 elite Danish handball players, Moller et al. [46] reported 6.3 injuries per 1000 h of practice (training and match) over 31 weeks. 37 % were overuse injuries and 63 % were traumatic injuries. Traumatic injuries were sprains (46 %), muscle strains (17 %), and contusions (9 %) located on the ankle/foot (23 %) and the knee (15 %), and overuse injuries were shin splints (22 %), tendinopathy (22 %), and bursitis (7 %) on the knee and the shoulder.
1.4.4 Volleyball
In volleyball, Verhagen et al. [69] reported, in a population of the national Dutch volleyball players, 2.6 time-loss injuries per 1000 h over 1 year. Ankle injuries represented 41 % of all traumatic injuries. Overuse injuries were located on the back (32 %) and the shoulder (32 %).
1.5 Epidemiology of Injuries in Individual Sports
1.5.1 Athletics
In athletics (or track and field), the prevalence of injuries is high (3–170 % per year) [15, 16]. During international athletics championships, data were collected following a consensual similar methodology [1, 34]. Data are quite similar between European and world championships: 10 % of athletes incur an injury, including about 50 % of time-loss injuries [17, 22]. The risk of injury varies substantially between the disciplines with athletes competing in combined events, steeplechase, and middle- and long-distance runs having the highest risk. The most common diagnoses are hamstring strain (16 %), lower leg strain (5–9 %), ankle sprain (3–6 %), and trunk muscle cramps (6 %) [16, 17, 22]. An overview of the injury incidence and characteristics during the international athletics championships is presented in Table 1.2. Main injury location is presented in Fig. 1.1 for female athletes and Fig. 1.2 for male athletes [18]. During the whole season, the current knowledge of injury risk is based on few studies with different methods of injury surveillance, which makes comparison between them and conclusion difficult [17]. An incidence of about 4 injuries per 1000 h of training has been reported in two cohort studies in Australian athletes [3] and Swedish athletes [30]. The characteristics of injuries vary between disciplines, according to the biomechanical and technical movements, implements used, duration of practice, and training workload [15, 16]. Higher acute injury risk is reported in explosive events (sprint, hurdles, and jumps), and higher chronic injury risk is reported in middle- or long-distance runs [5, 15]. In general, most injuries are to the lower limbs (from 60 to 100 %) and involve musculotendinous structures (Fig. 1.3) [15].
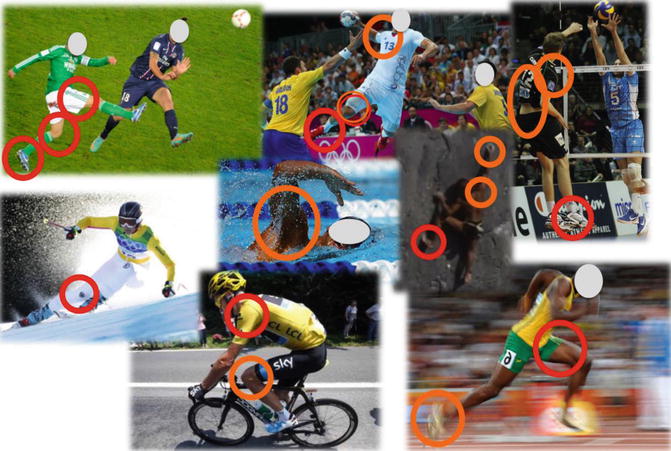
Table 1.2
Injuries during the international athletics championships
Incidence of injuries per 1000 registered athletes | Percentage of time-loss injuries | Main diagnosis | Main causes | Events with higher injury risk | |
|---|---|---|---|---|---|
World and OG | 109 | 49 | Thigh (hamstring) strain | Overuse | Combined events, marathon, middle and long distances |
European | 65 | 47 | Thigh (hamstring) strain | Overuse | Combined events, middle and long distances |
Indoor | 69 | 39 | Thigh (hamstring) strain | Overuse and noncontact trauma | Combined events and long distances |
Fig. 1.1
Main injury location for female athletes during international athletics championships from 2007 to 2014 [18]
Fig. 1.2
Main injury location for male athletes during international athletics championships from 2007 to 2014 [18]
Fig. 1.3
Summary of the main injury location by sports (traumatic injuries in red continuous line; overuse injuries in orange continuous line). Data and percentage have not been reported since these results were not from a systematic exhaustive review and since methods are different between studies making comparison between sports not possible. The aim was to illustrate the main tendencies of sports injuries according to the different sports
1.5.2 Swimming
During the 2009 FINA World Championships (Aquatics Championships), Mountjoy et al. [47] reported 66 injuries per 1000 registered athletes, including 13 % of time-loss injuries, using the consensual methods from the multi-event competition [38]. Most injuries affected the upper extremity (37 %), followed by the lower extremity (28 %), head/neck (19 %), and trunk (16 %). The most frequently injured body parts were the shoulder (15 %) and head (12 %). Overuse was the most important cause of injuries (38 %). The general injury risk was highest for diving and lowest for swimming. During the 2013 FINA World Championships, Mountjoy et al. [49] reported 83 injuries per 1000 registered athletes. The most common injured body part was the shoulder (21 %). The most common cause of injury was contact with another athlete (25 %). The highest injury incidence rate was in water polo, followed by open water swimming and diving, and the lowest incidence was seen in synchronized swimming.
1.5.3 Skiing
In skiing, the International Ski Federation reported an injury incidence of 36 injuries per 100 athletes per season, in World Cup alpine skiers, including all training sessions and races, over six consecutive seasons, by retrospective interviews [4]. The majority of injuries were time-loss injuries (82 %), leading to the absence from training and competition for at least 1 day. The most common injury location was the knee (38 %), followed by the hand, finger, and thumb (11 %); head/face (10 %); lower leg/Achilles tendon (9 %); lower back, pelvis, and sacrum (9 %); and shoulder/clavicle (7 %). Moreover, in a prospective cohort study in Swedish skiers, Westin et al. [70] reported an injury incidence of 1.6–1.8 time-loss injuries per 1000 ski hours over 5 years. The knee was the most important location (62 %), following by the hand (26 %). For noncompetitive skiers, the risk of injury is about 2.64 per 1000 skier-day (skier day is assimilated to the use of a ticket per day and per skier and is given in France by Domaines Skiables de France (http://www.domaines-skiables.fr)), but the risk is higher (2.85/1000 SD) for snow-boarders. ACL ruptures represent 18 % of injuries and 30 % for women over 15 years old [39].
1.5.4 Cycling
In cycling, De Bernardo et al. [14] reported 112 time-loss injuries (48.5 % traumatic and 51.5 % overuse) among 51 top-level male cyclists, taken part in the main European cycling competitions, in a retrospective interview over the 4 last years. 84 % sustain at least one injury. Traumatic injuries were located on the shoulder girdle (34 %) and overuse injuries on the lower extremity (68 %) [14].
1.5.5 Climbing
Jones et al. [31] reported that around 50 % of climbers had sustained at least one time-loss injury in the past 12 months, among 201 British rock climbers. Fingers (≈35–30 %) and shoulder (≈20–18 %) were the most frequent location of overuse and acute strenuous injuries. Lefevre and Fleury [40] studied climbing accidents in France during one winter season and found that more than 44 700 had been injured between December 2001 and May 2002.
1.6 Socioeconomic Aspects of Sports-Related Injury
1.6.1 Direct Costs
A general description of sports injuries was published in 2007 by the French Institute for health safety (Institut de veille sanitaire – InVS), based on the 2004–2005 survey on domestic accidents [55]. The data collection is based on the recording of emergency accidents in 12 hospitals in France. Of these, 32 007 (17,8 %) were sports injuries (70,3 % for men and 29,7 % for women) with large disparities by age: 86 % of these injuries occurred for those under 35. More than two accidents in five occurred during sports team practice. This mainly concerned men (83 %) for football practice (70 %), basketball (10 %), rugby (9 %), handball (7 %), and volleyball (3 %). Among women, 31 % of accidents occurred in basketball, 27 % in handball, 21 % in football, and 16 % and 5 % in volleyball and rugby, respectively. Ski and riding accidents were more severe, causing fractures (30 % of lesions) and requiring hospitalization in 16 % and 17 %, respectively. Hospitalizations resulting from ski injuries lasted on average 4.6 days.
In 1995, the French “Sport et Santé” report studied more than 8000 individuals aged 15–49. This sample was divided into three categories depending on whether they practiced sports. The groups were (i) the nonparticipants, (ii) moderate participants (those who practice sports less than 500 h a year), and (iii) very active participants (more than 500 h per year). Geneste et al. [27] showed that the nonparticipants suffered less traumas than the moderates participants (54,8 % versus 66.9 %) and that traumas were five times higher in the very active group compared to the nonparticipants.
The French household survey for health and social protection carried out by IRDES (Enquête Santé et protection sociale)6 enables a characterization of sports injuries by social profile. According to the 2002 to 2004 surveys, sports accidents involved more often young men aged 10–24 from higher socioeconomic classes [13, 63].
A number of studies have documented the costs of sports (accidents, fractures, sprains, deaths), with a special focus by Garry [26] on sports injuries for the young population.
Sports accidents generate direct costs affecting the victim and the insurer and also indirect costs that are borne by their employer or society at large.
1.6.2 The Benefits Associated with Practicing Sports
A pioneering study in France reported by Marini [44] shows that those practicing sports have an absentee rate of 3.64 % compared to an average rate of 6.58 % for the non practising. The French National Association for the Promotion of Physical Activity and Sports at work (ASMT) has also shown that the frequency of professional accidents decreases with the increase in physical activity.
In Toronto, Cox et al. [12] showed that companies offering physical activity to workers have successfully decreased their absenteeism rate. Van den Bossche [67] confirms that benefits exceed costs for these interventions.
In the United States, some authors have studied worksite health promotion programs and estimated savings at $272 per worker or $26 billion in total. Shephard [60, 61] estimated savings from the health improvements obtained through the practice of sports activities at comparable levels ($211 per individual).
More recently, Pelletier et al. [51] and Schultz and Eddington [58] examined the relationship between changes in health risks and changes in work productivity. Analysis (pre and post) was conducted on 500 individuals who registered with a wellness program. The results showed that those who reduced their health risk improved their presenteeism by 9 % and reduced absenteeism by 2 %, controlling for risk level, age, and gender.
Related posts:
 Special Aspects of Prevention in Children and Adolescents
Implementation of Prevention in Sports
General Training Aspects in Consideration of Prevention in Sports
Causes of Overuse in Sports
General Prevention Principles of Overload Damage in Sports
Specific Aspects of Throwing Sports in Recreational and Competitive Sport
Special Aspects of Prevention in Children and Adolescents
Implementation of Prevention in Sports
General Training Aspects in Consideration of Prevention in Sports
Causes of Overuse in Sports
General Prevention Principles of Overload Damage in Sports
Specific Aspects of Throwing Sports in Recreational and Competitive Sport
Stay updated, free articles. Join our Telegram channel

Full access? Get Clinical Tree


