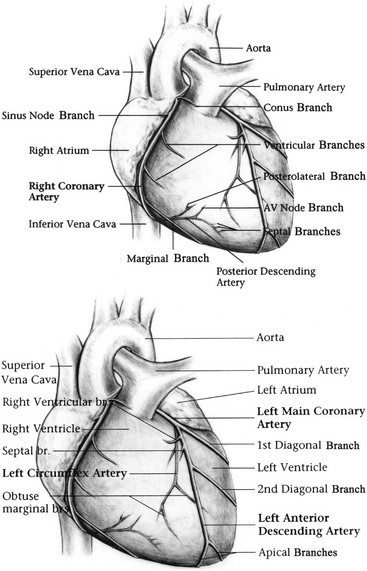
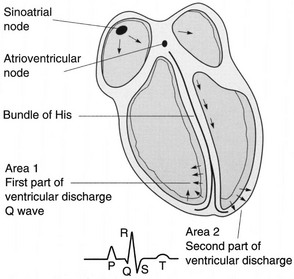
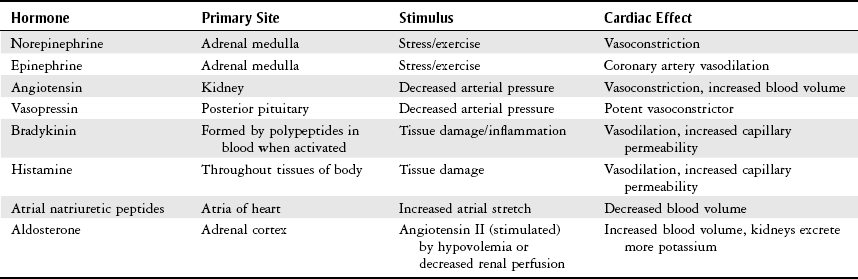
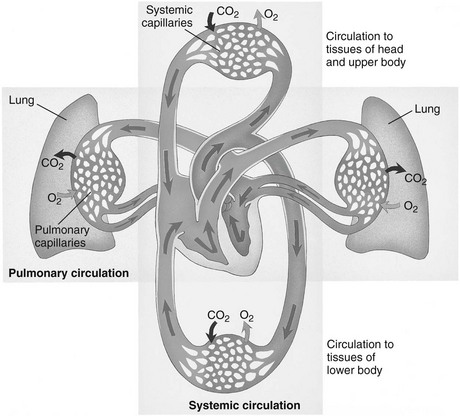
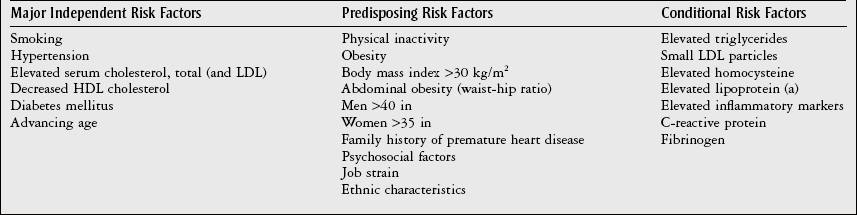
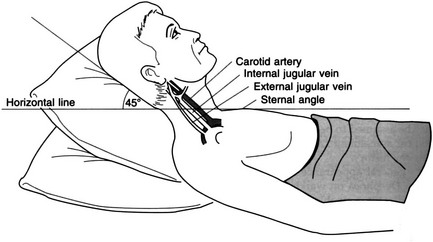
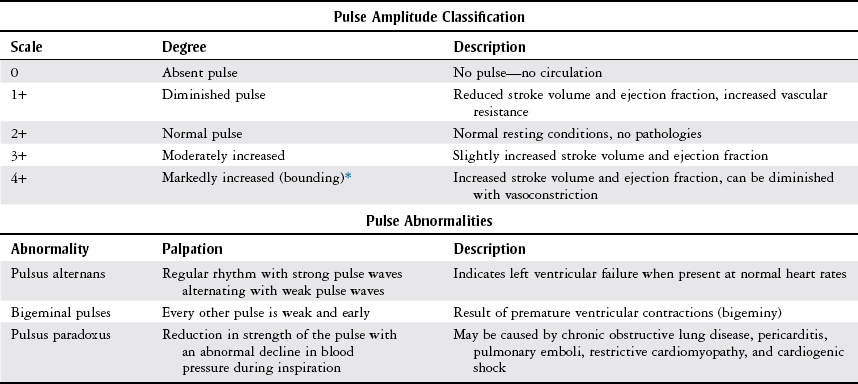
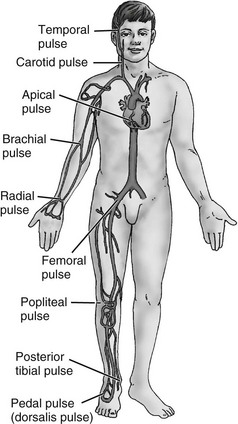
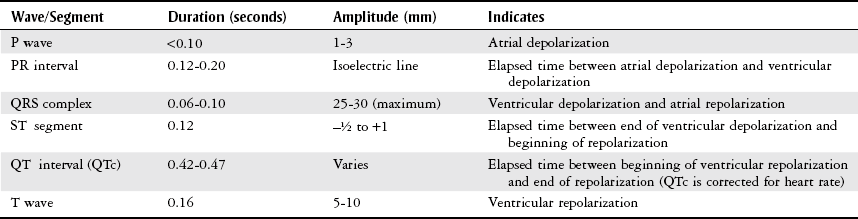
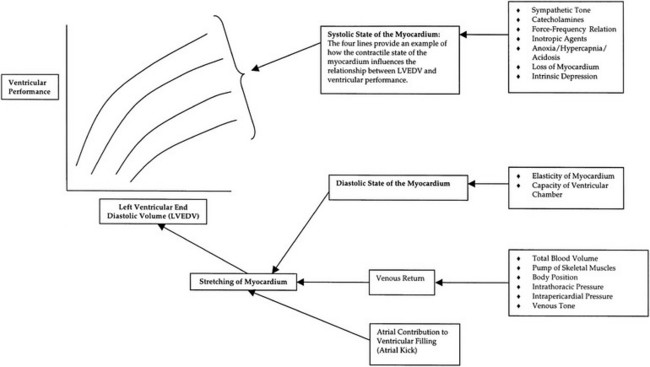
Chapter 3 The objectives of this chapter are the following: 1 Provide a brief overview of the structure and function of the cardiovascular system 2 Give an overview of cardiac evaluation, including physical examination and diagnostic testing 3 Describe cardiac diseases and disorders, including clinical findings and medical and surgical management 4 Establish a framework on which to base physical therapy evaluation and intervention in patients with cardiovascular disease • Primary Prevention/Risk Reduction for Cardiovascular/Pulmonary Disorders: 6A • Impaired Aerobic Capacity/Endurance Associated with Deconditioning: 6B • Impaired Aerobic Capacity/Endurance Associated with Cardiovascular Pump Dysfunction or Failure: 6D Please refer to Appendix A for a complete list of the preferred practice patterns, as individual patient conditions are highly variable and other practice patterns may be applicable. Physical therapists in acute care facilities commonly encounter patients with cardiac system dysfunction as either a primary morbidity or comorbidity. Recent estimates conclude that although the death rate associated with cardiovascular disease has declined in recent years, the overall burden of the disease remains high.1 Based on current estimates, 82,500,000 (more than one in three) Americans have one or more types of cardiovascular disease (CVD).1 In 2009 CVD ranked first among all disease categories and accounted for 6,165,000 hospital discharges.1 In the acute care setting, the role of the physical therapist with this diverse group of patients remains founded in examination, evaluation, intervention, and discharge planning for the purpose of improving functional capacity and minimizing disability. The physical therapist must be prepared to safely accommodate for the effects of dynamic (pathologic, physiologic, medical, and surgical intervention) changes into his or her evaluation and plan of care. The heart and the roots of the great vessels (Figure 3-1) occupy the pericardium, which is located in the mediastinum. The sternum, the costal cartilages, and the medial ends of the third to fifth ribs on the left side of the thorax create the anterior border of the mediastinum. It is bordered inferiorly by the diaphragm, posteriorly by the vertebral column and ribs, and laterally by the pleural cavity (which contains the lungs). Specific cardiac structures and vessels and their respective functions are outlined in Tables 3-1 and 3-2. TABLE 3-1 Primary Structures of the Heart TABLE 3-2 Great Vessels of the Heart and Their Function FIGURE 3-1 Anatomy of the right coronary artery and left coronary artery, including left main, left anterior descending, and left circumflex coronary arteries. (From Becker RC: Chest pain: the most common complaints series, Boston, 2000, Butterworth-Heinemann.) Note: The mediastinum and the heart can be displaced from their normal positions with changes in the lungs secondary to various disorders. For example, a tension pneumothorax shifts the mediastinum away from the side of dysfunction (see Chapter 4 for a further description of pneumothorax). The heart’s ability to pump blood depends on the following characteristics2: • Automaticity: The ability to initiate its own electrical impulse • Excitability: The ability to respond to electrical stimulus • Conductivity: The ability to transmit electrical impulse from cell to cell within the heart • Contractility: The ability to stretch as a single unit and then passively recoil while actively contracting • Rhythmicity: The ability to repeat the cycle in synchrony with regularity • Atrial diastole is the period of atrial filling. The flow of blood is directed by the higher pressure in the venous circulatory system. • Atrial systole is the period of atrial emptying and contraction. Initial emptying of approximately 70% of blood occurs as a result of the initial pressure gradient between the atria and the ventricles. Atrial contraction then follows, squeezing out the remaining 30%.3 This is commonly referred to as the atrial kick. • Ventricular diastole is the period of ventricular filling. It initially occurs with ease; then, as the ventricle is filled, atrial contraction is necessary to squeeze the remaining blood volume into the ventricle. The amount of stretch placed on the ventricular walls during diastole, referred to as left ventricular end diastolic pressure (LVEDP), influences the force of contraction during systole. (Refer to the Factors Affecting Cardiac Output section for a description of preload.) • Ventricular systole is the period of ventricular contraction. The initial contraction is isovolumic (meaning it does not eject blood), which generates the pressure necessary to serve as the catalyst for rapid ejection of ventricular blood. The left ventricular ejection fraction (EF) represents the percent of end diastolic volume ejected during systole and is normally approximately 60%.2 CO is the quantity of blood pumped by the heart in 1 minute. Regional demands for tissue perfusion (based on local metabolic needs) compete for systemic circulation, and total CO adjusts to meet these demands. Adjustment to CO occurs with changes in heart rate (HR—chronotropic) or stroke volume (SV—inotropic).3 Normal resting CO is approximately 4 to 8 liters per minute (L/min), with a resting HR of 70 beats per minute (bpm); resting SV is approximately 71 ml/beat.2 The maximum value of CO represents the functional capacity of the circulatory system to meet the demands of physical activity. CO also can be described relative to body mass as the cardiac index (CI), the amount of blood pumped per minute per square meter of body mass. Normal CI is between 2.5 and 4.2 L/min/m2. This wide normal range makes it possible for cardiac output to decline by almost 40% and still remain within the normal limits. Although several factors interrupt a direct correlation between CI and functional aerobic capacity, a CI below 2.5 L/min/m2 represents a marked disturbance in cardiovascular performance and is always clinically relevant.4 Preload is the amount of tension on the ventricular wall before it contracts. It is related to venous return and affects SV by increasing left ventricular end diastolic volume in addition to pressure and therefore contraction.2 This relationship is explained by the Frank-Starling mechanism and is demonstrated in Figure 3-2. The Frank-Starling mechanism defines the normal relationship between the length and tension of the myocardium.5 The greater the stretch on the myocardium before systole (preload), the stronger the ventricular contraction. The length-tension relationship in skeletal muscle is based on the response of individual muscle fibers; however, relationships between cardiac muscle length and tension consist of the whole heart. Therefore length is considered in terms of volume; tension is considered in terms of pressure. A greater volume of blood returning to the heart during diastole equates to greater pressures generated initially by the heart’s contractile elements. Ultimately facilitated by elastic recoil, a greater volume of blood is ejected during systole. The effectiveness of this mechanism can be reduced in pathologic situations.3 Afterload is the force against which a muscle must contract to initiate shortening.5 Within the ventricular wall, this is equal to the tension developed across its wall during systole. The most prominent force contributing to afterload in the heart is blood pressure (BP), specifically vascular compliance and resistance. BP affects aortic valve opening and is the most obvious load encountered by the ejecting ventricle. An example of afterload is the amount of pressure in the aorta at the time of ventricular systole.2 A schematic of the cardiac conduction system and a normal electrocardiogram (ECG) are presented in Figure 3-3. Normal conduction begins in the SA node and travels throughout the atrial myocardium (atrial depolarization) via intranodal pathways to the atrioventricular (AV) node, where it is delayed momentarily. It then travels to the bundle of His, to the bundle branches, to the Purkinje fibers, and finally to the myocardium, resulting in ventricular contraction.6 Disturbances in conduction can decrease CO (refer to the Health Conditions section for a discussion of rhythm and conduction disturbances).7 FIGURE 3-3 Schematic representation of the sequence of excitation in the heart. (From Walsh M, Crumbie A, Reveley S: Nurse practitioners: clinical skills and professional issues, Boston, 1999, Butterworth-Heinemann.) The SA node has its own inherent rate. However, neural input can influence HR, heart rate variability (HRV), and contractility through the autonomic nervous system.2,8 Parasympathetic system (vagal) neural input generally decelerates cardiac function, thus decreasing HR and contractility. Parasympathetic input travels through the vagus nerves. The right vagus nerve stimulates primarily the SA node and affects rate, whereas the left vagus nerve stimulates primarily the AV node and affects AV conduction.2,8 Sympathetic system neural input is through the thoracolumbar sympathetic system and increases HR and augment ventricular contractility, thus accelerating cardiac function.2 In response to physical activity or stress, a release in catecholamines increases HR, contractility, and peripheral vascular resistance for a net effect of increased cardiac function (Table 3-3).2 TABLE 3-3 Data from Guyton AC, Hall JE: Textbook of medical physiology, ed 12, Philadelphia, 2011, Saunders. Tissue pH, concentration of carbon dioxide (CO2), concentration of oxygen (O2), and metabolic products (e.g., lactic acid) can affect vascular tone.2 During exercise, increased levels of CO2, decreased levels of O2, decreased pH, and increased levels of lactic acid at the tissue level dilate local blood vessels and therefore increase CO distribution to that area. Baroreflexes are activated through a group of mechanoreceptors located in the heart, great vessels, and intrathoracic and cervical blood vessels. These mechanoreceptors are most plentiful in the walls of the internal carotid arteries.2 Mechanoreceptors are sensory receptors that are sensitive to mechanical changes such as pressure and stretch. Activation of the mechanoreceptors by high pressures results in an inhibition of the vasomotor center of the medulla that increases vagal stimulation. This chain of events is known as the baroreflex and results in vasodilation, decreased HR, and decreased contractility. Mechanoreceptors located in the right atrial myocardium respond to stretch. An increased volume in the right atrium results in an increase in pressure on the atrial wall. This reflex, known as the Bainbridge reflex, stimulates the vasomotor center of the medulla, which in turn increases sympathetic input and increases HR and contractility.2 Respiratory sinus arrhythmia, an increased HR during inspiration and decreased HR during expiration, may be facilitated by changes in venous return and SV caused by changes in thoracic pressure induced by the respiratory cycle. At the beginning of inspiration when thoracic pressure is decreased, venous return is greater; therefore a greater stretch is exerted on the atrial wall.9 Chemoreceptors located on the carotid and aortic bodies have a primary effect on increasing rate and depth of ventilation in response to CO2 levels, but they also have a cardiac effect. Changes in CO2 during the respiratory cycle also may result in sinus arrhythmia.2 For a review of the major coronary arteries, refer to Figure 3-1. Blood is pumped to the large superficial coronary arteries during ventricular systole. At this time, myocardial contraction limits the flow of blood to the myocardium; therefore myocardial tissue is perfused during diastole. For a review of the distribution of systemic circulation, refer to Figure 3-4. Systemic circulation is affected by total peripheral resistance (TPR), which is the resistance to blood flow by the force created by the aorta and arterial system. Two factors that contribute to resistance are (1) vasomotor tone, in which vessels dilate and constrict, and (2) blood viscosity, in which greater pressure is required to propel thicker blood. TPR, also called systemic vascular resistance, and CO influence BP.2 This relationship is illustrated in the following equation: FIGURE 3-4 Schematic of systemic circulation. (From Thibodeau GA: Structure and function of the body, ed 13, St Louis, 2007, Mosby.) In addition to the general chart review presented in Chapter 2 the following pertinent information about patients with cardiac dysfunction should be obtained before physical examination3,10–12: • Presence of chest pain (see Chapter 17 for an expanded description of characteristics and etiology of chest pain) • Character and quality (crushing, burning, numbing, hot) • Angina equivalents (what the patient feels as angina [e.g., jaw pain, shortness of breath, dizziness, lightheadedness, diaphoresis, burping, nausea, or any combination of these]) • Aggravating and alleviating factors • Medical treatment sought and its outcome • Presence of cardiac risk factors (Box 3-1) Box 3-1 Cardiac Risk Factors Primary and Secondary Prevention LDL, Low-density lipoprotein; HDL, high-density lipoprotein. Data from Grundy SM, Pasternak R, Greenland P et al: Assessment of cardiovascular risk by use of multiple-risk-factor assessment equations: a statement for healthcare professionals from the American Heart Association and the American College of Cardiology, Circulation 100:1481-1492, 1999; Belkic KL, Landsbergis PA et al: Is job strain a major source of cardiovascular disease risk? Scand J Work Environ Health 30(2):85-128, 2004. • Family history of cardiac disease • History of dizziness or syncope • Previous myocardial infarction (MI), cardiac studies, or procedures Key components of the observation portion of the physical examination include the following3,7: • Facial color, skin color and tone, or the presence of diaphoresis • Obvious signs of edema in the extremities • Signs of trauma (e.g., paddle burns or ecchymosis from cardiopulmonary resuscitation) • Presence of jugular venous distention (JVD), which results from the backup of fluid into the venous system from right-sided congestive heart failure (CHF) (Figure 3-5) FIGURE 3-5 Measurement of jugular venous distention (JVD). The JVD reading is the maximum height, in centimeters, above the sternal angle at which venous pulsations are visible. (Modified from Thompson JM, McFarland GK, Hirsch JE et al: Mosby’s clinical nursing, ed 5, St Louis, 2002, Mosby.) • Make sure the patient is in a semirecumbent position (45 degrees). • Have the patient turn his or her head away from the side being evaluated. • Observe pulsations in the internal jugular neck region. Pulsations are normally seen 3 to 5 cm above the sternum. Pulsations higher than this or absent pulsations indicate jugular venous distention. • Pulses for circulation quality, HR, and rhythm (Table 3-4, Figure 3-6) TABLE 3-4 Pulse Amplitude Classification and Pulse Abnormalities *Corrigan’s pulse is a bounding pulse visible in the carotid artery that occurs with aortic regurgitation. Data from Woods SL, Sivarajian-Froelicher ES, Underhill-Motzer S, editors: Cardiac nursing, ed 4, Philadelphia, 2000, Lippincott. FIGURE 3-6 Arterial pulses. (From Pierson FM: Principles and techniques of patient care, ed 4, St Louis, 2008, Saunders.) • Extremities for pitting edema bilaterally (Table 3-5) TABLE 3-5 Data from Woods SL, Sivarajian Froelicher ES, Underhill-Motzer S, editors: Cardiac nursing, ed 4, Philadelphia, 2000, Lippincott; Hillegass EA, Sadowsky HS, editors: Essentials of cardiopulmonary physical therapy, ed 2, Philadelphia, 2001, Saunders. BP measurement with a sphygmomanometer (cuff) and auscultation is an indirect, noninvasive measurement of the force exerted against the arterial walls during ventricular systole (systolic blood pressure [SBP]) and during ventricular diastole (diastolic blood pressure). BP is affected by peripheral vascular resistance (blood volume and elasticity of arterial walls) and CO. Table 3-6 lists normal BP ranges. Occasionally, BP measurements can be performed only on certain limbs secondary to the presence of conditions such as a percutaneous inserted central catheter, arteriovenous fistula for hemodialysis, blood clots, scarring from brachial artery cutdowns, or lymphedema (e.g., status post mastectomy). BP of the upper extremity should be measured in the following manner: TABLE 3-6 Data from Chobanian AV, Bakris GL et al: Seventh report of the Joint National Committee on prevention, detection, evaluation, and treatment of high blood pressure, Hypertension 42(6):1206-1252, 2003; American College of Sports Medicine, Armstrong LE, et al: ACSM’s guidelines for exercise testing and prescription, Philadelphia, 2005, Lippincott Williams & Wilkins. 1. Check for posted signs, if any, at the bedside that indicate which arm should be used in taking BP. BP variations of 5 to 10 mm Hg between the right and left upper extremity are considered normal. Patients with arterial compression or obstruction may have differences of more than 10 to 15 mm Hg.12 2. Use a properly fitting cuff. The inflatable bladder should have a width of approximately 40% and length of approximately 80% of the upper arm circumference.13 3. Position the cuff 2.5 cm above the antecubital crease. 4. Rest the arm at the level of the heart. 5. To determine how high to inflate the cuff, palpate the radial pulse, inflate until no longer palpable, and note the cuff inflation value. Deflate the cuff. 6. Place the bell of the stethoscope gently over the brachial artery. 7. Reinflate the cuff to 30 to 40 mm Hg greater than the value in step 5. Then slowly deflate the cuff. Cuff deflation should occur at approximately 2 to 3 mm Hg per second.13 8. Listen for the onset of tapping sounds, which represents blood flow returning to the brachial artery. This is the systolic pressure. 9. As the pressure approaches diastolic pressure, the sounds will become muffled and in 5 to 10 mm Hg will be completely absent. These sounds are referred to as Korotkoff sounds (Table 3-7).12,13 TABLE 3-7 Data from Woods SL, Sivarajian-Froelicher ES, Underhill-Motzer S, editors: Cardiac nursing, ed 4, Philadelphia, 2000, Lippincott, 2000; Bickley LS, Szilagyi PG: Bates’ guide to physical examination and history taking, Philadelphia, 2003, Lippincott Williams & Wilkins. In situations when it is difficult to auscultate or discern a distinct diastolic pressure, the patient’s blood pressure may be noted as systolic BP/P (i.e., “BP is 90 over palp”) or systolic BP over 2 diastolic pressures (e.g., 140/85/62) denoting the onset of muffling sounds and the disappearance of sounds.13 • Recording preexertion, paraexertion, and postexertion BP is important for identification of BP responses to activity. During recovery from exercise, blood vessels dilate to allow for greater blood flow to muscles. In cardiac-compromised or very deconditioned individuals, total CO may be unable to support this increased flow to the muscles and may lead to decreased output to vital areas, such as the brain. • If you are unable to obtain BP on the arm, the thigh is an appropriate alternative, with auscultation at the popliteal artery. • Falsely high readings occur if the cuff is too small or applied loosely, or if the brachial artery is lower than the heart level. • Evaluation of BP and HR in different postures can be used to monitor orthostatic hypotension with repeat measurements on the same arm 1 to 5 minutes after position changes. The symbols that represent patient position are shown in Figure 3-7. • The same extremity should be used when serial BP recordings will be compared for an evaluation of hemodynamic response. • A BP record is kept on the patient’s vital sign flow sheet. This is a good place to check for BP trends throughout the day and, depending on your hospital’s policy, to document BP changes during the therapy session. • An auscultatory gap is the disappearance of sounds between phase 1 and phase 2 and is common in patients with high BP, venous distention, and severe aortic stenosis. Its presence can create falsely low systolic pressures if the cuff is not inflated enough (prevented by palpating for the disappearance of the pulse before measurement), or falsely high diastolic pressures if the therapist stops measurement during the gap (prevented by listening for the phase 3 to phase 5 transitions).13 Evaluation of heart sounds can yield information about the patient’s condition and tolerance to medical treatment and physical therapy through the evaluation of valvular function, rate, rhythm, valvular compliance, and ventricular compliance.3 To listen to heart sounds, a stethoscope with a bell and a diaphragm is necessary. For a review of normal and abnormal heart sounds, refer to Table 3-8. The examination should follow a systematic pattern using the bell (for low-pitched sounds) and diaphragm (for high-pitched sounds) and should cover all auscultatory areas, as illustrated in Figure 3-8. Abnormal sounds should be noted with a description of the conditions in which they were heard (e.g., after exercise or during exercise). TABLE 3-8 Normal and Abnormal Heart Sounds Data from Bickley LS, Szilagyi PG: Bates’ guide to physical examination and history taking, Philadelphia, 2003, Lippincott Williams & Wilkins. FIGURE 3-8 Areas for heart sound auscultation. (Courtesy Barbara Cocanour, PhD, University of Massachusetts, Lowell, Department of Physical Therapy.) • Always ensure proper function of a stethoscope by tapping the diaphragm before use with a patient. • Avoid rubbing the stethoscope on extraneous objects because this can add noise and detract from the examination. • Avoid auscultation of heart sounds over clothing, which can muffle the intensity of normal and abnormal sounds. • If the patient has an irregular cardiac rhythm, determine HR through auscultation (apical HR). To save time, listen for the HR during a routine auscultatory examination with the stethoscope’s bell or diaphragm in any of the auscultation locations (see Figure 3-8). • Heart sounds can be heard online at the Auscultation Assistant, available at: http://www.med.ucla.edu/wilkes/intro.html. Oximetry (SaO2) is used to evaluate indirectly the oxygenation of a patient and can be used to titrate supplemental oxygen. Refer to Chapter 4 for a further description of oximetry. An ECG provides a graphic analysis of the heart’s electrical activity. The ECG commonly is used to detect arrhythmias, heart blocks, and myocardial perfusion. It also can detect atrial or ventricular enlargement. An ECG used for continuous monitoring of patients in the hospital typically involves a 3- to 5-lead system. A lead represents a particular portion, or “view,” of the heart. The patient’s rhythm usually is displayed in his or her room, in the hall, and at the nurses’ station. Diagnostic ECG involves a 12-lead analysis, the description of which is beyond the scope of this book. For a review of basic ECG rate and rhythm analysis, refer to Table 3-9 and Figure 3-3. TABLE 3-9 Electrocardiograph Interpretation Data from Meyers RS, editor: Saunders manual of physical therapy practice, Philadelphia, 1995, Saunders; Aehlert B, editor: ACLS quick review study guide, St Louis, 1994, Mosby; Davis D, editor: How to quickly and accurately master ECG interpretation, ed 2, Philadelphia, 1992, Lippincott Williams & Wilkins. Holter monitoring is 24- or 48-hour ECG analysis conducted to detect cardiac arrhythmias and corresponding symptoms during a patient’s daily activity.12 Holter monitoring is different than telemetric monitoring because the ECG signal is recorded and later analyzed. HRV has been discussed in the literature to possibly reflect cardiac autonomic nervous system regulation. A common overall measure of HRV is the standard deviation of all RR intervals on an ECG during a 24-hour period (SDNN).8 Evidence regarding the potential clinical utility of HRV for cardiology is growing; however, it continues to be used primarily in research.14 In healthy populations, low HRV is a risk factor for all causes of cardiac mortality15–17 and for new onset of hypertension.18 Low HRV is also a risk for mortality in patients who have had an MI19–21 or have coronary artery disease22 or CHF.23 Evidence suggests that altered HRV during exercise may provide valuable information for risk assessment.24 This is likely related to the increasingly accepted relationship between delayed heart rate recovery (HRR) after exercise and cardiac risk. Delayed HRR (<46 bpm) 3 minutes after an exercise test is a predictor of long-term (~15 years) mortality.25 HRR is discussed further in the section on Physical Therapy Intervention. Relevant values from the complete blood cell count are hematocrit, hemoglobin, and white blood cell counts. Hematocrit refers to the number of red blood cells per 100 ml of blood and therefore fluctuates with changes in the total red blood cell count (hemoglobin) and with blood volume (i.e., reduced plasma volume results in relatively more red blood cells in 100 ml of blood). Elevated levels of hematocrit (which may be related to dehydration) indicate increased viscosity of blood that can potentially impede blood flow to tissues.12 Hemoglobin is essential for the adequate oxygen-carrying capacity of the blood. A decrease in hemoglobin and hematocrit levels (10% below normal is called anemia) may decrease activity tolerance or make patients more susceptible to ischemia secondary to decreased oxygen-carrying capacity.11,26 Slight decreases in hematocrit resulting from adaptations to exercise (with no change in hemoglobin) are related to increases in blood volume. The concomitant exercise-related decreases in blood viscosity may be beneficial to post-MI patients.27 Elevated white blood cell counts can indicate that the body is fighting infection, or they can occur with inflammation caused by cell death, such as in MI. Erythrocyte sedimentation rate (ESR), another hematologic test, is a nonspecific index of inflammation and commonly is elevated for 2 to 3 weeks after MI.26 Refer to Chapter 7 for more information about these values. Coagulation profiles provide information about the clotting time of blood. Patients who undergo treatment with thrombolytic therapy after the initial stages of MI or who are receiving anticoagulant therapy because of various cardiac arrhythmias require coagulation profiles to monitor anticoagulation in an attempt to prevent complications such as bleeding. The physician determines the patient’s therapeutic range of anticoagulation using the prothrombin time (PT), partial thromboplastin time, and international normalized ratio.26 Refer to Chapter 7 for details regarding these values and their significance to treatment. Patients with low PT and partial thromboplastin time are at higher risk of thrombosis, especially if they have arrhythmias (e.g., atrial fibrillation) or valvular conditions (e.g., mitral regurgitation) that produce stasis of the blood. Patients with a PT greater than 2.5 times the reference range should not undergo physical therapy because of the potential for spontaneous bleeding. Likewise, an international normalized ratio of more than 3 warrants asking the physician if treatment should be withheld.26 Elevated total cholesterol levels in the blood are a significant risk factor for atherosclerosis and therefore ischemic heart disease.28 Measuring blood cholesterol level is necessary to determine the risk for development of atherosclerosis and to assist in patient education, dietary modification, and medical management. Normal values can be adjusted for age; however, levels of total cholesterol more than 240 mg/dl are generally considered high, and levels of less than 200 mg/dl are considered normal. A blood lipid analysis categorizes cholesterol into high-density lipoproteins (HDLs) and low-density lipoproteins (LDLs) and provides an analysis of triglycerides. HDLs are formed by the liver and are considered beneficial because they are readily transportable and do not adhere to the intimal walls of the vascular system. People with higher amounts of HDLs are at lower risk for coronary artery disease.26,28 HDL levels of less than 33 mg/dl carry an elevated risk of heart disease. A more important risk for heart disease is an elevated ratio of total cholesterol to HDL. Normal ratios of total cholesterol to HDL range from 3 to 5.12 LDLs are formed by a diet excessive in fat and are related to a higher incidence of coronary artery disease. LDLs are not as readily transportable as HDLs because LDLs adhere to intimal walls in the vascular system.26 Normal LDL levels are below 100 mg/dl.12 Triglycerides are fat cells that are free floating in the blood. When not in use, they are stored in adipose tissue. A person’s triglyceride levels increase after he or she eats foods high in fat and decrease with exercise. High levels of triglycerides are associated with a risk of coronary heart disease.26 C-reactive protein (CRP) is a test that measures the amount of a protein in the blood that signals acute inflammation. To determine a person’s risk for heart disease, a more sensitive CRP test called a high-sensitivity C-reactive protein (hs-CRP) assay is available. A growing number of studies have determined that high levels of hs-CRP consistently predict recurrent coronary events in patients with unstable angina (USA) and acute MI. In addition, elevated hs-CRP levels are associated with lower survival rates in these patients with cardiovascular disease.29–31 Parameters for hs-CRP are as follows: • hs-CRP lower than 1.0 mg/L indicates a low risk of developing cardiovascular disease • hs-CRP between 1.0 and 3.0 mg/L indicates an average risk of developing cardiovascular disease • hs-CRP higher than 3.0 mg/L indicates a high risk of developing cardiovascular disease
Cardiac System
Preferred Practice Patterns
Body Structure and Function
Structure
Description
Function
Pericardium
Double-walled sac of elastic connective tissue, a fibrous outer layer, and a serous inner layer
Protects against infection and trauma
Epicardium
Outermost layer of cardiac wall, covers surface of heart and great vessels
Protects against infection and trauma
Myocardium
Central layer of thick muscular tissue
Provides major pumping force of the ventricles
Endocardium
Thin layer of endothelium and connective tissue
Lines the inner surface of the heart, valves, chordae tendineae, and papillary muscles
Right atrium
Heart chamber
Receives blood from the venous system and is a primer pump for the right ventricle
Tricuspid valve
Atrioventricular valve between right atrium and ventricle
Prevents back flow of blood from the right ventricle to the atrium during ventricular systole
Right ventricle
Heart chamber
Pumps blood to the pulmonary circulation
Pulmonic valve
Semilunar valve between right ventricle and pulmonary artery
Prevents back flow of blood from the pulmonary artery to the right ventricle during diastole
Left atrium
Heart chamber
Acts as a reservoir for blood and a primer pump for the left ventricle
Mitral valve
Atrioventricular valve between left atrium and ventricle
Prevents back flow of blood from the left ventricle to the atrium during ventricular systole
Left ventricle
Heart chamber
Pumps blood to the systemic circulation
Aortic valve
Semilunar valve between left ventricle and aorta
Prevents back flow of blood from the aorta to the left ventricle during ventricular diastole
Chordae tendineae
Tendinous attachment of atrioventricular valve cusps to papillary muscles
Prevents valves from everting into the atria during ventricular systole
Papillary muscle
Muscle that connects chordae tendineae to floor of ventricle wall
Constricts and pulls on chordae tendineae to prevent eversion of valve cusps during ventricular systole
Structure
Description
Function
Aorta
Primary artery from the left ventricle that ascends and then descends after exiting the heart
Ascending aorta delivers blood to neck, head, and arms
Descending aorta delivers blood to visceral and lower body tissues
Superior vena cava
Primary vein that drains into the right atrium
Drains venous blood from head, neck, and upper body
Inferior vena cava
Primary vein that drains into the right atrium
Drains venous blood from viscera and lower body
Pulmonary artery
Primary artery from the right ventricle
Carries blood to lungs
Cardiac Cycle
Cardiac Output

Factors Affecting Cardiac Output
Preload.
Frank-Starling Mechanism.
Afterload.
Cardiac Conduction System
Neural Input.
Endocrine Input.
Local Input.
Cardiac Reflexes
Coronary Perfusion
Systemic Circulation

Cardiac Evaluation
Patient History
Physical Examination
Observation
Palpation
Scale
Degree
Description
1+ Trace
Slight
Barely perceptible depression
2+ Mild
0-0.6 cm
Easily identified depression (EID) (skin rebounds in <15 sec)
3+ Moderate
0.6-1.3 cm
EID (rebound 15-30 sec)
4+ Severe
1.3-2.5 cm
EID (rebound >30 sec)
Blood Pressure
Age Ranges
Systolic
Diastolic
Age 8 years
85-114 mm Hg
52-85 mm Hg
Age 12 years
95-135 mm Hg
58-88 mm Hg
Adult
<120 mm Hg
<80 mm Hg
Prehypertension
120-139 mm Hg
80-89 mm Hg
Hypertension
Stage 1
140-159 mm Hg
90-99 mm Hg
Stage 2
≥160 mm Hg
≥100 mm Hg
Normal exercise
Increases 5-12 mm Hg per MET increase in workload
±10 mm Hg
Phase
Sound
Indicates
1
First sound heard, faint tapping sound with increasing intensity
Systolic pressure (blood starts to flow through compressed artery)
2
Start swishing sound
Blood flow continues to be heard; sounds are beginning to change because of the changing compression on the artery
3
Sounds increase in intensity with a distinct tapping
Blood flow is increasing as artery compression is decreasing
4
Sounds become muffled
Diastolic pressure in children <13 years of age and in adults who are exercising, pregnant, or hyperthyroid (see phase 5)
5
Disappearance
Diastolic pressure in adults—occurs 5-10 mm Hg below phase 4 in normal adults. In states of increased rate of blood flow, it may be >10 mm Hg below phase 4. In these cases, the phase 4 sound should be used as diastolic pressure in adults.
 Clinical Tip
Physical Therapy Considerations
Auscultation
Sound
Location
Description
S1 (normal)
All areas
First heart sound; signifies closure of atrioventricular valves and corresponds to onset of ventricular systole
S2 (normal)
All areas
Second heart sound; signifies closure of semilunar valves and corresponds with onset of ventricular diastole
S3 (abnormal)
Best appreciated at apex
Immediately following S2; occurs early in diastole and represents filling of the ventricle. In young, healthy individuals, it is considered normal and called a physiologic third sound. In the presence of heart disease, it results from decreased ventricular compliance (a classic sign of congestive heart failure)
S4 (abnormal)
Best appreciated at apex
Immediately preceding S1; occurs late in ventricular diastole; associated with increased resistance to ventricular filling; common in patients with hypertensive heart disease, coronary heart disease, pulmonary disease, or myocardial infarction, or following coronary artery bypass grafts
Murmur (abnormal)
Over respective valves
Indicates regurgitation of blood through valves; can also be classified as systolic or diastolic murmurs. Common pathologies resulting in murmurs include mitral regurgitation and aortic stenosis
Pericardial friction rub (abnormal)
Third or fourth intercostal space, anterior axillary line
Sign of pericardial inflammation (pericarditis), associated with each beat of the heart; sounds like a creak or leather being rubbed together
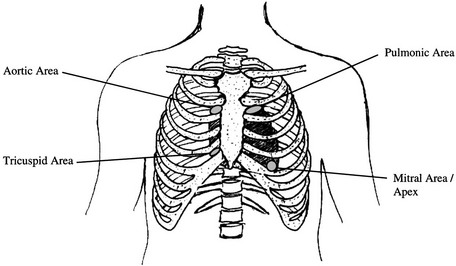
Physical Therapy Considerations
Diagnostic and Laboratory Measures
Oximetry
Electrocardiogram
Holter Monitoring.
Heart Rate Variability.
Complete Blood Cell Count
Coagulation Profiles
Blood Lipids
C-Reactive Protein
![]()
Stay updated, free articles. Join our Telegram channel

Full access? Get Clinical Tree


Cardiac System
 Clinical Tip
 Clinical Tip
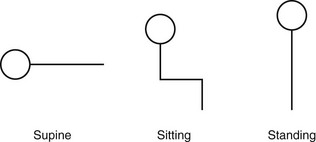
 Clinical Tip
 Clinical Tip
Only gold members can continue reading. Log In or Register to continue

