Task
Inman
Poppen
Charlton
Yanagawa
Van der Helm
Anglin
Pandy
Abduction
0.86 BW
0.75 BW
0.65 BW
0.55 BW
Scaption
0.8 BW
Lifting box
1.8 BW
1.6 BW
Lifting suitcase
2.4 BW
1.8 BW
Walking cane
1.7 BW
1.1 BW
Standing up
1.8 BW
0.7 BW
Sitting down
1.3 BW
0.7 BW
Max abduction
4.1 BW
Max adduction
3.3 BW
Max flexion
3.7 BW
Max extension
2.7 BW
Biomechanics of the Normal Shoulder
Our group has used a combination of experimental and computational techniques to gain a more comprehensive understanding of muscle and joint function in the normal shoulder. A detailed three-dimensional musculoskeletal model of the shoulder joint complex was used to calculate the forces developed by the individual muscles and the forces transmitted across the glenohumeral joint during various tasks, for example, abduction of the shoulder in the scapular plane, walking with a cane, and rising from a chair. Details of this model and the results derived from it are summarized below.
Musculoskeletal Model of the Shoulder
The model was developed from high-resolution medical images (color-cryosection photographs and computed tomography images) of a human male cadaver obtained from the National Library of Medicine through the Visible Human Male (VHM) dataset. The dataset was compiled from hundreds of transverse sections taken at 1-mm intervals over the entire body (approximately 1800 slices in all). Three-dimensional surfaces of the bones and muscles from the shoulder girdle down to the wrist were reconstructed in the form of dense triangle meshes and subsequently decimated using a geometry-preserving algorithm to reduce the mesh density by approximately 90 %.
The three joints comprising the shoulder girdle—the sternoclavicular joint, the acromioclavicular joint, and the glenohumeral joint—were each represented as a 3 degree-of-freedom, ball-and-socket joint in the model. The center of the sternoclavicular joint was located near the medial side of the clavicular attachment of the costoclavicular ligament. The center of the acromioclavicular joint was located between the lateral end of the clavicle and the medial side of the acromion process. The center of the glenohumeral joint was located at the center of the spherically shaped humeral head in the model. The joint axes for these three joints were aligned with the axes of the body-fixed reference frames selected for bones adjacent to each joint. The model of the scapulothoracic joint was based on that described by Van der Helm et al. [21]. The scapula was constrained to move on the thorax by two scapula-fixed points: one located at the inferior end of the scapula and the other at the base of the scapular spine.
Eighteen muscle subregions were used to represent the lines of action of 11 muscle groups spanning the glenohumeral joint (Fig. 7.1). The path of each muscle subregion was calculated by taking into account the way in which it wraps around the underlying bones and other muscles [22]. Each muscle–tendon unit was modeled as a three-element muscle in series with tendon. Four parameters were used to specify the force-producing properties of each muscle: peak isometric force and the corresponding fiber length and pennation angle of muscle, and tendon rest length [23]. The fiber length at which muscle develops its peak isometric force is called the optimal muscle-fiber length. This parameter, together with tendon rest length, was estimated by matching the maximum isometric torque-angle curves for each joint in the model to corresponding torque-angle curves obtained from in vivo experiments performed on healthy young males [24].
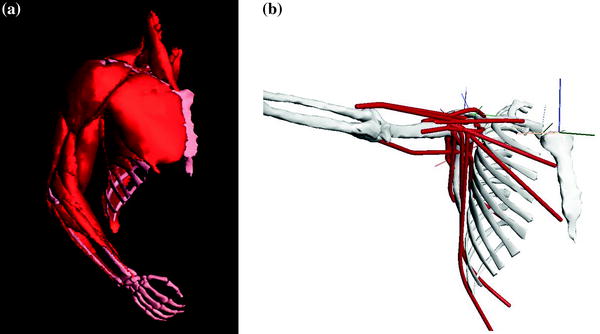
Fig. 7.1
Computer-generated rendering of the reconstructed muscle and bone surfaces used to represent the upper-limb model developed by Garner and Pandy [18]. Eighteen muscle bundles were used to represent the lines of actions of 11 muscle groups spanning the glenohumeral joint. The muscles included in the model are as follows: anterior, middle, and posterior deltoid, pectoralis major (clavicle, sternal, and ribs portions), supraspinatus, infraspinatus, subscapularis, teres minor and major, long and short head of biceps brachii, long head of triceps brachii, latissimus dorsi (thoracic, lumbar, and iliac portions), and coracobrachialis. Reproduced from Garner and Pandy [18] and Yanagawa et al. [26]
Muscle Moment Arms
Of all the muscles crossing the shoulder in the model, the middle deltoid and supraspinatus have the largest moment arms in abduction, consistent with experimental data reported in the literature. Peak moment arms calculated for the supraspinatus and middle deltoid during scapular-plane abduction are, respectively, 27 mm at 30° of abduction and 32 mm at 75° of abduction (Fig. 7.2a, b), compared with 30 mm for the supraspinatus at 30° abduction and 27 mm for the middle deltoid at 60° abduction obtained from tendon excursion experiments reported by Liu et al. [3]. The anterior subregion of the deltoid also has a relatively large abduction moment arm in the model, particularly at angles greater than 60° of scapular-plane abduction (not shown in Fig. 7.2). While Liu et al. [3] and Otis et al. [25] found that the anterior subregion of the deltoid has a smaller moment arm than the middle deltoid, the model results are consistent with experimental data reported by Poppen and Walker [14] and Ackland et al. [6], who found that the abduction moment arm of anterior deltoid exceeds that of middle deltoid for abduction of the shoulder in the scapular plane.
Fig. 7.2
Moment arms of selected muscles crossing the normal glenohumeral joint for abduction in the scapular plane. Moment arms are shown for supraspinatus (a), middle deltoid (b), posterior deltoid (c), and subscapularis (d) for humeral abduction in the scapular plane. The abduction angle is the angle between the humerus and the scapula in the scapular plane. Zero degrees of abduction are when the humerus is held alongside the torso and the scapula is in its natural resting position with respect to the torso. Abduction moment arms are positive; adduction moment arms are negative. The black solid lines are results obtained for the model developed by Garner and Pandy [18] (see Fig. 7.1). Data obtained from cadaver experimental studies reported in the literature are indicated in the legend. The discontinuous slope obtained for the middle deltoid in the model (black solid line in b) occurs because this muscle loses contact with the humeral head as the humerus is abducted beyond 45 in the scapular plane. Modified from Garner and Pandy [18]
In contrast to the behavior of the anterior and middle deltoid, the posterior subregion is a strong adductor of the shoulder for nearly all abduction angles in the scapular plane (Fig. 7.2c). Peak adduction moment arm for the posterior deltoid occurs at 0° of abduction and decreases uniformly throughout the joint range of motion, until the muscle becomes a weak abductor at angles beyond approximately 80° of abduction. This behavior is consistent with that obtained from tendon excursion measurements performed by Otis et al. [25], Liu et al. [3], and Ackland et al. [6].
Infraspinatus behaves as a relatively strong abductor in the model for all angles of scapular-plane abduction. Subscapularis acts as a relatively weak abductor as the arm is elevated to 60° of abduction in the scapular plane, and thereafter, this muscle functions as a relatively weak adductor (Fig. 7.2d). These results are also consistent with the results of tendon excursion experiments reported by Otis et al. [25], Liu et al. [3], and Ackland et al. [6]. At small angles of abduction, the moment arm of the infraspinatus is considerably larger than that of the subscapularis; for example, the peak abduction moment arm of the superior subregion of the infraspinatus has been measured to be approximately 20 mm at 2.5° of abduction, compared to 10 mm for the superior subregion of the subscapularis at the same angle of abduction in the scapular plane [6].
Muscle and Joint Loading During Physical Activity
The model shown in Fig. 7.1 was used to calculate the forces developed by the individual muscles crossing the shoulder and the corresponding force transmitted by the glenohumeral joint for abduction in the scapular plane [26]. Bone positions were measured in one healthy subject by inserting Steinman pins into the clavicle, scapula, and humerus. A triad of reflective markers was attached to each pin, and the three-dimensional coordinates of these markers were measured using a video motion-capture system [27]. The measured bone positions were used as input to the model, and muscle forces were calculated by solving an optimization problem. The optimization problem was to minimize the sum of the squares of all the muscle activations in the model [28] subject to the following two conditions: (1) that the arm is held in static equilibrium and (2) that the line of action of the resultant force acting at the glenohumeral joint intersects the glenoid surface in the model. The latter condition was imposed to ensure that the contact force calculated in the model acts to press the humeral head into the glenoid and prevents joint disarticulation. The model was also used to calculate muscle and joint loading for various other tasks including lifting a 2.5 kg weight in forward flexion; rising up from and sitting down into a chair; and maximum isometric contractions of the muscles crossing the shoulder during abduction, adduction, flexion, and extension.
The model calculations indicate that the middle deltoid is the prime mover of the arm in abduction. The maximum force developed by the middle deltoid was 378 N at 75° of shoulder abduction [26]. Total body weight for the VHM cadaver was 90 kg or 883 N. The weight of the upper limb is approximated as 5.2 % of total body weight or 46 N [14]. Thus, a peak middle deltoid force of 378 N corresponds to a force of approximately 8 times the weight of the upper limb for the VHM cadaver (Fig. 7.3a). The forces developed by the anterior and posterior subregions of the deltoid were practically zero during abduction in the scapular plane.
Fig. 7.3
Individual muscle forces (a) and the corresponding torques (b) calculated by the model shown in Fig. 7.1 for humeral abduction in the scapular plane. Muscle forces reported by Yanagawa et al. [26] were normalized by dividing by the weight of the upper limb, while muscle torques were normalized by dividing by the weight of the upper limb multiplied by the length of the upper limb. The weight of the upper limb was assumed to be 5.2 % of the weight of the whole body, and the length of the upper limb was taken to be 30 cm. Modified from Yanagawa et al. [26]
The middle deltoid exerted a much larger abductor torque about the shoulder than any other muscle crossing the joint, with a peak torque of 14 Nm occurring at 75° of abduction. Normalizing this muscle torque by dividing by the weight of the upper limb multiplied by the length of the upper limb yields a peak torque of 1.0 Nm/Nm (Fig. 7.3b), where the length of the upper limb was taken to be 30 cm. Infraspinatus and subscapularis were the only other muscles that developed significant forces during abduction, but these muscles exerted relatively small torques about the shoulder (Fig. 7.3b).
The peak resultant force acting at the glenohumeral joint was 575 N at 105° of abduction, corresponding to 12.5 times the weight of the upper limb. The muscles crossing the shoulder acted to provide a predominantly compressive force at the joint; peak compressive force was around 500 N (11 times the weight of the upper limb) at 105° of abduction. The shear forces acting along the face of the glenoid were directed anteriorly and superiorly for most of the range of joint motion.
Inman et al. [1] estimated a peak deltoid force of approximately 8 times the weight of the upper limb at 90° of coronal-plane abduction. The corresponding peak resultant force acting at the glenohumeral joint was approximately 10.5 times the weight of the upper limb. Poppen and Walker [14] did not report the force developed by the deltoid muscle; however, the peak force calculated at the glenohumeral joint during abduction in the scapular plane was around 15 times the weight of the upper limb. Our estimates of the deltoid force and the force transmitted by the glenohumeral joint during scapular-plane abduction are consistent with these results. The peak force developed by the middle deltoid was very similar to that calculated by Inman et al. [1], whereas the peak force acting at the glenohumeral joint (12.5 times the weight of the upper limb) was slightly higher than that reported by Inman et al. [1] and slightly lower than that calculated by Poppen and Walker [14].
The model shown in Fig. 7.1 was also used to estimate muscle and joint contact loading at the shoulder for various functional activities, specifically lifting a 2.5-kg box, lifting a 10-kg suitcase, walking with a cane, standing up from a chair, and sitting down into a chair. Table 7.1 summarizes the peak glenohumeral joint reaction force obtained from the model for each task together with corresponding results obtained by Anglin et al. [20]. These authors reported mean peak glenohumeral joint reaction forces ranging from 1.3 to 2.4 BW (~900 to 1700 N) for the five functional tasks examined. Lifting a 10-kg suitcase resulted in the highest joint reaction forces, with peak forces as high as 3.5 BW transmitted between the humeral head and glenoid. Sitting down into a chair was found to be less demanding than standing up from a chair in terms of the reaction forces induced at the shoulder (mean peak forces of 1.3 BW and 1.8 BW, respectively). Each of the functional tasks examined by Anglin et al. [20] induced greater loads on the shoulder than those calculated for unloaded arm elevation during abduction, where the peak force transmitted across the glenohumeral joint remained less than 1 BW (see Table 7.1).
Our model calculations are in general agreement with those reported by Anglin et al. [20]. The resultant glenohumeral joint reaction force calculated for lifting a 2.5-kg box with one hand and lifting a 10-kg suitcase with one hand are comparable to the results reported by Anglin et al. [20] for six subjects. The model predicted a resultant glenohumeral joint force of 1390 N (1.6 BW) for lifting a 2.5-kg box, while the average resultant glenohumeral joint force calculated from the data reported by Anglin et al. [20] is 1296 N (1.8 BW). The model also predicted a resultant glenohumeral joint force of 1611 N (1.8 BW) for lifting a 10-kg suitcase compared to an average resultant glenohumeral joint force of 1684 N (2.4 BW) calculated from the data reported by Anglin et al. [20].
Related posts:
 Intact Rotator Cuff
Origins of Reverse Shoulder Arthroplasty and Common Misconceptions
1 History of Reverse Shoulder Arthroplasty
6 Preoperative Work-up and Surgical Approaches for Reverse Shoulder Arthroplasty
23 Debate: Patient-Specific Instrumentation Is Necessary versus It Is Not Necessary in All Cases
28 The Use of Convertible Glenoid Component Makes Revision to Reverse Total Shoulder Arthroplasty Easier
Intact Rotator Cuff
Origins of Reverse Shoulder Arthroplasty and Common Misconceptions
1 History of Reverse Shoulder Arthroplasty
6 Preoperative Work-up and Surgical Approaches for Reverse Shoulder Arthroplasty
23 Debate: Patient-Specific Instrumentation Is Necessary versus It Is Not Necessary in All Cases
28 The Use of Convertible Glenoid Component Makes Revision to Reverse Total Shoulder Arthroplasty Easier
Stay updated, free articles. Join our Telegram channel

Full access? Get Clinical Tree


