Fig. 4.1
Specimen mounted on six degree-of-freedom spine tester with rigid body markers for motion tracking
Range of Motion
Plexiglass markers, each having three infrared light-emitting diodes, were secured rigidly to L3, L4, L5, sacrum, left iliac crest, and right iliac crest via bone screws to track motion using the Optotrak Certus (NDI, Inc., Waterloo, Canada) motion analysis system. The location of the markers (denoting a rigid body) is aligned approximately sagittal along the curvature of the spine. The Optotrak Certus software superimposes the coordinate systems of two adjacent vertebral bodies in order to inferentially determine the relative Eulerian rotations in each of the three planes.
Surgical Reconstruction Groups
All specimens were tested intact with no damage to ligaments or bones. The REVERE® Stabilization System (Globus Medical Inc., Audubon, PA) was used for the 5.5 mm-diameter rigid titanium rod construct. Each of the seven specimens were tested in the following order: (1) intact; (2) left side sacrotuberous ligament (cephalad portion) injury (L-STL cut); (3) left side dorsal sacroiliac and interosseous ligaments injury (L-DSIL + L-IL cut), with the cumulative injury resulting in a transection of the entire left posterior ligament complex (L-PL complex cut); and (4) L5–S1 rigid instrumentation (L5–S1 rigid) placed adjacent to the posterior ligament injured SIJ. L-STL cut construct was performed by carefully dissecting the cephalad portion of the sacrotuberous ligament at a point just below the posterior superior iliac spine. Rongeur and a scalpel were used to completely transect the ligament (Fig. 4.2).
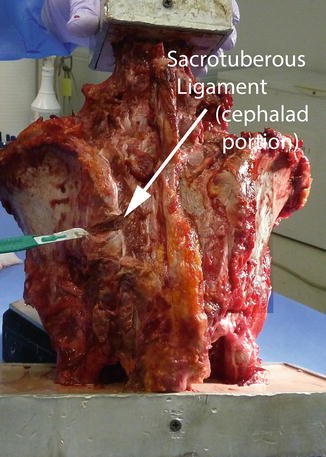
Fig. 4.2
Specimen with transected posterior sacrotuberous ligament (cephalad portion)
The L-PL complex cut construct was created by inserting the scalpel into the entire junction of the posterior iliac crest and sacrum from its most cephalad to its most caudal borders transecting all of dorsal sacroiliac and interosseous ligaments down to the joint (Fig. 4.3).
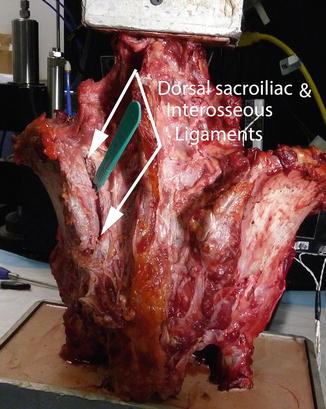
Fig. 4.3
Specimen, with previous transection of the posterior sacrotuberous ligament, now with the additional transection of the dorsal sacroiliac ligament and the interosseous ligament. This constitutes a transection of the entire posterior supporting ligament structure for the SIJ
Statistical Analysis
The data points include one range of motion measurement per specimen, under uniform stresses, for three different directions. These measurements were taken at each of the ten stages mentioned above, including intact, simulated injuries and stabilization constructs. For raw data, see Appendix B.
To test the hypotheses, analysis involved paired comparisons of range of motion measurements between each of the first four successive measurements. The Shapiro–Wilks normality test was applied to the measurements for each stage to check assumptions of the paired t-test. While more than half of the individual samples were found to diverge significantly from normality, it is acknowledged that the power of any such test is rather limited for such a small sample size. Therefore, the Wilcoxon sign test was also implemented. Note the agreement of significance (at α = 0.05) between the two tests in Table 4.1.
Table 4.1
Comparisons of range of motion measurements
Flexion–extension | Intact → STL cut | STL cut → PLC cut | PLC cut → L5–S1 rods |
Change in ROM tested | Increase | Increase | Increase |
t-stat (p-val) | 0.0258 | 0.0316 | 0.0082 |
W-sgn (p-val) | 0.0391 | 0.0078 | 0.0078 |
Significance | Yes | Yes | Yes |
Lateral bend | Intact → STL cut | STL cut → PLC cut | PLC cut → L5–S1 rods |
Change in ROM tested | Increase | Increase | Increase |
t-stat (p-val) | 0.6321 | 0.0518 | 0.7157 |
W-sgn (p-val) | 0.7693 | 0.0574 | 0.7081 |
Significance | No | No | No |
Axial rotation | Intact → STL cut | STL cut → PLC cut | PLC cut → L5–S1 rods |
Change in ROM tested | Increase | Increase | Increase |
t-stat (p-val) | 0.5539 | 0.0283 | 0.1849 |
W-sgn (p-val) | 0.6238 | 0.018 | 0.3057 |
Significance | No | Yes | No |
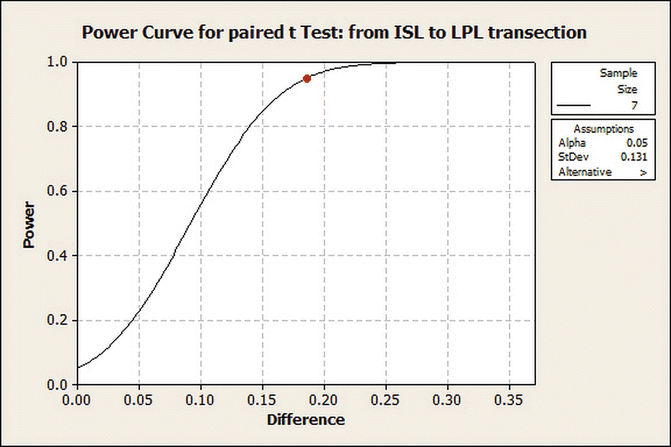
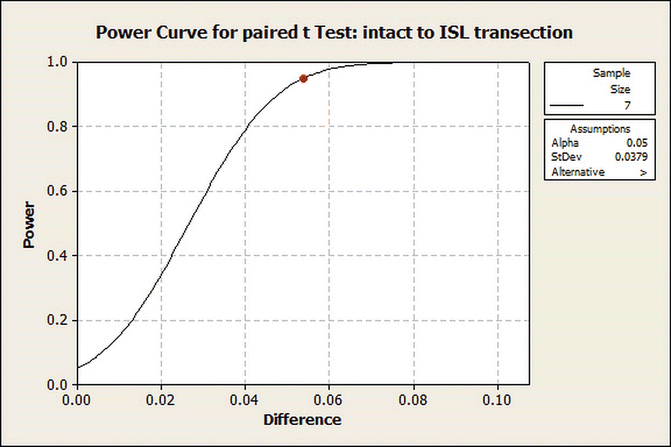
Small sample sizes leave a question of power in the ability to detect differences. Using the average sample standard deviations over three directions, e.g.,
![$$ {S}_{\mathrm{intact}->\mathrm{I}\mathrm{S}\mathrm{L}\;\mathrm{cut}}=\left({S}_{\mathrm{F}/\mathrm{E}:\mathrm{intact}->\mathrm{I}\mathrm{S}\mathrm{L}\;\mathrm{cut}}+{S}_{\mathrm{lateral}\;\mathrm{bend}:\mathrm{intact}->\mathrm{I}\mathrm{S}\mathrm{L}\;\mathrm{cut}}+{S}_{\mathrm{axial}\;\mathrm{rotation}:\mathrm{intact}->\mathrm{I}\mathrm{S}\mathrm{L}\;\mathrm{cut}}\right)/3 $$
” src=”/wp-content/uploads/2016/10/A317803_1_En_4_Chapter_Equa.gif”></DIV></DIV></DIV>The power curves are shown in Figs. <SPAN class=InternalRef><A href=]() 4.4 and 4.5.
4.4 and 4.5.
Get Clinical Tree app for offline access

Fig. 4.4
Power curve for paired t-test: from ISL to L-PL transection
Fig. 4.5


Power curve for paired t-test: intact to ISL transection
Related posts:


Stay updated, free articles. Join our Telegram channel
Full access? Get Clinical Tree