Articular Cartilage
Hollis G. Potter
Li Foong Foo
Introduction to Cartilage Imaging
Currently, standardized cartilage-sensitive pulse sequences are available for all joints and should be included as a part of all joint imaging protocols. Cartilage-sensitive imaging using magnetic resonance (MR) imaging is a dynamic process, and ongoing research continues to refine the techniques, providing detailed evaluation of traumatic, inflammatory, and degenerative patterns of cartilage loss. Volumetric (quantitative) MR imaging is likely to become more available to standardized work stations, permitting the longitudinal assessment of cartilage volume over time. It is important to remember, however, that although MR imaging provides superior soft-tissue contrast compared to traditional imaging techniques, standardized radiographs are also a valuable element in cartilage assessment, particularly in the setting of planning for cartilage repair. Indeed, standing hip to ankle films may be essential for providing information on the mechanical axis of the limb and for disclosing any associated preexisting deformity that could limit the clinical success of cartilage repair.
Attention to technique is important for successful cartilage-sensitive MR imaging, since associated instrumentation may create magnetic susceptibility. In this setting, fast spin-echo sequences have been proven more effective than standardized gradient-echo techniques. Similarly, the use of short tau inversion recovery (STIR) sequences to detect bone marrow edema pattern may provide more uniform fat suppression. Additional techniques that assess the extracellular matrix, such as the proteoglycan- or collagen-directed techniques, provide further information and some degree of tissue characterization and may eventually obviate the need for biopsy.
Introduction to Cartilage Structure
The unique structure of articular cartilage reflects its function, including the ability to distribute joint loads over a wide area, thus decreasing contact stresses on the subchondral bone, as well as permitting movement of opposing surfaces with minimal friction and wear.1 Cartilage is a metabolically active tissue, with metabolic homeostasis being maintained by the chondrocytes, which are responsible for sustaining a stable extracellular matrix. Chondrocytes represent less than 10% of cartilage tissue volume,2,3,4 and thus the integrity of the extracellular matrix provides much of cartilage function, including the ability to withstand
both compressive and tensile loads. The solid collagen fibers are of importance in maintaining tensile stiffness and strength.1 However, given their ratio of length to thickness in structure, collagen is unable to withstand high compressive loads, which is a property maintained by the integrity of the proteoglycan component.
both compressive and tensile loads. The solid collagen fibers are of importance in maintaining tensile stiffness and strength.1 However, given their ratio of length to thickness in structure, collagen is unable to withstand high compressive loads, which is a property maintained by the integrity of the proteoglycan component.
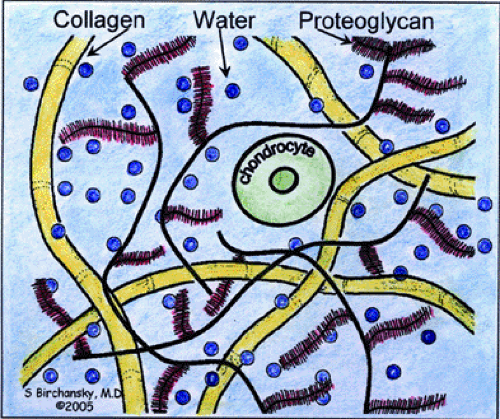
Water is the most abundant component of articular cartilage, accounting for its unique ability to be imaged using MR. The majority of water is contained within an interstitial space created by the matrix elements, including collagen and proteoglycan, which are large protein—polysaccharide molecules that exist either as monomers or aggregates.5,6 Proteoglycan monomers are often depicted schematically as having a “bottlebrush-like” structure with negatively charged glycosaminoglycans (chondroitin sulfate and keratan sulfate) that radiate in a perpendicular direction from the protein core. These negatively charged monomers bind to hyaluronic acid to form larger macromolecular aggregates, which resist compression of cartilage due to their hydrophilic structure (Fig. 7.1). The negative charge of the glycosaminoglycan components of proteoglycan may be exploited in indirectly assessing the proteoglycan component of cartilage structure using MR imaging techniques.
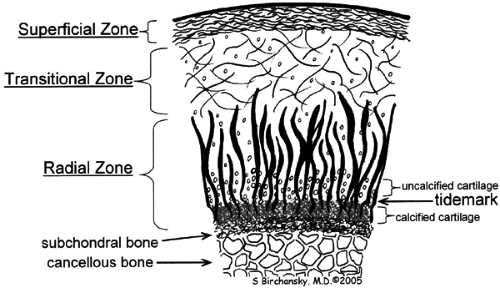
The structure of these vital matrix elements varies as a function of depth, and the well-described orientation of different matrix elements allows cartilage to be divided structurally and functionally into four zones: superficial, transitional, deep or radial, and calcified (Fig. 7.2):
The most superficial or tangential zone (lamina splendens) represents 10% to 20% of the total thickness of cartilage, reflecting collagen fibers that are oriented parallel to the articular surface. The superficial zone resists shear and has the highest collagen content of all zones.1 Chondrocytes in this layer differentially express proteins with lubricating and protective functions, yielding little proteoglycan content.7 Despite the importance of the superficial zone, it is typically not visualized as separate from the transitional zone on standardized cartilage imaging performed at clinically relevant field strengths.
In the transitional or middle zone, representing 40% to 60% of the cartilage thickness, collagen fibers are randomly oriented.1 The inhomogeneity of fiber orientation acts to distribute stress more uniformly across loaded tissue.8
The deep or radial zone represents 30% of the cartilage thickness and has highly ordered fibers that are perpendicular to the articular surface. The radial orientation of the collagen fibers coalesces as bundles; they then cross the tidemark, defined as the interface between the arular cartilage and the calcified cartilage beneath it, forming a system that anchors the cartilage to underlying bone.9
The calcified zone is separated from the radial zone by its boundary tidemark. The tidemark also represents a potential shear plane for articular cartilage defects in the adult skeleton. Deep to the calcified cartilage lies the subchondral bone plate.10
All three major elements of cartilage—water, proteoglycan, and collagen—account for the signal characteristics of cartilage on MR imaging. Because of its concentration in soft tissue, hydrogen is typically used as the targeted magnetic dipole to image cartilage in the clinical setting. As such, it is important to consider the relative different “pools of water” that exist (including free water, which accounts for the bulk of the signal), the component that is electrostatically bound to proteoglycan, and the component that is associated with collagen. An understanding of the normal structural integrity of cartilage is important to accurately identify both intact and degraded articular cartilage, as well as to provide some insight into new cartilage repair techniques.
Cartilage Imaging
Pulse Sequence Selection
Traditional (Conventional) Spin-Echo and Gradient-Echo Techniques
The ability of MR to noninvasively assess cartilage is one of more important advances in orthopaedic imaging. Many pulse sequences have been developed to detect cartilage (Table 7-1). The “ideal” cartilage pulse sequence provides differential contrast among synovial fluid, fibrocartilage (such as meniscus and labrum), and hyaline cartilage, combined with relatively high in-plane and slice resolution. The ability to detect changes in the adjacent subchondral bone is also clinically useful. It is essential to note, however, that traditional T1- and T2-weighted images are not suitable for the assessment of cartilage. Indeed, the use of traditional pulse sequences with poor in-plane resolution results in ineffective visualization of articular cartilage that has been proven inaccurate compared to arthroscopic inspection and correlates poorly with clinical evaluation.11,12,13,14,15 Image characteristics on traditional T1- and T2-weighted sequences include the following:
With a traditional T1-weighted sequence, fluid is of intermediate to lower signal intensity with poor contrast against the intermediate-signal-intensity articular cartilage.
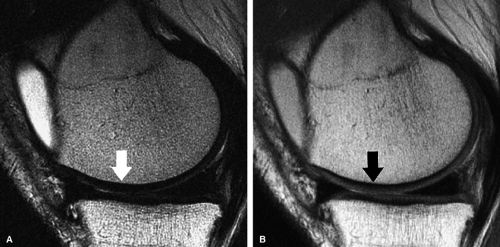
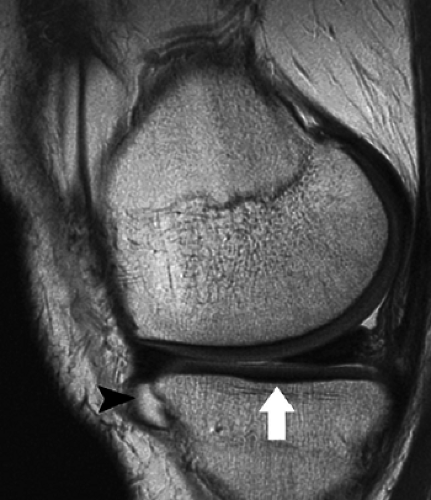
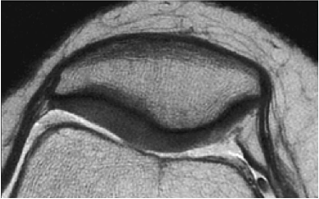
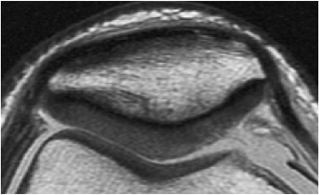
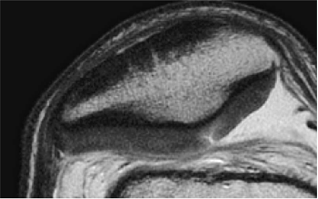
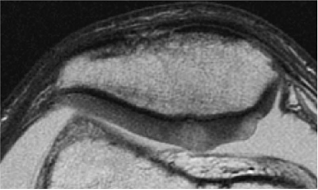
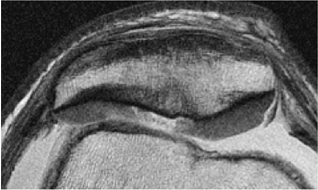
Heavily T2-weighted sequences, with echo times in excess of 80 msec, depict the cartilage as being relatively hypointense compared to high-signal-intensity fluid. It is important to remember, however, that because of the normal stratification of the extracellular matrix in cartilage, T2 values are shorter in the radial zone (closer to the subchondral plate) than in the transitional zone, where the collagen is more randomly oriented and T2 values are prolonged. This normal stratification can be perceived on appropriate cartilage-sensitive scans and provides insight into the cartilage ultrastructure (Fig. 7.3).
With longer echo times there is poor delineation between the basilar components of the cartilage and the subchondral plate. This may account for factitious thickening of the subchondral plate and thinning of the cartilage (see Fig. 7.3).
Three-dimensional T1-weighted gradient-echo imaging was one of the first techniques to provide cartilage-sensitive imaging that was considered to be accurate based on comparison with arthroscopic findings. Disler et al. have shown that fat-suppressed T1-weighted 3D gradient-echo sequences (T1-weighted 3D spoiled gradient echo) were considerably more sensitive than standard MR imaging: 93% versus 53% in one study16 and 75% to 85% versus 29% to 38% in another.17 These authors also measured interobserver agreement, crucial for MR imaging to be used as a substitute for diagnostic
arthroscopy in cartilage evaluation, and found that images acquired using the gradient-echo sequences provided excellent interobserver and intraobserver agreement (kappa = 0.72 – 1.0), with the exception of the lateral tibial plateau, which showed moderate to substantial agreement (kappa = 0.56 – 0.72). The more convex architecture of the lateral tibial plateau may make evaluation in this location subject to partial volume errors and reduced accuracy.18
arthroscopy in cartilage evaluation, and found that images acquired using the gradient-echo sequences provided excellent interobserver and intraobserver agreement (kappa = 0.72 – 1.0), with the exception of the lateral tibial plateau, which showed moderate to substantial agreement (kappa = 0.56 – 0.72). The more convex architecture of the lateral tibial plateau may make evaluation in this location subject to partial volume errors and reduced accuracy.18
TABLE 7.1 ● Comparison of Commonly Used Pulse Sequences in Cartilage Imaging | ||||||||||||||||||||||||||||||||||||||||||||||||||||
|---|---|---|---|---|---|---|---|---|---|---|---|---|---|---|---|---|---|---|---|---|---|---|---|---|---|---|---|---|---|---|---|---|---|---|---|---|---|---|---|---|---|---|---|---|---|---|---|---|---|---|---|---|
| ||||||||||||||||||||||||||||||||||||||||||||||||||||
Cartilage Segmentation Analysis
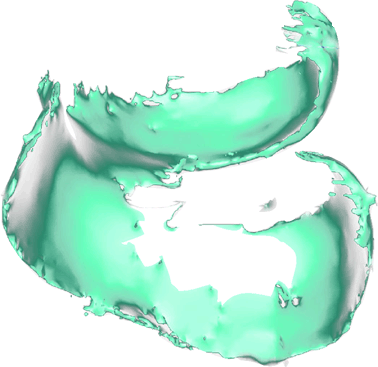
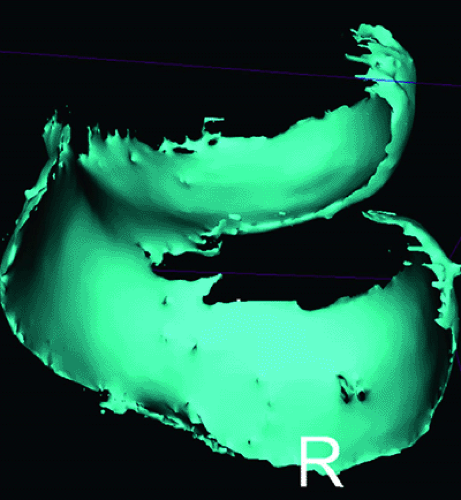
Fat-suppressed T1-weighted gradient-echo techniques provide high contrast between bone and cartilage but are not fluid-sensitive. Three-dimensional gradient-echo sequences with high contrast boundaries between bone and cartilage are more amenable to semiautomatic segmentation algorithms, thus providing reproducible assessment of cartilage thickness and volume (Fig. 7.4).19,20
The ability to perform segmentation analysis of gradient-echo images makes these pulse sequences suitable for monitoring disease progression over time and assessment of cartilage volume in osteoarthritis (OA). The chosen pulse sequence parameters should be based on a suitable standard and should have high precision or reproducibility.21 Routine, standardized cartilage imaging for clinical assessment is generally performed with a slice resolution between 3 and 4 mm and an in-plane resolution between 300 and 350 microns. However, gradient-echo sequences necessary to quantify cartilage often need higher resolution, requiring a slice thickness on the order of 1 to 2 mm, at a pixel size of less than 300 microns.21
Attention to echo time is also important. For fat-suppressed T1-weighted gradient-echo sequences, given the relatively short T2 relaxation times of cartilage, fairly short echo times (preferably 10 msec) are generally recommended. As Eckstein et al. reported, an echo time of 11 msec led to underestimation of tibial cartilage thickness (compared to CT arthrography as the standard).22
Attention to echo time is also important. For fat-suppressed T1-weighted gradient-echo sequences, given the relatively short T2 relaxation times of cartilage, fairly short echo times (preferably 10 msec) are generally recommended. As Eckstein et al. reported, an echo time of 11 msec led to underestimation of tibial cartilage thickness (compared to CT arthrography as the standard).22
With standardized modern gradient platforms, a cartilage volume technique in a single plane may be acquired in less than 13 minutes. As a result of partial volume effects encountered in tomographic imaging of a curved articular surface, more accurate thickness assessment is obtained if computations are performed in all three planes.21 Unfortunately, universal application of such techniques is limited by the extensive time required for optimal scan acquisition and post-processing. In an attempt to find a method to reduce post-image processing time, Zhai et al. compared assessment of a whole slab of 1.5-mm-thick slices with measurement of every second to fourth slice.23 Using the inclusive slice estimate as the standard, the authors found that decreasing the number of slices by extracting one in two to one in four slices led to little over- or underestimation in cartilage volume over the plateau and patella (femoral cartilage volume was not assessed).23 Others have used a double echo steady state (DESS) gradient-echo sequence at 3 Tesla to analyze cartilage morphology in the femorotibial joint.24 The inherently higher signal-to-noise ratio in this protocol permitted thinner slices (0.7 mm) and accurate analysis of cartilage morphology.
Assessment of cartilage volume is dependent on thickness and surface area. Therefore, longitudinal changes are affected by alterations in cartilage thickness (elevation or reduction) as well as alterations in cartilage surface area (osteophyte formation). Due to these variables, standardization of cartilage segmentation techniques is needed, with strict attention to pulse sequence parameters and in-plane and slice resolution. To obtain cartilage volume, segmentation must be performed either manually (a lengthy, time-consuming process) or by semiautomatic algorithms based on computerized recognition of tissue contrast edge boundaries. These techniques often delineate the line of the steepest gradient between the hyperintense cartilage and the hypointense (fat-suppressed) bone, as well as between the hyperintense cartilage and the hypointense meniscus or capsule.25 Some correction at low-contrast interfaces, as well as the application of smoothing algorithms after segmentation, may be required. Although some degree of expertise is necessary to maintain reproducibility, in general, automatic segmentation provides superior reproducibility in the assessment of cartilage volume and thickness.26
In a study of cartilage segmentation prior to knee arthroplasty, Graichen et al. compared results from quantitative MR imaging with those obtained by direct image analysis of surface area, cartilage thickness, and volume of the explants. Quantitative MR imaging provided accurate assessment of OA, with correlation coefficients ranging between 0.92 for thickness and 0.98 for volume.25 Segmentation of the central and weight-bearing areas of the femoral condyles have been shown to be more accurate than analysis of boundary and non-weight-bearing regions.27 Others have studied lesions at varying field strengths. Comparing 1.5- to 3-Tesla units and using a gradient peak method to define focal cartilage, no statistically significant differences were found between the two field strengths or in the accuracy of the measurements of depth, diameter, area, and focal thickness compared to manual measurements.28
Quantitative MR imaging is an attractive addition to the longitudinal study of OA, providing noninvasive assessment of cartilage morphology and/or response to pharmaceutical intervention. Comparing radiographic evidence of osteoarthritis, including joint space narrowing and osteophytes, with segmentation techniques, Cicuttini et al. noted a strong negative linear association between tibial cartilage volume and increasing joint space narrowing.29,30 More recently, evaluation of patients with knee OA using quantitative MR imaging and joint space width on radiographs showed a modest but significant correlation between joint space and medial tibiofemoral cartilage volume; no correlation in longitudinal changes over a 2-year follow-up period, however, was found.30 The authors suggested that 3D assessment of cartilage volume may be superior to 2D assessment using radiographs.30
The use of quantitative MRI in the longitudinal evaluation of osteoarthrosis may be affected by transient deformation in cartilage as a response to load (which affects cartilage volume).31 In one study a diurnal variation in cartilage thickness over the patellofemoral and femorotibial contact zones has been noted during a day of standing activity.32 There is also a statistically significant decrease in patella cartilage volume in response to physical exercise, suggesting that a period of rest may be indicated prior to imaging of subjects in a longitudinal assessment.33
Although the study of mechanical deformation of cartilage in normal and abnormal joint loading conditions is of interest, the relationship between alterations in overall cartilage volume and function remains unclear. It has been suggested that because of variations in the relative size of subchondral bone, cartilage volume alone may not be suitable as a criterion for patient evaluation, and that a ratio of cartilage volume to bone interface may prove a more suitable measure.21 In a 2-year study of patients with knee arthritis, Raynauld et al. found that there was no statistical correlation between loss of cartilage volume on MR imaging with radiographic changes, or between changes in cartilage volume and alterations in clinical variables, including components of the Western Ontario and McMaster University Osteoarthritis Questionnaire (pain, stiffness, and function) and the “Short Form 36” (SF36) health quality assessment technique.34
Fast Spin-Echo Imaging
Although suitable for volumetric assessment, one of the pitfalls of imaging with gradient-echo techniques is susceptibility to image degradation in the presence of orthopaedic instrumentation or metallic debris following diagnostic arthroscopy. Fast spin-echo techniques, with the ability to directly visualize articular cartilage despite adjacent hardware, have proven more useful in the setting of instrumentation.35 One of the greatest advantages of fast spin-echo imaging of articular cartilage is the ability to generate images suitable for detection of subchondral bone, ligaments, and the surrounding soft-tissue
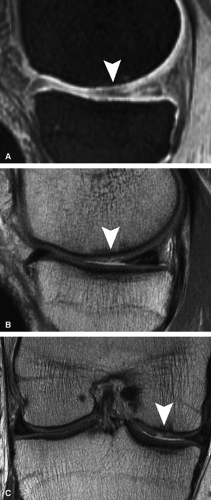
envelope, providing more efficient use of imaging time. Fast spin-echo images are cartilage-sensitive due to an inherent magnetization transfer contrast and exchange of off-resonance magnetization between slices, the net effect of which is to saturate the bound pool of hydrogen nuclei, resulting in a decrease in signal intensity from the free pool.36 This exchange results in relatively high signal intensity from fluid compared to the lower signal intensity of articular cartilage, providing an effective differential contrast among menisci, articular cartilage, and fluid in the meniscosynovial recesses (Fig. 7.5). With arthroscopy as a standard, Potter et al. found that articular surface evaluation using spin-echo sequences had a sensitivity of 87%, a specificity of 94%, and an accuracy of 92%, with minimal interobserver variability (kappa = 0.93).18 These findings of reproducibility support the use of MR imaging as a noninvasive and objective outcome measure of surgically manipulated cartilage and in the longitudinal evaluation of traumatic and degenerative cartilage lesions.
envelope, providing more efficient use of imaging time. Fast spin-echo images are cartilage-sensitive due to an inherent magnetization transfer contrast and exchange of off-resonance magnetization between slices, the net effect of which is to saturate the bound pool of hydrogen nuclei, resulting in a decrease in signal intensity from the free pool.36 This exchange results in relatively high signal intensity from fluid compared to the lower signal intensity of articular cartilage, providing an effective differential contrast among menisci, articular cartilage, and fluid in the meniscosynovial recesses (Fig. 7.5). With arthroscopy as a standard, Potter et al. found that articular surface evaluation using spin-echo sequences had a sensitivity of 87%, a specificity of 94%, and an accuracy of 92%, with minimal interobserver variability (kappa = 0.93).18 These findings of reproducibility support the use of MR imaging as a noninvasive and objective outcome measure of surgically manipulated cartilage and in the longitudinal evaluation of traumatic and degenerative cartilage lesions.
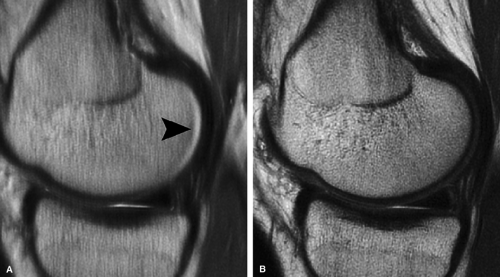
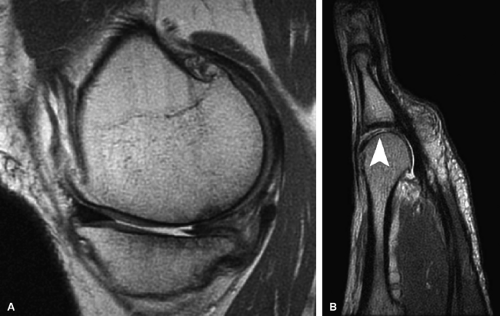
Fast spin-echo sequences use a relatively long repetition time (TR) (on the order of 3,500–5,000 msec) with a moderate to intermediate echo time (TE) (30–34 msec) for central K-space filling. High in-plane resolution (on the order of 250–350 μ in the frequency direction) imparts superior spatial resolution, which can make partial-thickness lesions more conspicuous compared to the gradient-echo techniques (Fig. 7.6). An essential element is the use of a wider receiver bandwidth
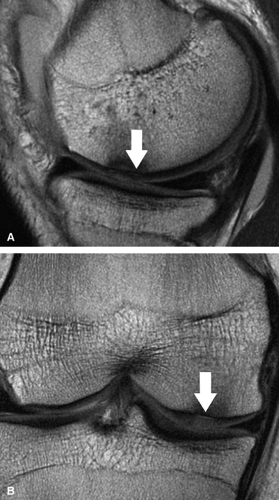
to minimize chemical shift misregistration as well as to reduce inter-echo spacing. Decreasing inter-echo spacing will minimize the edge blurring routinely encountered with fast spin-echo techniques performed at correspondingly narrower bandwidths with wider inter-echo spacing. The effect of chemical shift causes a misregistration at the interface between fat (subchondral bone) and water (cartilage), resulting in factitious loss of the subchondral plate, abnormal signal hyperintensity in the adjacent cartilage (due to the frequency shift summation), and inaccurate assessment of cartilage morphology (Fig. 7.7).
to minimize chemical shift misregistration as well as to reduce inter-echo spacing. Decreasing inter-echo spacing will minimize the edge blurring routinely encountered with fast spin-echo techniques performed at correspondingly narrower bandwidths with wider inter-echo spacing. The effect of chemical shift causes a misregistration at the interface between fat (subchondral bone) and water (cartilage), resulting in factitious loss of the subchondral plate, abnormal signal hyperintensity in the adjacent cartilage (due to the frequency shift summation), and inaccurate assessment of cartilage morphology (Fig. 7.7).
The chemical shift effect may be minimized by the use of a wider receiver bandwidth and can be largely eliminated by the use of fat-suppression techniques. In a study comparing arthroscopy findings with coronal and axial moderately T2-weighted fast spin-echo images with frequency-selective fat suppression, Bredella et al. reported that MR imaging has a sensitivity of 94%, a specificity of 99%, and accuracy of 98%.37
Newer Gradient Echo Techniques
Additional pulse sequences have also been recommended for evaluation of cartilage, most of which are based on modified gradient-echo techniques that yield good fluid-to-cartilage contrast. Examples include driven equilibrium Fourier transform (DEFT) imaging, double echo steady state (DESS) imaging, refocused steady state free precession (SSFP), water selective balanced steady state free precession pulse sequences (WS-bSSFP), and projection reconstruction imaging:
Driven equilibrium Fourier transform (DEFT) imaging uses an additional 90° RF pulse to drive the recovery of longitudinal magnetization, resulting in high signal intensity from tissues with long T1 relaxation times, such as the synovial fluid adjacent to the articular cartilage. Gold et al. compared 3D DEFT imaging with proton density-weighted and T2-weighted fast spin-echo imaging and reported that sensitivity for full-thickness lesions was 50% for the fast spin-echo images compared to 67% for the 3D DEFT images; specificity was 80% for the FSE images compared to 100% for the 3D DEFT images.39 The authors also noted that artifacts were accentuated on the 3D DEFT sequence compared to the fast spin-echo images.39 The 3D DEFT images, however, subjectively provided superior cartilage-to-fluid contrast compared to more traditional cartilage-sensitive techniques.40
Several gradient-echo pulse sequences achieve cartilage-to-fluid contrast by the use of a steady state, including DESS, SSFP, and WS-bSSFP. Double echo steady state (DESS) acquires and combines two gradient echoes, providing both high T2 contrast and representative joint morphology.41 Refocused steady state free precession (SSFP)
techniques (also known as True-FISP, FIESTA, and balanced FFE) require all imaging gradients to be fully re-wound between excitation pulses, resulting in high transverse coherence and relative T2/T1 weighting.42 Fat suppression may also be used in the steady state free precession pulse sequences, providing optimal cartilage-to-fluid contrast at the expense of signal-to-noise. Relative fat and water separation may be achieved with phase-sensitive techniques without the expense of the increased scan time needed when using frequency-selective fat suppression.43 Water selective balanced steady state free precession pulse sequences (WS-bSSFP) have also been explored. Kornaat et al. compared WS-bSSFP with moderately low in-plane resolution fast spin-echo techniques in 10 patients with arthritis and determined that the contrast-to-noise between cartilage and surrounding tissue was optimized with a 20° to 25° flip angle; the contrast-to-noise ratio was higher on the WS-bSSFP sequences than on fast spin-echo protocols or on T1-weighted gradient-echo techniques.44 In a comparison study of 3D T1-weighted gradient-echo and 3D SSFP imaging, Reeder et al. noted superior fat/water separation with good cartilage-to-fluid contrast and reduced acquisition times using 3D SSFP sequencing in a small cohort of 10 knees of five volunteers.45
Multiple echo techniques, in which a series of identically phase-encoded gradient echoes are sampled per line in K-space and unipolar readout gradients are used to avoid off-resonance effects, have also been developed.46 In a study evaluating the patellar joint using a slice thickness of 3 mm (1.5-mm gap) and arthroscopy as the standard, these techniques had a sensitivity of 79%, a specificity of 82%, and accuracy of 81% in detecting grade 2 or higher lesions.46 Interobserver agreement was also good (kappa = 0.68).46
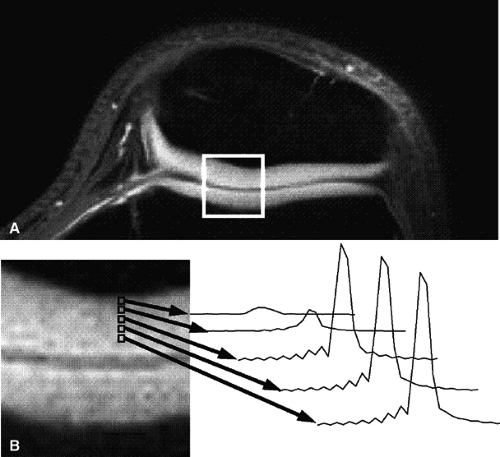
Short echo time projection reconstruction imaging of cartilage is a technique to detect ultrashort species in cartilage, potentially improving visualization of cartilage structure.47 Gold et al. described a method to obtain information from ultrashort echo time species in cartilage using projection-reconstruction spectroscopic imaging, disclosing spectra from voxels across the zones of articular cartilage that are reconstructed at the water frequency (Fig. 7.8).48 The latter technique also uses fat suppression to minimize chemical shift misregistration.
TABLE 7.2 ● Arthroscopic and MRI Correlation | ||||||||||||||||||||||||||||
|---|---|---|---|---|---|---|---|---|---|---|---|---|---|---|---|---|---|---|---|---|---|---|---|---|---|---|---|---|
| ||||||||||||||||||||||||||||
Contrast Techniques
Contrast agents, either intra-articular or intravenous saline or gadolinium, have also been used to improve the depiction of articular cartilage.49 The disadvantages of contrast administration, however, are the conversion of an otherwise noninvasive MR imaging study into an invasive technique and, at times, increasing the cost of the examination. More detailed information on the use of contrast media in the evaluation of cartilage architecture is provided in the section on delayed gadolinium-enhanced MR imaging of cartilage (dGEMRIC) later in this chapter.
Cartilage Imaging at Different Field Strengths
Traditional low-field open or dedicated extremity units have not proven effective in the evaluation of cartilage, and higher-field open or dedicated units are more applicable to standardized cartilage pulse sequences (Fig. 7.9). In a comparison of the diagnostic performance of a dedicated 0.18-Tesla MR system to a conventional whole-body 1.0-Tesla system using a variety of pulse sequences (including a combination of spin-echo and 2D and 3D gradient-echo, water excited 3D double echo steady state [DESS], and 3D fat-suppressed T1-weighted imaging on the high-field unit), Woertler et al. found that images obtained on the 1.0-Tesla unit demonstrated significantly superior diagnostic performance compared to the low-field images, particularly for depicting moderate- and high-grade partial-thickness cartilage lesions.50 In another study using a 1.0-Tesla dedicated extremity unit and protocols including fat-suppressed fast spin-echo proton density-weighted and coronal STIR sequences, Roemer et al. found good to excellent agreement between individual observers, suggesting that these units may be acceptable for cartilage imaging on an open construct.51
With the advent of even higher clinical field strengths, superior in-plane resolution and contrast-to-noise may be achieved while maintaining adequate signal-to-noise due to greater recruitment of protons (Fig. 7.10).52 Comparison of the diagnostic accuracy of images acquired using 3.0- to 1.5-Tesla units in animal models has demonstrated superior signal and contrast-to-noise, resulting in improved chondral detection and more accurate cartilage lesion assessment at 3 Tesla.53,54
Laminar Appearance of Articular Cartilage
Depending on the pulse sequence used, a bilaminar or trilaminar appearance of cartilage may be noted, largely due to the more highly ordered structure of the collagen of the deeper radial zone, which yields shorter T2 relaxation times and corresponding lower signal intensity. The laminar appearance of cartilage has been well documented on very high field strength (7 Tesla) MR microscopy systems, and three zones that correlate with the three histologic zones of cartilage have been identified:55
A relatively hypointense radial zone
A higher-signal-intensity transitional zone
A thinner, hypointense superficial zone
The distinction among these laminae is accentuated with prolonged echo times.55 The different collagen orientation within the cartilage zones has been confirmed by transmission electron microcopy.56 Some investigators have suggested that the laminar appearance of articular cartilage may be a function
of truncation during the Fourier transform, resulting in a factitious laminar appearance that is accentuated on short TE gradient-echo sequences, particularly those with relatively low in-plane resolution.57 Truncation artifact occurs at high signal interfaces and is most typically seen in the spinal cord at the spinal fluid–cord interface, creating a “pseudo-syrinx.” It is important to remember that the laminar appearance of cartilage is markedly different on clinical MR imaging systems compared with high-field microscopy systems (or clinical systems fitted with special gradient inserts and/or optimized small sample coils). It is our experience that a trilaminar appearance of cartilage on microscopy systems indeed reflects the ultrastructure of the cartilage, and with an in-plane resolution of 300 to 350 μ, a consistent bilaminar appearance is seen on fast spin-echo techniques (with or without frequency-selective fat suppression). In most cases, however, the resolution of the superficial zone (representing approximately 10% of the overall cartilage thickness) is beyond that of standardized clinical protocols.
of truncation during the Fourier transform, resulting in a factitious laminar appearance that is accentuated on short TE gradient-echo sequences, particularly those with relatively low in-plane resolution.57 Truncation artifact occurs at high signal interfaces and is most typically seen in the spinal cord at the spinal fluid–cord interface, creating a “pseudo-syrinx.” It is important to remember that the laminar appearance of cartilage is markedly different on clinical MR imaging systems compared with high-field microscopy systems (or clinical systems fitted with special gradient inserts and/or optimized small sample coils). It is our experience that a trilaminar appearance of cartilage on microscopy systems indeed reflects the ultrastructure of the cartilage, and with an in-plane resolution of 300 to 350 μ, a consistent bilaminar appearance is seen on fast spin-echo techniques (with or without frequency-selective fat suppression). In most cases, however, the resolution of the superficial zone (representing approximately 10% of the overall cartilage thickness) is beyond that of standardized clinical protocols.
Imaging of Articular Cartilage Structure
Pearls and Pitfalls
Matrix Assessment Using MRI
Proteoglycan assessment: Assess relative fixed charge density (FCD) of negatively charged glycosaminoglycans
Sodium MR imaging
No contrast required
Standard for newer FCD techniques
Requires multinuclear spectroscopy and special coils
Limited by longer scan times to obtain adequate signal-to-noise ratio
Delayed gadolinium-enhanced MRI of cartilage (dGEMRIC)
Indirect T1 following Gd-DTPA penetration → index of [Gd]cartilage proportional to the [GAG]tissue
Requires intravenous injection of gadolinium, followed by exercise and delay before scanning
T1 rho (T1ρ) imaging
No contrast required
Spin-locking pulse requires more RF power (specific absorption rate may limit number of slices)
Less susceptible to regional field inhomogeneities
Collagen assessment: Assess collagen orientation throughout cartilage thickness
T2 mapping
No contrast required
Subject to magic angle and chemical shift effects in vivo
Although the MRI signal properties of articular cartilage reflect its ultrastructure, the spatial resolution of standardized MR imaging using conventional units demonstrates only gross morphologic and signal alterations.58 As previously mentioned, the laminar appearance of articular cartilage noted on some fast spin-echo and steady-state gradient-recalled sequences reflects the relatively shorter T2 values of the highly ordered cartilage in the radial zone, compared to the more random orientation of the collagen in the transitional zone. The bulk of the signal derives from the free water content of the cartilage. However, specific MR imaging techniques may be used to assess matrix changes by targeting additional “bound” components of the extracellular matrix, specifically proteoglycan or collagen. Loss of the negatively charged glycosaminoglycan components of proteoglycan may cause alterations in the fixed charge density of cartilage. Both traumatic cartilage injury and OA have been associated with loss of negatively charged glycosaminoglycan, and these changes may be tracked with MR imaging techniques, including positively charged sodium (23


Stay updated, free articles. Join our Telegram channel

Full access? Get Clinical Tree


