Fig. 65.1
(a, b) Anteroposterior and lateral x-ray of distal femur showing an area of lucency with patchy mixed lytic and sclerotic lesion in the medullary canal. (c, d) MRI of the same lesion simulating a chondroma
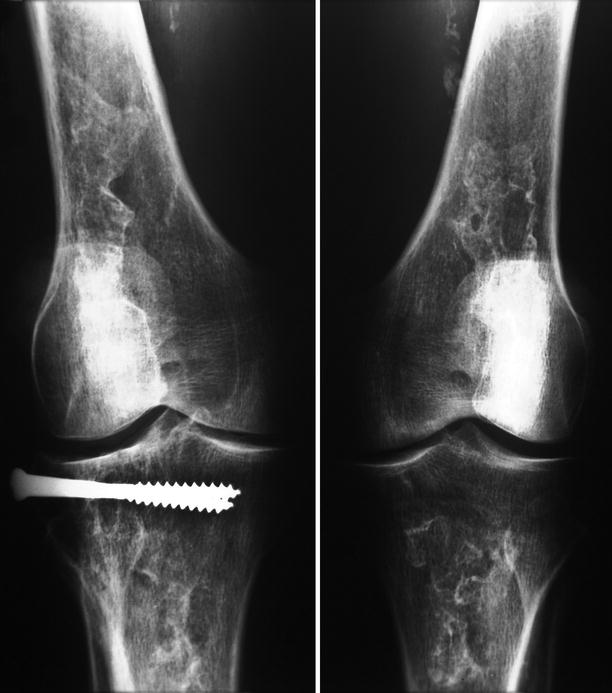
Fig. 65.2
(a, b) Anteroposterior and lateral radiographic features of an old multifocal medullary infarct showing a well-defined radiodense lesion
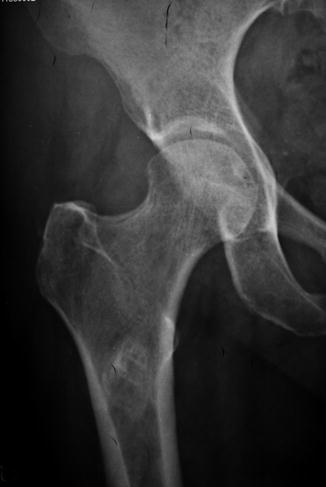
Fig. 65.3
Plain x-ray of the proximal metaphyseal femur illustrating a well-demarcated sclerotic lesion with peripheral increase of radiodensity
Fig. 65.4
Bone infarct of femoral neck. (a, b) X-ray shows a well-circumscribed lytic lesion with central mottled calcifications due to the necrosis of bone marrow. (c, d) There is a high signal intensity on fat suppression images and a low signal intensity on T1-weighted images with a “double-line sign.” (e) CT- guided core needle biopsy
Fig. 65.5
Lower end of femur. (a, b) In Plain x-ray, early lesions may be little evident. A delicate spot calcification is noted. (c, d) Coronal and sagittal T1-weighted MRI shows a well-demarcated zone with serpiginous borders
Fig. 65.6
(a, b) Well-delimitated heterogeneous lesion in the proximal end of the tibia. (c) CT scan showing the trabecular sclerosis and secondary cystic changes. (d, e) Coronal T1-weighted MRI showing low intensity signal in cystic areas and sagittal T2-weighted MRI with high intensity signal in the same areas
Fig. 65.7
(a) Plain radiograph illustrating irregular medullar sclerosis in the proximal humerus. (b) MRI showing a large heterogeneous lesion with secondary cystic changes