15.1.2 Vertebrae
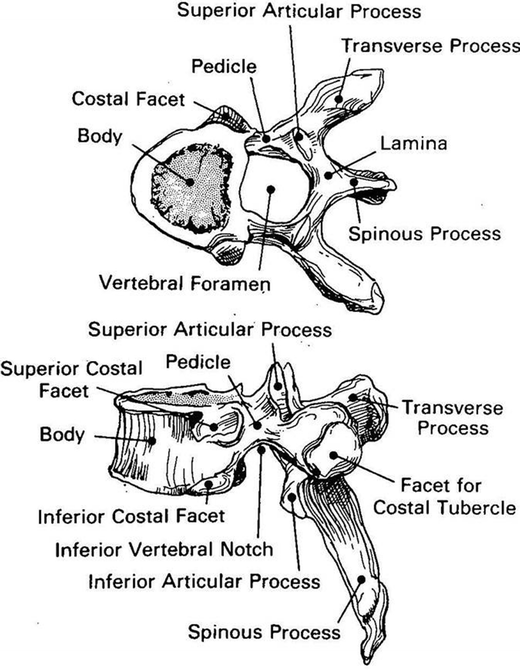
The vertebra consists of the load bearing anterior body and the posterior arch (Fig. 15.2). Its end plates consist of centrally roughened cortical bone and their purpose is to connect the intervertebral discs with the body. The sides of the body are somewhat concave, with almost similar antero-posterior and transverse diameters; the height at the ventral surface is normally 1–2 mm greater than its dorsal height, partially accounting for the thoracic curvature. The outer case of the vertebral body is composed of a thin layer of dense strong compact bone and the inner core is composed of trabecular bone aligned in vertical lamellae. This matrix resists external loads, primarily compression. The cross-sectional area of the body ranges from 800 to 1,055 mm2 [2, 3].


Fig. 15.2
Typical thoracic vertebra showing its various components (Adapted with permission from Ref. [1])
The unique features of the thoracic spine are the ribs and their articulations. In addition to the facets on the pedicle (for spine articulation), articular surfaces exist for the ribs on each vertebra (Fig. 15.3). Rib facets are also seen on the transverse processes of all vertebrae, except T1 and T11–T12. The T11 and T12 vertebrae are unique, with their inferior articular facets oriented in sagittally. The vertebral arch is composed of laminae and bilateral pedicles, articulating surfaces (facets) and spinous processes (Fig. 15.2). The laminae are broad and heavily overlapped. The long and thin spinous processes project inferiorly and in the lower thoracic region, they become horizontal. While the vertebral bodies increase in size inferiorly, the transverse processes decrease in length. The thin but strong stout pedicles extend postero-laterally from the superior aspect of the body. Extending postero-medially from the pedicles, laminae fuse in the midline to form the posterior wall of the spinal canal. The articular processes arise from superior and inferior surfaces of the pedicle. Generally, the superior articular process projects cranially, with the articulating surface or facet on the posterior surface. The inferior articular process projects caudally, with the facet facing anteriorly.


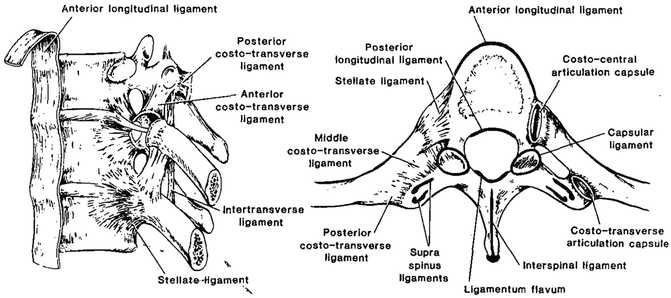
Fig. 15.3
Lateral and axial views of a thoracic vertebra showing its soft tissues (Adapted with permission from Ref. [1])
A thin layer of hyaline cartilage lies on the surface of each facet with synovial joints in the articulated spine. The facets are almost coronal in orientation in the thoracic column (T1–T10). The facets face (vertical) sagittally at lower thoracic regions. The facets absorb compression loads, are important for spine stability during flexion, provide significant resistance to anterior translation from T1 to T10, change their properties in the lower thoracic region because of the anatomy and limit rotation and with less effect on translation [4, 5].
15.1.3 Intervertebral Discs
These fibro-cartilaginous structures attach to vertebral bodies centrally via the superior and inferior end plates, and peripherally via ligaments and fibers of the annulus fibrosus. The discs consist of the central nucleus surrounded by outer annulus. The nucleus pulposus is composed of a loose network of fibrous strands in a mucoprotein gel. The peripheral annulus fibrosus is composed of fibrous tissue arranged in concentric rings and the fiber alignment is oblique. Some fibers of the annulus blend into the anterior and posterior longitudinal ligaments. Others attach to the rim of the vertebral body. The annulus is deeper anteriorly than posteriorly with its fibers inserting into the cartilaginous endplates. The disc heights are narrower in height than the cervical and the lumbar spines. As a joining structural connective member between two vertebral bodies, the discs resist forces in all directions with the primary resistance under compression. Together with the facet joints and the ligament complex, the discs are responsible for all the load transfer between any two successive intervertebral joints and along the entire spinal column. Because of the almost vertical orientation of the facets, the discs carry the majority of the compressive loads placed on the trunk.
15.1.4 Ligaments
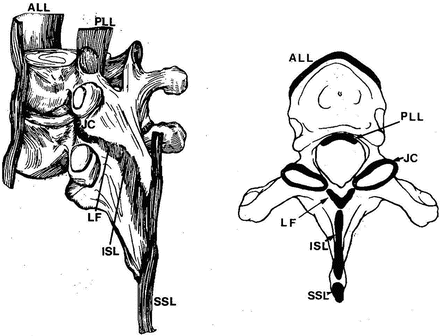
These are typically multilayered uni-axial structures; ligaments may connect adjacent vertebrae or extend over several segments. The elastin and collagen are the two main constituents. Several ligaments exist (Fig. 15.4). The anterior longitudinal ligament (ALL) is composed primarily of longitudinally arranged collagen fibers aligned in interdigitating layers and extend along the entire spinal column. The deepest of its three layers attaches to the edges of adjacent discs; the middle layer binds to the bodies and discs over three levels, and the superficial fibers extend four to five layers. Because of its anatomical location, its primary action is to control extension response of the spine. The posterior longitudinal ligament (PLL) is located on the posterior surface of the vertebral bodies. This ligament also consists of several layers, with the deep fibers extending only to adjacent vertebrae and the stronger superficial fibers spanning several levels. While the ligament closely adheres to the disc annulus, only marginal attachment exists to the vertebral body. It is thinner over the vertebral body than over the disc and thickest overall in the thoracic region. The function of the ligament is primarily to control flexion response of the spine. The ligamentum flavum (also called yellow ligament) is a broad, paired ligament that connects all spinal laminae. These ligaments arise from the anterior surface of the lower lamina and attach to the posterior border of the next lamina. Thus, they are discontinuous at mid-vertebral levels. They extend laterally to the joint capsules and become confluent. It has approximately 80 % elastin and is one of the most elastic tissues in the human body. The uniqueness of this ligament is that it is always under pretension to maintain the functionality of the spine. The capsular ligaments (or joint capsules) attach to the vertebra adjacent to the articular joints. The fibers are perpendicular to the plane of the facets [6]. They serve primarily to limit joint distraction and prevent excursion to a lesser degree. The interspinous ligaments connect adjacent spinous processes. The former attach from the base to the tip of each spinous process. These ligaments control flexion response of the spine.


Fig. 15.4
Postero-lateral view on the left and axial views showing the ligaments (Adapted with permission from Ref. [7])
15.2 Biomechanical Models
In order to determine biomechanical properties of the spine, as it is composed of multiple components with differing load-bearing characteristics, a single experimental model is inadequate. Depending on the application, different models have been used by investigators. Models of individual components of the spine include individual vertebra/vertebral body models, isolated (in situ) ligament models, and disc models. Segmented models of the thoracic spine include single and multilevel functional units or motion segments and disc segments, along with longer columns spanning more than three levels between fixations. Intact PMHS models include the whole body. Contributions of the adjacent structures to the thoracic spinal column responses are automatically included in the structural response. Although micro-level models such as tests using small bone excised from vertebral bodies exist, these studies are not included in the gross response behaviors.
Each type of model has its own merits and demerits. The principal advantage of a component model lies in the relative ease of experimentation and provides fundamental data on the structural (force and deflection at failure for example) and material (stress and strain for example) properties of the component. This model achieves the objective of obtaining such properties independent of the connective tissues, although tests may be necessary at individual component (isolated ligament) level. However, the demerit is the in ability to predict injury because of the lack of connectivity, inherently present in vivo. Also, from a dynamic/injury perspective, inclusions of inertia effects and prediction of injury mechanisms are difficult from component models. Consequently, connective tissues are used to achieve these goals. While a functional unit consisting of vertebra-disc-vertebra structure can be fixed at the proximal and distal ends and loaded dynamically, effects of spinal curvature and posture are ignored in this, next higher level, model. Similar comments apply to the thoraco-lumbar junction models (described later) that have used two-disc and one vertebra unit for injuries and injury mechanisms. These considerations necessitate the use of multilevel functional units/segments so that the effects of curvature and posture can be incorporated. Of course, the most appropriate model would be the use of intact PMHS although issues exist, including difficulties in experimentation, loading, data recording along the spine and data reductions. In this chapter an attempt is made to provide some insights to these approaches for the thoracic spine.
15.2.1 Component Models
15.2.1.1 Vertebrae
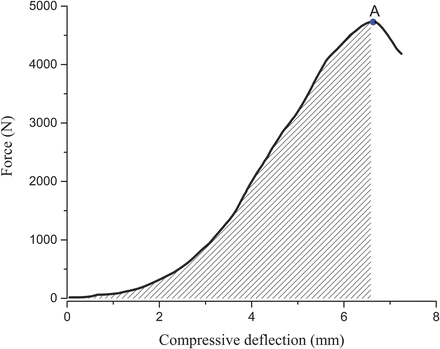
Failure properties of the vertebra have been determined by subjecting isolated vertebral bodies without posterior elements to external forces. Although tensile properties have been reported [8], only compressive loading properties are presented. This is because the vertebral body resists or responds to compression more often than tension, especially in the thoracic spine. An earlier study by Messerer [9] reported failure loads from specimens ranging in age from 25 to 81 years. In a later study, Sonoda [8] tested 26 specimens (age: 22–39 years) in the longitudinal direction under compression and reported failure loads. The strain rates used in these two studies were not dynamic. Kazarian and Graves (1977) conducted one of the earlier dynamic compressive tests on thoracic vertebral bodies [10]. Specimens were prepared from four human cadavers of 26–38 years of age. To ensure uniform load distribution, endplates were potted with dental acrylic. Specimens were tested using a hydraulic testing machine. Each specimen was compressed to 50 % of its original height. The authors reported failure load, displacement to failure, stiffness and energy to failure for three strain rates: 44.4, 0.4 and 0.004 per second. Gozulov et al. (1966) reported compressive failure loads from 530 thoracolumbar vertebrae (age: 19–40 years) using a strain rate of 0.008/s [11]. Yoganandan et al. (1988) subjected thoracic vertebral bodies to axial compressive forces (age: 34–79 years) using an electrohydraulic testing device at a strain rate of 0.13/s [12]. Failure load, displacement at failure, stiffness and energy to failure were reported (Fig. 15.5). The summary data from these studies is included (Table 15.1).


Fig. 15.5
Typical force-deflection from thoracic vertebral body compression loading test. The shaded area under the response curve up to the point A, failure load represents the energy stored in the specimen (Adapted from Ref. [13])
Table 15.1
Summary of biomechanical parameters from vertebral bodies for two strain rates
Parameter | Group A | Group B | ||||||||
|---|---|---|---|---|---|---|---|---|---|---|
Low strain-rate | High strain-rate | Low strain-rate | ||||||||
Upper thoracic | Middle thoracic | Lower thoracic | Upper thoracic | Middle thoracic | Lower thoracic | Upper thoracic | Middle thoracic | Lower thoracic | ||
Area (cm2) | Mean | 6.70 | 9.79 | 14.21 | 7.62 | 8.78 | 12.47 | 5.13 | 8.30 | 11.87 |
SD | 0.30 | 0.44 | 0.80 | 0.99 | 0.76 | 0.42 | 0.63 | 1.08 | 0.07 | |
Load (kN) | Mean | 3.41 | 4.50 | 6.30 | 4.52 | 7.05 | 8.32 | 4.00 | 3.13 | 3.55 |
SD | 0.33 | 0.36 | 0.53 | 0.42 | 0.68 | 0.81 | 1.68 | 0.34 | 0.30 | |
Deflection (mm) | Mean | 3.20 | 2.81 | 2.91 | 2.10 | 2.15 | 2.27 | 6.83 | 5.75 | 7.41 |
SD | 0.18 | 0.27 | 0.25 | 0.32 | 0.18 | 0.20 | 1.60 | 0.35 | 0.54 | |
Failure energy (J) | Mean | 4.73 | 5.10 | 6.59 | 3.95 | 5.55 | 7.20 | 19.20 | 14.40 | |
SD | 0.58 | 0.63 | 1.21 | 0.88 | 0.76 | 0.83 | 8.34 | 2.02 | ||
Stiffness (N/mm) | Mean | 2,134 | 3,626 | 5,048 | 4,343 | 5,574 | 6,249 | 540 | 538 | |
SD | 209 | 357 | 406 | 785 | 511 | 617 | 173 | 55 | ||
Thoracic spinal column can be divided into lower, middle and upper regions to provide an average-type response for each region. High and low strain rates for this initial analysis were based on rates greater than 1 and lesser than 1 per second. From a failure load carrying perspective, age-dependent strength properties have been documented in literatures wherein vertebral bodies from different regions of the spinal column have been subjected to axial compressive loading to failure. An earlier study reported a bilinear fit as the relation between strength and age. The transition of the bilinear response occurs at 40 years of age with a rapid decrease up to 40 years [14]. In contrast, more recent studies have shown the inverse relation to be linear with failure strength and increasing age [15]. These data were found to be true for specimens with intact and excised cortices of lumbar vertebrae. While it is possible to use age as a continuous variable in analyses of data, a dichotomous separation was chosen at 40 years of age as a first step, based on the earlier study.
The mean cross-sectional areas for groups A (less than 40 years) and B (greater than or equal to 40 years) were: from 5.2 to 19.7 cm2 and 4.5 to 12.8 cm2, respectively [16, 10]. Table 15.1 shows these data for the three regions of the thoracic spine for both age groups. The cross-sectional areas showed an increasing trend from superior to inferior direction for both age groups. Both age group and thoracic region showed statistical significance (p < 0.05). However, the cross-sectional area decreased in group B compared to group A.
At high and low strain rates for group A, mean failure loads ranged from 0.8 to 8.6 kN and 3 to 11.1 kN. The low strain rates for group B ranged from 0.29 to 7.0 kN. There were no data for this group at the high strain rate. An increasing trend can be observed in the load carrying capacity from the caudal to the cephalad levels for both age groups at both strain rates, reflecting the increase in the cross-sectional areas at these levels. The linear correlation coefficient between the failure load and cross-sectional area was poor (R2 = 0.4), however. Failure loads at the higher rate were almost double the load at lower strain rates for group A specimens perhaps reflecting the inherent viscous response of the vertebral body at higher rates [10].
At low and high strain rates, group A deflection to failure ranged from 2.2 to 14.2 mm and 1.1 to 3.1 mm. Low strain rates group B specimens ranged from 1.5 to 4.9 mm. The spinal region, age group, and strain rate were found to be statistically significant. The deflection to failure did not significantly vary across spinal region. However, deflections decreased by approximately 33 % for group A specimens at higher strain rates compared to the deflections at low strain rates for all regions. The decrease may be attributed to the viscoelastic behavior of the vertebral body at high strain rates. On average across all regions, deflection increased by 117 % in group B specimens at low strain rates compared to group A specimens. Because specimens in group B were tested without capping the endplates, cross-section areas might have increased contributing to additional deflection.
At low and high strain rates for group A, stiffness ranged from 31 to 1,145 N/mm and 2,353 to 7,861 N/mm. Low strain rates for group B ranged from 1,072 to 6,922 N/mm. The spinal region, age group, and strain rates were statistically significant. An increasing trend in stiffness from the upper to the lower thoracic regions was apparent in group A for both strain rates. At low and high rates, group A specimen stiffness increased by 150 % and 38 % in the lower thoracic spine compared to the upper thoracic spine. Stiffness decreased by 85 % in the group B compared to group A at low strain rates. The secant stiffness used in the definition may have contributed to the low stiffness data from group B.
At low and high strain rates, group A failure energy ranged from 1.4 to 44.2 J and 1.4 and 9.8 J. At low strain rates group B failure energy ranged from 1.7 and 14.2 J. Age group showed statistical significance; however, strain rate and spine region were not significantly different. Failure energy exhibited an increasing trend across spine region for group A at both the strain rates, and the reverse was seen for group B. Energy increased approximately by 20 % in the lower thoracic region compared to the upper thoracic region in group A for both the strain rates. Whereas a 20 % decrease in energy occurred in group B across all spine regions.
15.2.1.2 Intervertebral Discs
Because of its inherent structure, it is difficult to test the entire disc without endplates/adjacent vertebral body attachments, although individual fibers of the annulus or its “coupon” can be loaded using a testing device. Consequently, to test the entire disc, disc segment or one level functional spinal unit is needed. The disc segment consists of the superior and inferior bodies and the disc without the posterior elements of the intervertebral joint. The functional unit includes the posterior elements. Thus, testing the disc segment delineates the responses of the body and disc without contributions from the posterior elements.
During forward bending, anterior region of the discs experience compressive loads, and posterior part exhibits tensile load. Therefore, it is important to determine the strengths of the discs in tension and compression. However, tensile loading is presented as thoracic disc data are sparse for compression. Pintar (1986) conducted tensile tests using ten unembalmed male PMHS specimens [16]. Age of the specimens ranged from 45 to 82 years. The disc segment was fixed at the vertebral ends using Steinman pins and pulled in direct axial tension to failure at a strain rate of 0.5/s using an electro-hydraulic testing machine. The following analysis was performed by dividing the thoracic discs into the upper, middle, and lower regions, representing C7–T5, T5–T8, and T9–L1 levels. Failure loads showed an increasing trend from the upper to lower spine and ranged from 334 to 1,219 N for all regions. There was an approximate 40 % and 60 % increase in the load carrying capacity in the mid-thoracic and lower thoracic regions compared to the upper thoracic regions, reflecting increased cross-sectional areas from upper to lower spine.
Deflection to failure ranged from 4.2 to 19.1 mm for all regions. A decreasing trend occurred in the failure deflection inferiorly. Deflection decreased by 18 % and 27 % in the middle and lower thoracic regions compared to the upper regions. This reduction in deflection may be due to increase in stiffness from upper to lower thoracic region. Stiffness ranged from 32.3 to 226.6 N/mm for all regions. Data did not show any particular trend of variation from upper to lower spine region. Stiffness increased by 100 % and 56 % in the middle and lower thoracic regions compared to upper thoracic discs.
Stay updated, free articles. Join our Telegram channel

Full access? Get Clinical Tree


