Fig. 26.1
The NiEMG values of hamstring muscles during 2 sessions of knee flexion exercises. Values refer to the mean ± the standard error (SE). ∗∗ P < 0.01 between the muscles, N.S. no significance. BFlh biceps femoris long head, ST semitendinosus, SM semimembranosus. 120 % ECC, eccentric knee flexion at 120 % of the 1 RM; 50 % CON, concentric knee flexion at 50 % of the 1 RM; 50 % ECC, eccentric knee flexion at 50 % of the 1 RM
One week before, immediately (within 5 min) after, and 1, 2, 3, and 7 days after performing two exercise sessions, the subjects underwent a separate MRI of each limb (imaging of the right limb was followed by imaging of the left). The MRI T2 value was measured to evaluate the degree of muscle recruitment and damage. All MRI images of the participants’ thighs were obtained by using a 1.5-T MR imaging system with a body coil. Transverse T2-weighted spin-echo images were subsequently obtained. The MRI data were evaluated for T2 relaxation time (T2 value) of the hamstring muscles. The signal intensity (SI) of each muscle (BFlh, ST, and SM) was also measured. A T2 measurement sequence with four TEs (30, 45, 60, and 75 ms) was applied to measure the absolute T2 value. Images taken at different TEs were fit to a monoexponential time curve to extract the T2 values, based on the formula: SI = M0 × exp(−TE/T2), where SI represents the SI at a given TE and M0 is the original MR SI. For comparison purposes, the averaged T2 mean value of each muscle was computed as a percentage change increase relative to the value measured before exercise. Typical T2-weighted MRI images of the thigh obtained from a subject at rest, immediately after, and 1, 2, 3, and 7 days after exercise are shown in Figs. 26.2 and 26.3; the absolute values for T2 at each exercise are shown in Tables 26.1 and 26.2. Figures 26.4 and 26.5 present changes in averaged T2 values of the individual muscles for each exercise. We found that the percentage changes in T2 immediately after the exercises were greater in all muscles at each exercise (P < 0.05). Two, 3, and 7 days after the exercise, a significant increase was identified only in the case of the ST muscle (P < 0.05) at 120 % ECC, and no significant change was identified in any muscle at 50 % 1RM. The degree of T2 value change immediately after the exercise were different between the muscles. The percentage change in the ST muscles were significantly greater than those in the BFlh and SM muscles for each exercise (P < 0.01). The absolute values of CSA for each exercise are shown in Tables 26.3 and 26.4. Figures 26.6 and 26.7 present changes in averaged CSA values of the individual muscles for each exercise. The degrees of CSA value changes were different between the muscles and the percentage changes in the ST muscle was significantly greater than those in the BFlh and SM muscles 3 days after 120 % 1RM exercise and immediate after 50 % 1RM exercise (P < 0.01).
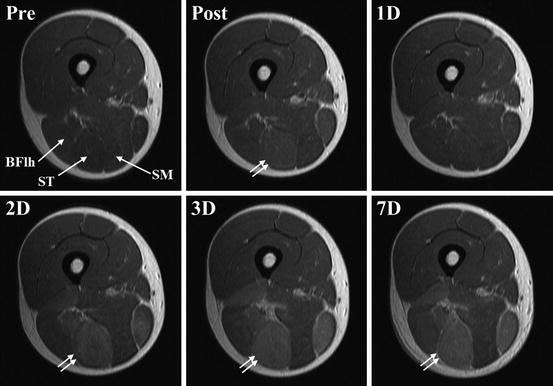
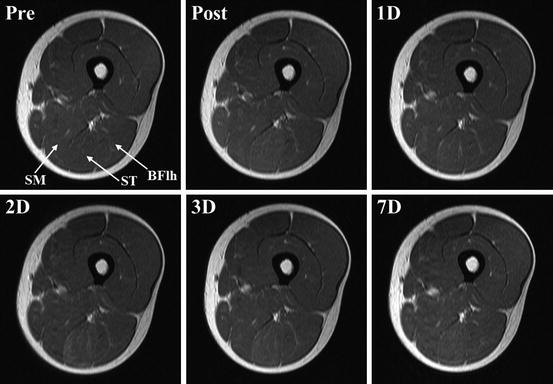
Fig. 26.2
Typical T2-weighted MR images (TR = 2,000 ms, TE = 30 ms) of the middle region (50 % of the thigh length) of the thigh at rest (Pre), immediately after (Post), and 1 (1D), 2 (2D), 3 (3D), and 7 (7D) days after the session of eccentric knee flexion at 120 % of the 1-RM. After the exercise, obvious SI increases were visible within the ST muscles (double white arrow). Images were obtained from 1 representative subject. BFlh, biceps femoris long head; ST, semitendinosus; SM, semimembranosus
Fig. 26.3
Typical T2-weighted MR images (TR = 2,000 ms, TE = 30 ms) of the middle region (50 % of the thigh length) of the thigh at rest (Pre), immediately after (Post), and 1 (1D), 2 (2D), 3 (3D), and 7 (7D) days after the session of eccentric knee flexion at 50 % of the 1-RM. After the exercise, no obvious SI increases were visible within the hamstring muscles. Images were obtained from 1 representative subject. BFlh, biceps femoris long head; ST semitendinosus, SM semimembranosus
Table 26.1
The absolute values for T2 at rest (Pre), immediately after (Post), and 1 (1D), 2 (2D), 3 (3D), and 7 (7D) days after the session of eccentric knee flexion at 120 % of the 1-RM
Pre | Post | 1D | 2D | 3D | 7D | |
|---|---|---|---|---|---|---|
T2(ms) BFlh | 40.2 ± 0.2 | 44.7 ± 1.3 | 42.7 ± 1.4 | 48.0 ± 4.8 | 49.2 ± 4.6 | 50.0 ± 4.6 |
ST | 37.4 ± 0.6 | 53.3 ± 2.5 | 49.0 ± 6.8 | 62.9 ± 9.8 | 74.0 ± 7.3 | 80.9 ± 9.9 |
SM | 38.4 ± 0.5 | 41.0 ± 1.0 | 38.9 ± 0.9 | 41.0 ± 2.5 | 43.5 ± 4.6 | 43.5 ± 4.1 |
Table 26.2
The absolute values for T2 at rest (Pre), immediately after (Post), and 1 (1D), 2 (2D), 3 (3D), and 7 (7D) days after the session of eccentric knee flexion at 50 % of the 1-RM
Pre | Post | 1D | 2D | 3D | 7D | |
|---|---|---|---|---|---|---|
T2(ms) BFlh | 39.5 ± 0.4 | 47.5 ± 1.3 | 40.2 ± 0.5 | 41.0 ± 1.1 | 42.2 ± 2.2 | 42.2 ± 2.9 |
ST | 37.0 ± 0.8 | 55.7 ± 1.8 | 39.3 ± 0.6 | 41.0 ± 1.7 | 40.7 ± 1.4 | 40.3 ± 1.3 |
SM | 38.5 ± 0.5 | 45.5 ± 1.8 | 38.8 ± 0.6 | 39.2 ± 0.8 | 38.9 ± 0.8 | 39.0 ± 0.7 |
Fig. 26.4
Percentage change in MRI T2 value of each hamstring muscle immediately after (Post), and 1 (1D), 2 (2D), 3 (3D), and 7 (7D) days after the session of eccentric knee flexion at 120 % of the 1-RM. Values are the percentage change compared with the values at rest. † P < 0.05, †† P < 0.01 vs the values at rest; φ P < 0.05 vs BFlh; ∗ P < 0.05, ∗∗ P < 0.01 vs SM. BFlh biceps femoris long head, ST semitendinosus, SM semimembranosus
Fig. 26.5
Percentage change in MRI T2 value of each hamstring muscle immediately after (Post), and 1 (1D), 2 (2D), 3 (3D), and 7 (7D) days after the session of eccentric knee flexion at 50 % of the 1RM. Values are the percentage change compared with the values at rest. † P < 0.05, †† P < 0.01 vs the values at rest; φ P < 0.05 vs BFlh; ∗∗ P < 0.01 vs SM. BFlh, biceps femoris long head; ST semitendinosus, SM semimembranosus
Table 26.3
The absolute values for CSA at rest (Pre), immediately after (Post), and 1 (1D), 2 (2D), 3 (3D), and 7 (7D) days after the session of eccentric knee flexion at 120 % of the 1-RM
Pre | Post | 1D | 2D | 3D | 7D | |
|---|---|---|---|---|---|---|
CSA (mm2) BFlh | 1,313.0 ± 67.4 | 1,327.4 ± 67.6 | 1,345.1 ± 65.0 | 1,416.1 ± 73.6 | 1,404.3 ± 81.4 | 1,354.9 ± 80.1 |
ST | 907.2 ± 40.2 | 1,051.1 ± 55.7 | 1,053.3 ± 73.4 | 1,195.0 ± 82.9 | 1,285.2 ± 72.2 | 1,210 ± 60.6 |
SM | 910.6 ± 36.8 | 907.4 ± 34.7 | 959.1 ± 41.0 | 975.8 ± 35.6 | 953.5 ± 50.5 | 975.6 ± 36.7 |
Table 26.4
The absolute values for CSA at rest (Pre), immediately after (Post), and 1 (1D), 2 (2D), 3 (3D), and 7 (7D) days after the session of eccentric knee flexion at 50 % of the 1-RM
Pre | Post | 1D | 2D | 3D | 7D | |
|---|---|---|---|---|---|---|
CSA (mm2) BFlh | 1,303.9 ± 76.5 | 1,375.9 ± 74.9 | 1,326.4 ± 70.5 | 1,317.2 ± 68.9 | 1,352.0 ± 78.6 | 1,308.1 ± 74.0 |
ST | 784.7 ± 43.7 | 955.1 ± 51.5 | 809.5 ± 40.3 | 854.6 ± 50.1 | 836.8 ± 48.5 | 832.9 ± 39.2 |
SM | 1,009.7 ± 59.9 | 1,032.9 ± 39.7 | 1,005.0 ± 42.4 | 1,023.1 ± 51.9 | 970.9 ± 32.3 | 1,003.8 ± 35.3 |
Fig. 26.6
 Injury and Illness Surveillance Among Olympic Athletes: Summary of the 2010 Winter, and the 2008 and 2012 Summer Olympic Games
Anterior Cruciate Ligament Injury Prevention in Female Adolescents
Concussion and Severe Head-Neck Injury: An Approach for Their Prevention in Rugby and Judo
Video Analysis of ACL Injury Mechanisms Using a Model-Based Image-Matching Technique
The Epidemiology of Low Back Disorders in Athletes
Sports Injury Surveillance in Japanese Junior and Senior High School Students
Injury and Illness Surveillance Among Olympic Athletes: Summary of the 2010 Winter, and the 2008 and 2012 Summer Olympic Games
Anterior Cruciate Ligament Injury Prevention in Female Adolescents
Concussion and Severe Head-Neck Injury: An Approach for Their Prevention in Rugby and Judo
Video Analysis of ACL Injury Mechanisms Using a Model-Based Image-Matching Technique
The Epidemiology of Low Back Disorders in Athletes
Sports Injury Surveillance in Japanese Junior and Senior High School Students


Percentage change in the CSAs of each muscle with time immediately after (Post), and 1 (1D), 2 (2D), 3 (3D), and 7 (7D) days after the session of eccentric knee flexion at 120 % of the 1RM. Values are the percentage change compared with the value at rest. † P < 0.05, †† P < 0.01 vs the values at rest; φ P < 0.05 vs BFlh; ∗ P < 0.05 vs SM. BFlh biceps femoris long head, ST semitendinosus, SM semimembranosus
Related posts:
Injury and Illness Surveillance Among Olympic Athletes: Summary of the 2010 Winter, and the 2008 and 2012 Summer Olympic Games
Anterior Cruciate Ligament Injury Prevention in Female Adolescents
Concussion and Severe Head-Neck Injury: An Approach for Their Prevention in Rugby and Judo
Video Analysis of ACL Injury Mechanisms Using a Model-Based Image-Matching Technique
The Epidemiology of Low Back Disorders in Athletes
Sports Injury Surveillance in Japanese Junior and Senior High School Students
Stay updated, free articles. Join our Telegram channel
Full access? Get Clinical Tree
