Male (n = 60)
Female (n = 56)
Age (years)
14.8 ± 1.5
14.7 ± 1.8
Height (cm)
162.0 ± 9.3
154.6 ± 5.9
Weight (kg)
54.3 ± 10.0
47.0 ± 7.1
Athletic career (years)
6.4 ± 1.8
6.3 ± 2.0
33.2.1 Site of Pain in Training Camp
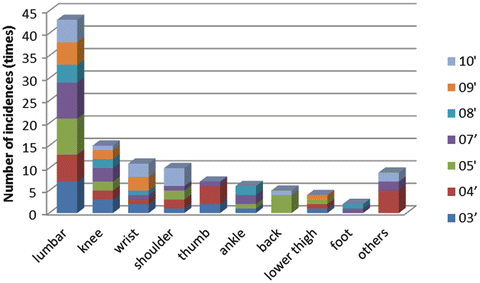
A total of 112 reports of pain were recorded. Among all types of injuries, the highest incidence was for LBP (38.4 %) in elite junior divers in Japan (Fig. 33.1).


Fig. 33.1
Body parts associated with pain during training camp
33.2.2 Dimension of LBP
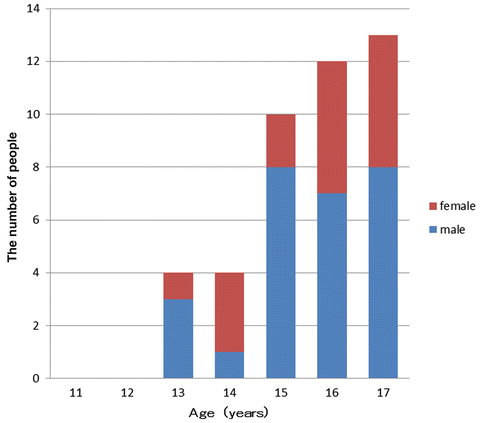
LBP in the divers became more prevalent as the divers’ age increased (Fig. 33.2).


Fig. 33.2
The number of low back pain divers of each age
33.2.3 Direction of Motion with LBP
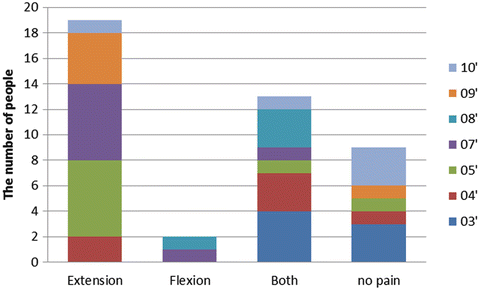
Thirty four of the 43 divers with LBP (79.1 %) experienced the pain during movement; of the 34, 19 (55.9 %) experienced pain only during extension, 13 during both extension and flexion (38.2 %), and 2 only during flexion (5.9 %) (Fig. 33.3).


Fig. 33.3
Type of motion associated with low back pain
33.2.4 The Occurrence Situation of LBP
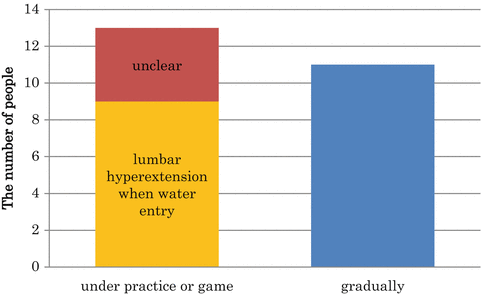
24LBP reported for pain questionnaire before for 1 year training camp. The nine (38.0 %)LBP have generated with hyperextension at the entry phase. The 11 (46.0 %) cause of LBP was unclear and that occurred gradually (Fig. 33.4).


Fig. 33.4
The occurrence situation of LBP
33.3 Third Section: Critical Factors for the Prevention of Low Back Pain in Elite Junior Divers (Second Step)
Our description in the Second section noted that the incidence of LBP in junior divers aged 13–17 was quite high (38.4 %). A number of other researchers have also found that LBP is the most frequently reported symptom in divers (Badman and Rechtine 2004; Narita et al. 2011; Ito 2007; Rubin 1999; Keene 1985; Carter 1986). However, these divers were still able to continue to practice with LBP (Badman and Rechtine 2004). Meeuwisse suggested that there are potential intrinsic and extrinsic risk factors for sports-related injuries; age, sex, physical characteristics, aptitude, psychological characteristics, health status, and history of injury are all considered intrinsic factors (Meeuwisse 1994). However, Steffen and colleagues (2010) acknowledged that few studies have been conducted regarding the risks for sports-related injuries, and that there is a need to elucidate the risk factors, mechanisms, and prevention methods for high-level athletes. This lack is also true for competitive diving, since relatively few reports exist regarding the risks for injury. Understanding the athlete’s intrinsic risk factors for injury incidence is necessary to establish a viable prevention plan. Therefore, in this section we investigate the intrinsic factors that correlate with the risk factors for LBP in competitive divers.
Eighty-three elite junior divers (42 males, 41 females) in Japan were included in this study (Table 33.2). LBP was assessed by questionnaire, interview, and physical examination during a national training camp. Morphologic data, physical fitness, and diving skills were also evaluated. The factors related to LBP were extracted by using logistic-regression analysis and the forward selection method (likelihood ratio).
Table 33.2
Characteristics of the participants
Male, mean (SD) | Female, mean (SD) | |
|---|---|---|
Age, year | 14.5 (1.6) | 14.3 (1.8) |
Height, cm | 161.8 (9.1) | 154.8 (6.2) |
Weight, kg | 54.1 (9.8) | 46.5 (7.2) |
Body mass index, kg/m2 | 20.7 (2.1) | 19.4 (2.1) |
Diving experience, year | 6.1 (1.8) | 6.0 (2.2) |
33.3.1 Comparison of the LBP and No-LBP Groups
Table 33.3 shows the physical and fitness characteristics of both groups. Eighteen of 42 male divers reported LBP. The following characteristics showed a significant difference between the LBP and no-LBP groups: age, weight, body mass index, back muscle strength, body anteflexion, body retroflexion, vertical jump, standing long jump, shoulder rotation width, and hand stand posture.
Table 33.3
Comparison of LBP and no-LBP groups
Male, mean (SD) | Female, mean (SD) | |||||
|---|---|---|---|---|---|---|
Overall | LBP group | No-LBP group | Overall | LBP group | No-LBP group | |
Age, year | 14.5 (1.6) | 15.6 (1.4)** | 13.8 (1.3)** | 14.3 (1.8) | 15.5 (1.6)** | 13.8 (1.7)** |
Height, cm | 161.8 (9.1) | 164.9 (7.1) | 159.4 (9.8) | 154.8 (6.2) | 157.5 (4.6) | 153.5 (6.5) |
Weight, kg | 54.1 (9.8) | 57.8 (8.8)* | 51.2 (9.7)* | 46.5 (7.2) | 50.1 (5.5)*
Stay updated, free articles. Join our Telegram channel
Full access? Get Clinical Tree
 Get Clinical Tree app for offline access

| |


