Abstract
Objective
The purpose of our study was to compare plantar pressure asymmetry and step-to-step reproducibility in both able-bodied persons and two groups of hemiplegics. The relevance of the research was to determine the efficiency of asymmetry and reproducibility as indexes for diagnosis and rehabilitation processes.
Material and method
This study comprised 31 healthy young subjects and 20 young subjects suffering from cerebral palsy hemiplegia assigned to two groups of 10 subjects according to the severity of their musculoskeletal disorders. The peaks of plantar pressure and the time to peak pressure were recorded with an in-shoe measurement system. The intra-individual coefficient of variability was calculated to indicate the consistency of plantar pressure during walking and to define gait stability. The effect size was computed to quantify the asymmetry and measurements were conducted at eight footprint locations.
Results
Results indicated few differences in step-to-step reproducibility between the healthy group and the less spastic group while the most affected group showed a more asymmetrical and unstable gait.
Conclusion
From the concept of self-optimisation and depending on the neuromotor disorders the organism could make priorities based on pain, mobility, stability or energy expenditure to develop the best gait auto-optimisation.
Résumé
Objectif
Le but de notre étude était de comparer l’asymétrie des pressions plantaires et la reproductibilité pas-à-pas chez des personnes valides et dans deux groupes de sujets hémiplégiques en vue de déterminer la pertinence des indices d’asymétrie ou de reproductibilité dans les processus de diagnostic et de rééducation.
Matériel et méthode
Cette étude comprend 31 jeunes sujets sains et 20 jeunes sujets hémiplégiques divisés en deux groupes de dix sujets selon la sévérité de leurs troubles musculosquelettiques. Les pics de pression plantaire et le temps de survenue de ce pic étaient enregistrés avec un système de semelles embarquées. Le coefficient de variabilité intra-individuelle était calculé pour apprécier la stabilité du patron de marche. Un effect size était calculé pour quantifier l’asymétrie et les mesures étaient réalisées à huit endroits différents de l’empreinte plantaire.
Résultats
Les résultats montrent peu de différence de reproductibilité pas à pas entre les sujets sains et le groupe le moins spastique alors que le groupe le plus atteint montrait une marche asymétrique et instable.
Conclusion
En ce qui concerne le concept d’auto-optimisation et en fonction des dysfonctionnements neuromoteurs, l’organisme pourrait choisir des priorités selon la douleur, la mobilité, la stabilité ou la dépense énergétique pour optimiser au mieux la marche.
1
English version
1.1
Introduction
Numerous and varied gait parameters, from a large sample of non-disabled subjects, are often used as databases and reference values in order to define a “normal” walking pattern. In gait rehabilitation, therapeutic interventions or surgical treatment aim to bring the subject’s gait as close as possible to this reference described by mean and standard deviation, which do not take the asymmetry into account. Nevertheless, in this context, the quantification of the asymmetry may be considered as an important issue for rehabilitation. Gait symmetry has been defined as a perfect agreement between the actions of the lower limbs or when no statistical differences are noted in parameters measured bilaterally . Some studies have measured kinetic parameters, especially ground reaction forces, to characterize an asymmetrical contribution of lower limbs during the stance phase in able-bodied gait . As an example, the study by Potdevin et al. used effect size (ES) to quantify plantar pressure asymmetry. The author showed small to moderate asymmetry under specific foot areas. These findings appeared as being decisive in order to differentiate between a normal and a pathological gait or to discuss the different functions performed by the lower limbs during walking . Many authors have explained these asymmetries, notably in healthy subject, by a possible limb function such as a propulsive limb versus a braking limb or a propulsive limb versus a support limb . Considering this point of view, asymmetry in cerebral palsied adolescents might not reveal the pathological character of the gait but would appear to stem from a functional and complementary walking organization of the lower limbs allowing the subject to optimize his/her gait pattern in order to guarantee stability, mobility and even a decrease in the energy expended in walking . According to the dynamical systems approach stability is a variable critically constraining the emergence of the preferred movement pattern. The principle of self-optimization emphasized that the realization of a movement pattern may be a result of many constraints that minimize the cost to the system . Biswas et al. explained that stability evaluation in clinical environments can be affected by several parameters such as the assessor’s reaction time or the subjective scoring by an evaluator using observational scales . The intra-individual coefficient of variability (CoVi) computed over consecutive steps, is described as a useful tool for the evaluation of walking . In the study by Milani et Henning, the CoVi was based on plantar pressures . The authors explained that this step-to-step reproducibility could define stability and characterized the efficiency of the balance process. In this way, asymmetry and stability parameters might reveal the walking strategy and thus could be considered useful in diagnosis of pathological gait or to guide the rehabilitation process.
In the present study, we aimed to compare gait asymmetry and steps-to-step reproducibility between a control group and hemiplegic adolescents with different levels of disability.
1.2
Methods
1.2.1
Subjects
Thirty-one healthy young subjects (14 males and 17 females) took part in the study after providing their informed written consent in accordance with a protocol approved by the centre hospitalier régional universitaire review board. The mean age of the control group (CG) was 17.2 years (S.D., 2.3), height was 171.9 cm (S.D., 8.0) and body mass was 65.2 kg (S.D., 10.9).
Healthy subjects with physical abnormalities (extreme foot flexibility or joint laxity, pes planus, pes cavus, Morton’s feet), who were injured, or who had undergone surgery on a leg or foot during the past two years, which could imply abnormal gait and disturbed plantar pressure distribution, were not enrolled.
Twenty subjects suffering from cerebral palsy hemiplegia, from two rehabilitation centres, were assigned to two groups of 10 subjects (H1 and H2) according to the severity of their musculoskeletal disorders. The mean age of H1 and H2 was 12.1 years (S.D., 3.2) or 12.9 years (S.D., 2.8), height was 145 cm (S.D., 1.6) or 151 cm (S.D., 0.14) and body mass was 43.7 kg (S.D., 8.4) or 48.7 kg (S.D., 9.7), respectively.
A clinical examination allowed us to select the patients without any associated problems that could influence their gait (athetosis, mental deficiency, severe visual problems). Severe sensory deficits were absent in all patients. Subjects were assigned to one of two groups according to the severity of their spasticity. The spasticity of all subjects was assessed by the same examiner using passive mobilization of the leg. The reflex contraction of the stretched muscle was assessed by the method of Ashworth. The spasticity scores were evaluated for the quadriceps and the triceps surae. The Hemi 1 subjects all had minor spasticity. The spasticity scores were measured between 0 and 2 according to the Ashworth methodology. The Hemi 2 subjects suffered from major spasticity. The spasticity score were measured between 2 and 4. A muscular function testing of the ankle was performed. The muscular function testing scale is presented in the Table 1 . The detailed clinical assessment data are presented in Table 2 . All the subjects had to be able to walk 30 m independently and without walking devices. Moreover, the walking speed was an interesting way to determine the two groups. All subjects in Hemi 1 (0.97 m/s) walked faster than 0.92 m/s while subjects in Hemi 2 walked more slowly than 0.92 m/s.
| 5 | Movement carried out against a strong resistance |
| 4 | Movement carried out against an average resistance |
| 3 | Movement carried out against gravity |
| 2 | Movement carried out against gravity but without full amplitude |
| 1 | Muscular contraction without movement |
| 0 | No contraction, no movement |
| Patient | Spasticity score | Muscular testing | Foot disorder | ||
|---|---|---|---|---|---|
| Quadriceps | Triceps surae | Dorsiflexion | Plantar flexion | ||
| Hemi 1 | |||||
| 1 | 1 | 1 | 4 | 4 | No |
| 2 | No | 1 | 4 | 5 | No |
| 3 | 1 | 1 | 3 | 4 | Equinus |
| 4 | 1 | 2 | 4 | 4 | Equinus |
| 5 | No | 1 | 4 | 5 | No |
| 6 | 1 | 1 | 3 | 4 | Equinus |
| 7 | No | 1 | 4 | 4 | No |
| 8 | 1 | 1 | 3 | 4 | No |
| 9 | No | 1 | 4 | 4 | No |
| 10 | No | 1 | 4 | 4 | No |
| 11 | 1 | 2 | 3 | 4 | Equinus |
| 12 | 1 | 1 | 4 | 4 | No |
| Hemi 2 | |||||
| 13 | 2 | 3 | 3 | 2 | Equinovarus |
| 14 | 3 | 4 | 3 | 2 | Equinovarus |
| 15 | 2 | 3 | 3 | 2 | Equinovarus |
| 16 | 3 | 4 | 2 | 2 | Equinovarus |
| 17 | 3 | 4 | 2 | 2 | Equinovarus |
| 18 | 3 | 4 | 3 | 2 | Equinovarus |
| 19 | 3 | 4 | 2 | 2 | Equinovarus |
| 20 | 3 | 4 | 3 | 2 | Equinovarus |
1.2.2
Measuring system
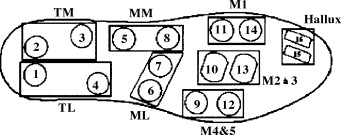
The plantar pressures were recorded with an in-shoe pressure measurement system (Parotec, Paromed GmbH, D-8201, Markt Neubeuern, Germany) over eight consecutive steps, in order to not disturb the natural walking pattern. The system consisted of two insoles and a data acquisition box carried on the belt with the sampling rate set at 150 Hz. Each insole contains 16 microsensors mounted within a constrained hydrocell. In the study of gait asymmetry, an important advantage of this system over platform devices is that many consecutive ground contacts can be recorded, as suggested by Sadeghi et al. . Thus, we can study lower extremity disorders and step-to-step compensation strategies. The literature concerning plantar pressure commonly reports the measurement of eight footprint locations described by Milani and Hennig . For this study, the 16 hydrocell sensors included in each insole were grouped by size and shape to describe eight footprint locations: lateral (LH) and medial heel (MH), lateral (LM) and medial midfoot (MM), 4th–5th (M4–5), 2nd–3rd (M2–3) and 1st metatarsal heads (M1), and the Hallux ( Fig. 1 ). The specificities of the sensors were:
- •
diameter 22 mm;
- •
active sensing diameter 18 mm;
- •
thickness 3 mm;
- •
measurement range 0 to 625 kPa;
- •
uncertainty ±1%;
- •
stability ± 2% (at 400 kPa; deviation ± 2.5 kPa);
- •
hysteresis 0.1 kPa;
- •
the sampling frequency for each channel 150 Hz .
1.2.3
The walking test
All subjects were tested during overground locomotion at their preferred speed over a distance of 20 meters. Spontaneous velocity was preferred to impose velocity since asymmetry increases when horizontal velocity was 10% lower than spontaneous velocity . The test was explained to all subjects, who underwent a period of familiarization with the system. All subjects wore the same type of neoprene shoe. This choice was dictated by the need for an insole without a plantar arch, in order to match the form of the Parotec insoles. Walking tests were performed after the children’s braces (specific to each individual) were removed, in order not to bias the results and to allow a comparison between both limbs.
Several studies have already shown that at least three recordings are necessary to obtain valid results . Chesnin et al. recommended carrying out multiple trials to assure reliability of the data being interpreted . Hence, our control group and both the hemiplegic groups underwent four consecutive walking tests, providing a total of 32 steps per subject.
1.2.4
Experimental parameters
To investigate the intrasubject step-to-step variation during the walking test, the CoVi ( CoVi=mean/S.D.
C o V i = m e a n / S . D .
) from time to peak pressure (TPP) and the peak plantar pressure (PPP) were calculated over 32 steps for each subject and averaged for each group. The CoVi indicates the consistency of plantar pressure during walking .
The ES analysis was applied to quantify the magnitude of the bilateral difference in PPP and TPP values at each of the eight footprint locations. The ES formula on peak plantar pressure is given below:
E S = ( P P P 1 ¯ − P P P 2 ¯ ) ( n − 1 ) ( σ P P P 1 2 + σ P P P 2 2 ) / ( 2 n − 2 )
Related posts:
 The European Journal of Physical and Rehabilitation Medicinein 2008: A year in a paper
Neuropsychological disorders induced by cerebellar damage
Agenda
Strategies for spinal cord repair after injury: A review of the literature and information
Physiological responses in handcycling. Preliminary study
Upper limb assessment in children with cerebral palsy: Translation and reliability of the French version for the Melbourne unilateral upper limb assessment ( test de Melbourne)
The European Journal of Physical and Rehabilitation Medicinein 2008: A year in a paper
Neuropsychological disorders induced by cerebellar damage
Agenda
Strategies for spinal cord repair after injury: A review of the literature and information
Physiological responses in handcycling. Preliminary study
Upper limb assessment in children with cerebral palsy: Translation and reliability of the French version for the Melbourne unilateral upper limb assessment ( test de Melbourne)
Stay updated, free articles. Join our Telegram channel

Full access? Get Clinical Tree


