Year
Injuries, no.
Injury rate
2009
256,369
8,864
2010
264,369
9,294
2011
268,608
9,452
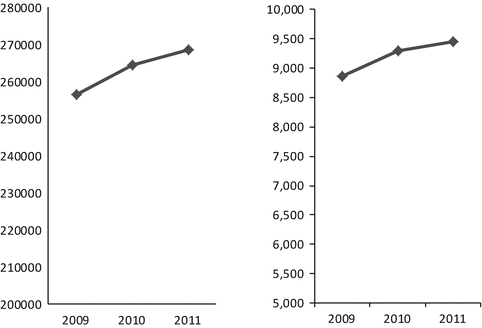
Fig. 2.1
The number (left) and rate (right) of sports-related injuries from all 11 sports
The Number and Rate of Sports-Related Injuries in Male and Female Students
Although the number of injuries for male students was more than twice that of female students, the rate of injury did differ minimally with respect to sex. The number of injuries increased slightly each year for both sexes (Table 2.2, Fig. 2.2).
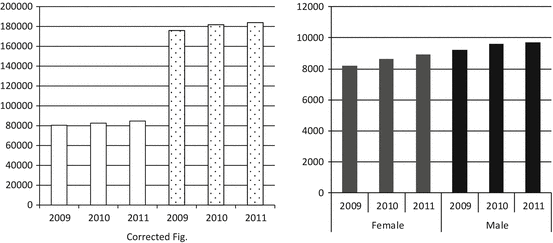
Table 2.2
The number and rate of sports-related injuries in male and female students
Sex | Year | Injuries, no. | Injury rate |
|---|---|---|---|
Female | 2009 | 80,440 | 8,188 |
2010 | 82,574 | 8,639 | |
2011 | 84,651 | 8,914 | |
Male | 2009 | 175,929 | 9,211 |
2010 | 181,795 | 9,625 | |
2011 | 183,957 | 9,723 |

Fig. 2.2
The number (left: corrected Fig.) and rate (right) of sports-related injuries in male and female students
The Number and Rate of Sports-Related Injuries in Junior and Senior High School Students
The number of injuries was 1.5-fold higher in junior high school students than in senior high school students and increased slightly each year for both junior and senior high school students. The rate of injury was slightly higher in senior high school than in junior high school students (Table 2.3, Fig. 2.3).
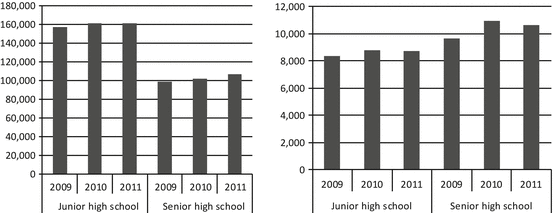
Table 2.3
The number and rate of sports-related injuries in junior and senior high school students
Injury | Junior high school | Senior high school | ||||
|---|---|---|---|---|---|---|
2009 | 2010 | 2011 | 2009 | 2010 | 2011 | |
Injuries, no. | 157,347 | 161,817 | 161,545 | 99,022 | 102,552 | 107,063 |
Injury rate | 8,351 | 8,790 | 8,723 | 9,669 | 10,973 | 10,639 |

Fig. 2.3
The number (left) and rate (right) of sports-related injuries in junior and senior high school students
The Number of Sports-Related Injuries by Month
The number of injuries demonstrated a similar trend during the year for each of the three years of the study period: the greatest number of sports-related injuries occurred in the beginning of the school term, especially in May. This shows the importance of executing the prevention program beginning at the start of the school term and continuing it through the summer (Table 2.4, Fig. 2.4).
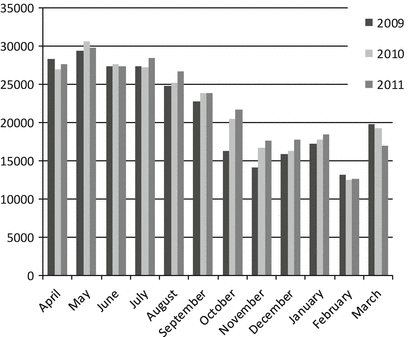
Table 2.4
The number of sports-related injuries by month
Month\year | 2009 | 2010 | 2011 |
|---|---|---|---|
April | 28,313 | 26,965 | 27,553 |
May | 29,389 | 30,569 | 29,828 |
June | 27,404 | 27,649 | 27,367 |
July | 27,401 | 27,259 | 28,370 |
August | 24,821 | 25,209 | 26,623 |
September | 22,762 | 23,859 | 23,852 |
October | 16,293 | 20,399 | 21,681 |
November | 14,107 | 16,629 | 17,645 |
December | 15,821 | 16,300 | 17,718 |
January | 17,232 | 17,807 | 18,414 |
February | 13,096 | 12,515 | 12,571 |
March | 19,730 | 19,209 | 16,986 |

Fig. 2.4
The number and rate of sports-related injuries by month
The Number of Sports-Related Injuries by Body Part
The body part most frequently injured was the ankle joint, followed by the hand and finger, head, and knee joint (Table 2.5, Fig. 2.5).
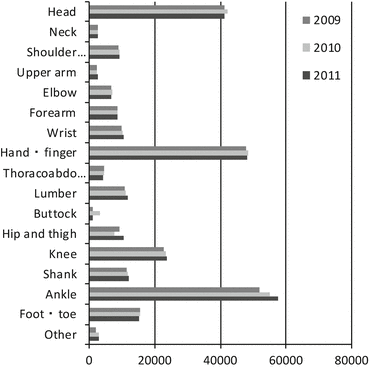
Table 2.5
The number of sports-related injuries by body part
Body part\year | 2009 | 2010 | 2011 |
|---|---|---|---|
Head | 41,326 | 42,160 | 41,366 |
Neck | 2,566 | 2,701 | 2,424 |
Shoulder complex | 8,957 | 9,055 | 9,275 |
Upper arm | 2,120 | 2,123 | 2,523 |
Elbow | 6,711 | 6,805 | 6,710 |
Forearm | 8,466 | 8,491 | 8,681 |
Wrist | 9,735 | 9,958 | 10,511 |
Hand finger | 48,001 | 48,529 | 48,315 |
Thoracoabdominal | 4,379 | 4,495 | 4,094 |
Lumbar | 10,684 | 10,934 | 11,634 |
Buttock | 1,030 | 3,056 | 1,027 |
Hip and thigh | 9,165 | 7,442 | 10,515 |
Knee | 22,633 | 23,409 | 23,711 |
Shank | 11,479 | 11,676 | 12,006 |
Ankle | 51,922 | 55,172 | 57,731 |
Foot toe | 15,384 | 15,467 | 15,107 |
Other | 1,811 | 2,896 | 2,978 |

Fig. 2.5
The number of sports-related injuries by body part
The Number of Sports-Related Injuries by Type
The most frequent type of injury was bone fracture, followed by joint sprain and contusion/bruise (Table 2.6, Fig. 2.6)
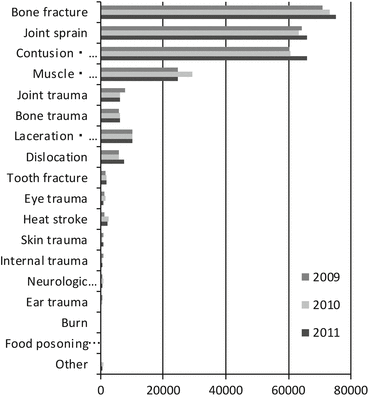
Table 2.6
The number of sports-related injuries by type
Type\year | 2009 | 2010 | 2011 |
|---|---|---|---|
Bone fracture | 71,058 | 73,363 | 75,066 |
Joint sprain | 64,131 | 63,450 | 65,996 |
Contusion bruise | 60,260 | 60,745 | 66,046 |
Muscle tendon strain | 24,575 | 29,211 | 24,522 |
Joint trauma | 7,664 | 6,137 | 6,138 |
Bone trauma | 5,716 | 6,141 | 6,047 |
Laceration abrasion | 9,939 | 10,144 | 10,005 |
Dislocation | 5,893 | 5,872 | 7,492 |
Tooth fracture | 1,581 | 1,733 | 1,845 |
Eye trauma | 1,299 | 1,537 | 866 |
Heat stroke | 1,137 | 2,331 | 2,080 |
Skin trauma | 712 | 624 | 736 |
Internal trauma | 962 | 542 | 406 |
Neurologic trauma | 525 | 956 | 602 |
Ear trauma | 427 | 578 | 260 |
Burn | 115 | 105 | 71 |
Food poisoning other poisoning | 75 | 78 | 59 |
Other | 300 | 822 | 371 |

Fig. 2.6
The number of sports-related injuries by type
The Number and Rate of Sports-Related Injuries by Sport
The sport with the largest total number of injuries was basketball, followed by soccer and baseball (Table 2.7, Fig. 2.7). The sport with the highest frequency of injury was rugby, followed by Judo and basketball (Table 2.8, Fig. 2.8). Notably, these results showed a trend towards a gradual increase in the number and rate of sports-related injuries for many sports.
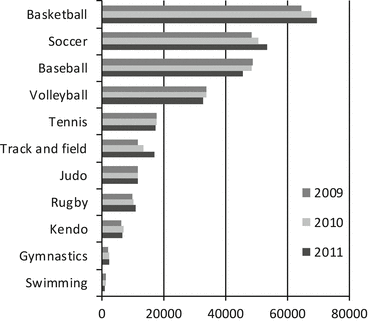
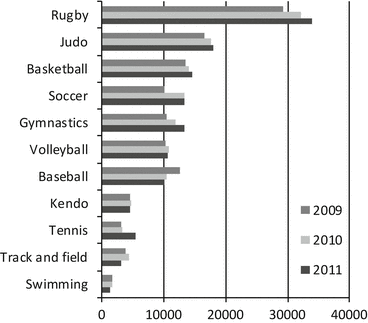
Table 2.7
The number of sports-related injuries by sport
Sport\year | 2009 | 2010 | 2011 |
|---|---|---|---|
Basketball | 64,448 | 67,495 | 69,335 |
Soccer | 48,304 | 50,594 | 53,465 |
Baseball | 48,603 | 48,400 | 45,580 |
Volleyball | 33,722 | 33,789 | 32,824 |
Tennis | 17,757 | 17,733 | 17,283 |
Track and field | 11,804 | 13,547 | 17,226 |
Judo | 11,803 | 11,864 | 11,749 |
Rugby | 10,057 | 10,320 | 10,881 |
Kendo | 6,563 | 6,943 | 6,684 |
Gymnastics | 2,040 | 2,315 | 2,601 |
Swimming | 1,268 | 1,369 | 980 |

Fig. 2.7
The number of sports-related injuries by sport
Table 2.8
The rate of sports-related injuries by sport
Sport\year | 2009 | 2010 | 2011 |
|---|---|---|---|
Rugby | 29,204 | 32,051 | 33,923 |
Judo | 16,592 | 17,536 | 17,954 |
Baseball | 13,411 | 14,029 | 14,542 |
Soccer | 10,172 | 13,240 | 13,330 |
Gymnastics | 10,388 | 11,857 | 13,299 |
Volleyball | 10,293 | 10,851 | 10,697 |
Baseball | 12,663 | 10,499 | 10,140 |
Kendo | 4,506 | 4,755 | 4,579 |
Tennis | 3,125 | 3,235 | 5,393 |
Track and field | 3,799 | 4,268 | 3,164 |
Swimming | 1,688 | 1,756 | 1,232 |

Fig. 2.8
The rate of sports-related injuries by sport
2.3.2 Analysis of Individual Sports-Related Injuries
Severe Head and Neck Injury
More than 500 cases of severe head and neck injury were reported every year, and the number increased each year (Table 2.9, Fig. 2.9). When assessed separately, the numbers of both head injuries and neck injuries also increased every year.
Table 2.9
The number (left) of severe head and neck injuries and the rate (right) of severe head injuries by year
Injury
Stay updated, free articles. Join our Telegram channel
Full access? Get Clinical Tree
 Get Clinical Tree app for offline access

| |||
|---|---|---|---|


