Fig. 1.1
Incidence of sports related injury (annually) from 2009 to 2011. (a) Numbers of incidence, (b) incidence rate (per 100,000 people), and (c) numbers of incidence by sex
1.2.2 Incidence by Age Bracket
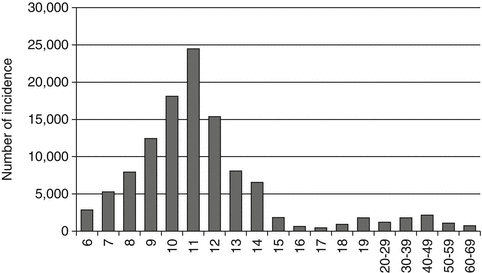
The injury incidence by age bracket is described in Fig. 1.2. The incidence increases abruptly with increase in age up to 11. As mentioned above, since the statistics provided here do not include the incidence among junior high school and high school students during their official school activities (physical education class and club activities), the values reported here do not cover the actual incidence for those age groups (12–18). After high school (19 and higher), the numbers show a slight increase. This does not necessarily mean there was an increase in incidence rate. Rather, the increase likely occurred because Japan Sports Council insurance cannot be applied for after high school. In addition, there is an apparent decrease in incidence over the age of 70 (data not shown in the figure), but this is due to a considerable decrease of participation in sports activities in this age group and therefore also in subscribers.


Fig. 1.2
Incidence by age. Numbers for the ages of 20–29, 30–39, 40–49, 50–59, and 60–69 represent the average in the respective age groups
1.2.3 Incidence by Month
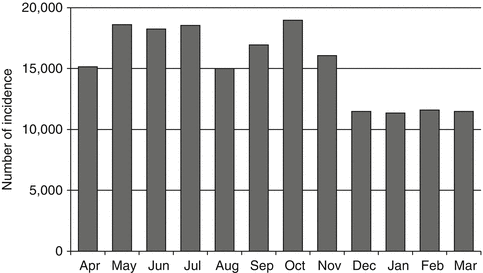
Figure 1.3 portrays the injury incidence numbers on a monthly basis. From April when school year begins in Japan, there is a considerable increase that continues through November. During the winter (December through March), although the incidence still exceeds 10,000, the numbers decrease abruptly in comparison to the rest of the year since sports activities, except for winter sports, are less frequent during this time.


Fig. 1.3
Incidence by month
1.2.4 Most Frequent Anatomical Sites
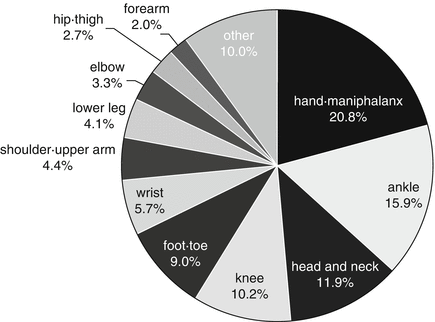
Injury incidence by anatomical site is shown in Fig. 1.4. The hand maniphalanx region had the highest incidence, accounting for 20.8 % of the total. For other sites, the corresponding percentage incidences (in decreasing order) were: ankle, 15.9 %; head and neck, 11.9 %; knee, 10.2 %; and foot toe regions, 9.0 %. With a regional categorization, the incidences were: upper extremity 36.3 %, lower extremity 41.8 %, head and neck 11.9 %, and trunk 6.5 %. It is clear that the incidence of sports-related injuries is predominantly focused on the limbs.


Fig. 1.4
Injury incidence by anatomical site
1.2.5 Major Injury (and by Gender)
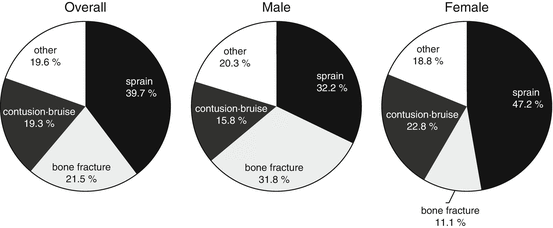
Incidence of injury by sprain, bone fracture, contusion bruise, and “other” is described in Fig. 1.5 for the overall population. The breakdown by gender is also shown, and indicatest that the injury distribution differs considerably for the two sexes. For example, in contrast to the incidence of sprain in males, where it accounts for approximately 30 % of the injuries, in females sprains account for nearly half of the total. On the other hand, while the, incidence of bone fracture is as high as that of sprain in males (31.8 %), bone fractures in females account for only 11.1 % of the total. Given the prominent difference between males and females, we will next look into the specific injury, particularly from the perspective of gender. Figure 1.6 shows the ten most frequent injuries for males and females. Generally, the incidence rate is high in the regions of the hand maniphalanx and also for joints in the lower extremity such as the ankle and knee. In males, but not in females, contusion bruise and wound in the head and neck region are frequent, which is considered to be due to a difference in the type of sports males engage in. Although for both males and females the most frequently injured anatomical the region is hand maniphalanx, the types of injury in males and females differs. Bone fracture dominates the incidence in males (bone fracture in hand maniphalanx (11.9 %) and wrist (3.9 %),while in females the incidence of sprain is relatively high. In other regions such as the knee and ankle, there are considerably higher rates of incidence of sprain in females than in males.


