Fig. 9.1
Accessing the summary news release and statistics for the US Bureau of Labor Statistics Industry Injury and Illness Data
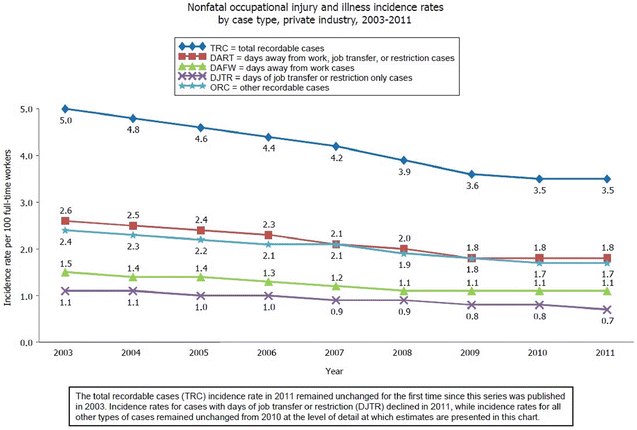
Fig. 9.2
US Bureau of Labor Statistics national incidence data for workplace injuries and illnesses. Source: U.S. Bureau of Labor Statistics, U.S. Department of Labor, October 2012
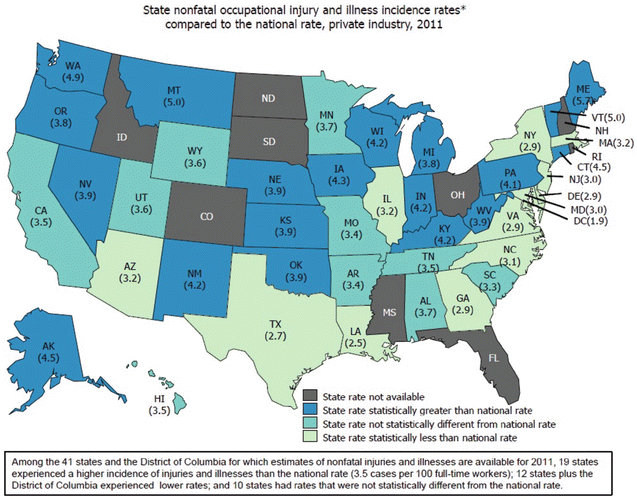
Fig. 9.3
US Bureau of Labor Statistics incidence data for workplace injuries and illnesses by US states. Asterisk: Total recordable case (TRC) incidence rate per 100 full-time workers. Source: U.S. Bureau of Labor Statistics, U.S. Department of Labor, October 2012
Similarly, a rich resource of data is available for the case and demographic characteristics of work-related injuries and illnesses involving days away from work. Similar to the data on incidence rate, an ideal starting point would be the summary news release and statistics report (e.g., for year 2011, http://www.bls.gov/news.release/archives/osh2_11082012.pdf). The summary report provides detailed information on the incidence rates by gender, age group, type of occupations that have the most frequent injuries, the nature of injuries (e.g., fall, strain), the injured musculoskeletal area (e.g., back injuries account for the majority at 36 %), and the median days away from work (by occupation/industry as well as by injured musculoskeletal region). Figures 9.4 and 9.5 illustrate some examples of the type of charts available in the BLS case and demographic reports for work-related injuries involving days away from work.
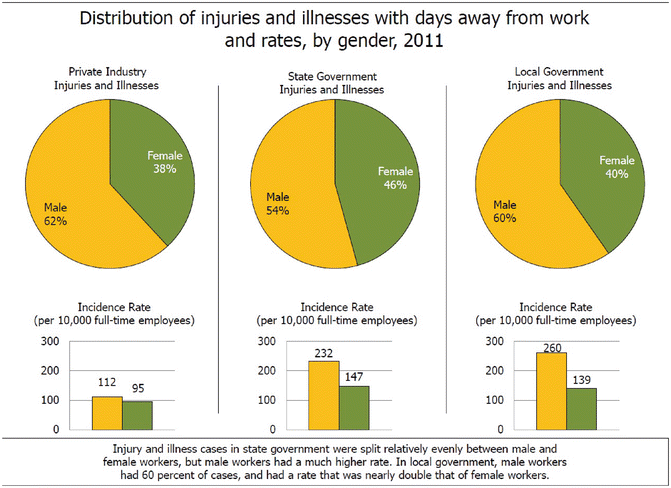
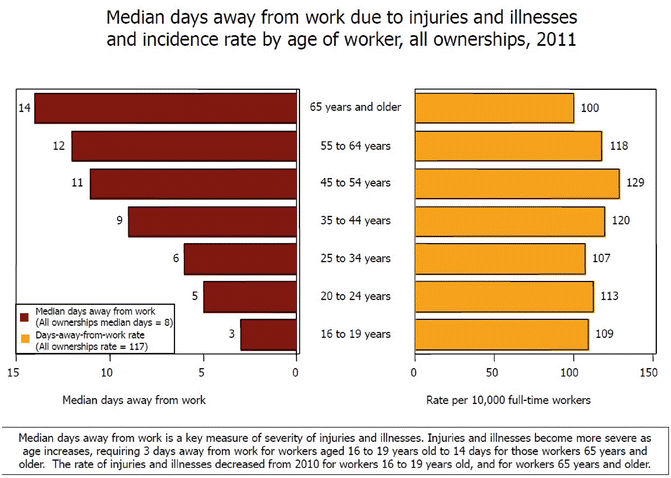

Fig. 9.4
US Bureau of Labor Statistics distribution of injuries and illnesses with days away from work by sex. Source: Bureau of Labor Statistics, U.S. Department of Labor, November 2012

Fig. 9.5
US Bureau of Labor Statistics median days away from work by age group. Source: Bureau of Labor Statistics, U.S. Department of Labor, November 2012
Although for most purposes the summary reports and charts from each of the two major categories of data discussed above will be all that is required to obtain relevant statistics for research and reporting, readers can also peruse the variety of supplemental data tables available that go into very granular detail such as the type of injury for each industry sector and the related incidence rates and resulting median days away from work. Having the incidence data is the first step toward estimating the impact of chronic pain and disability due to work-related injuries. We now focus on sources for estimating the costs of work-related injuries and its resulting pain and disability.
Estimating Costs Associated with Occupational Pain and Disability
The task of accurately estimating and quantifying the costs associated with occupational pain and disability is complex and requires attention to details, such as the specific medicolegal jurisdiction under study. However, there are various sources and guidelines available to aid in undertaking this task. To begin, one must first understand the broad categories of costs usually associated with occupational pain and disability. Associated costs can be broadly categorized into direct costs (e.g., medical costs, indemnity/disability benefits) and indirect costs (e.g., productivity losses and other intangible costs). While the cost components in this chapter are emphasized due to their central importance to occupational pain and disability and availability of online resources in quantifying these costs, readers are encouraged to familiarize themselves with broader definitions of cost components as discussed in Haddix, Corso, and Gorsky (2003) and Luce, Manning, Siegel, and Lipscomb (1996).
Depending on the nature of the intervention, medical costs may include any screening and diagnostics, specific surgical or nonsurgical intervention, hospitalization costs, medication, and visits to healthcare providers (Haddix et al., 2003). Indemnity or disability compensation includes any type of compensation such as Workers’ Compensation wage-replacement schemes, lump-sum payments, and Federal, State, or private short-term or long-term disability (LTD) insurance (e.g., impairment benefits, Social Security Disability Insurance (SSDI), short-term disability (STD) and LTD policies).
Productivity losses involve any costs associated with the patient’s inability to engage in occupational activities, leisure activities, or activities of daily living during the period of intervention and also any period following the intervention. The most common cost associated with productivity losses is the patient’s time spent receiving the intervention. For occupational disability, productivity losses mainly focus on the inability to return to work or engage in gainful employment, either through absenteeism or presenteeism (Langleya et al., 2010).
Finally, intangible costs refer to any type of costs associated with the intervention or outcomes that are often difficult to estimate or express in monetary units. Within the healthcare setting, intangible costs refer to resulting differences among the interventions being investigated on constructs such as pain, function, emotional distress, and quality of life (Haddix et al., 2003). Although these are not domains that can be expressed in monetary units, and therefore outside the scope of this chapter, it should be stressed that these are often useful outcomes to monitor (Turk & Melzack, 2011) within the context of a cost-benefit appraisal of treatment modalities or policy guidelines that impact patients suffering from occupational pain and disability.
Estimating Healthcare Costs
Estimating healthcare costs can be somewhat of a daunting challenge for several reasons. Firstly, there are a comprehensive range of medical services that must be accounted for, including inpatient services and hospitalization, outpatient services, emergency department visits, medications, ergonomic devices and supplies, and any home-based care received. Table 9.1 details some of the more common examples of costs that should ideally be itemized and accounted for in estimating healthcare costs. The second challenge in estimating healthcare costs is that the most detailed records of costs are often not easily available. The most accurate source for what was paid for these services is often the individual payors or the Workers’ Compensation jurisdiction overseeing the reimbursement of healthcare services for the injured worker. However, these datasets may not necessarily be made available to researchers, or it may require a fee for access to these. A third challenge is due to the variability in the costs for a given service. In practice, there is often a chasm between the cost of the service and the charges incurred for the service (or price of the service). Whereas costs in theory should reflect the true resource cost of the service delivered (Finkler, 1982), charges often vary due to various reasons, such as geographic location, rural versus urban settings, the negotiated rates between the healthcare providers and the employer, insurance company, or the Workers’ Compensation authority. This can often distort the true cost of the service.
Table 9.1
Common healthcare costs to be included in cost estimation
Types of healthcare costs |
|---|
1. Inpatient services and hospitalizations |
2. Surgeries |
(a) Surgeon’s fees |
(b) Facilities fees |
(c) Ancillary costs of surgery |
3. Diagnostic procedures |
4. Outpatient services |
(a) Nonsurgical interventional procedures |
(b) Evaluation and management |
(c) Counseling and behavioral services |
(d) Primary care provider visits |
(e) Physical and occupational therapy |
5. Home-based care |
6. Emergency department visits |
7. Ergonomic devices and supplies |
8. Medications |
However, if lacking direct access to healthcare costs data from the insurance carrier or the Workers’ Compensation jurisdiction, there are several alternatives available from Federal databases. A relatively comprehensive source of data is available from the Agency for Healthcare Research and Quality (AHRQ) MEPS, at no cost and open to the public. As described in their website (http://meps.ahrq.gov/mepsweb/index.jsp), the MEPS:
…which began in 1996, is a set of large-scale surveys of families and individuals, their medical providers (doctors, hospitals, pharmacies, etc.), and employers across the United States. MEPS collects data on the specific health services that Americans use, how frequently they use them, the cost of these services, and how they are paid for, as well as data on the cost, scope, and breadth of health insurance held by and available to U.S. workers.
Although the data are aggregate in nature, the MEPS database does provide a breakdown of median and mean costs per person, for various healthcare services as summarized in Table 9.2. To access the MEPS database for healthcare costs, access the link for the Summary Data Tables under the left-hand menu for Data and Statistics. From here, access the Household Component summary tables link (see Fig. 9.6). Then select an appropriate year and the type of summary table desired among the expenditures data (see Fig. 9.7). At the time of writing this chapter, expenditures were available through year 2010. For each of the expenditure tables presented, the total cost for all patients surveyed, as well as the median and mean costs per person, is reported and is further broken down into demographic characteristics such as by sex, age group, ethnicity, type of health insurance, socioeconomic status, region of the country, and baseline health status.
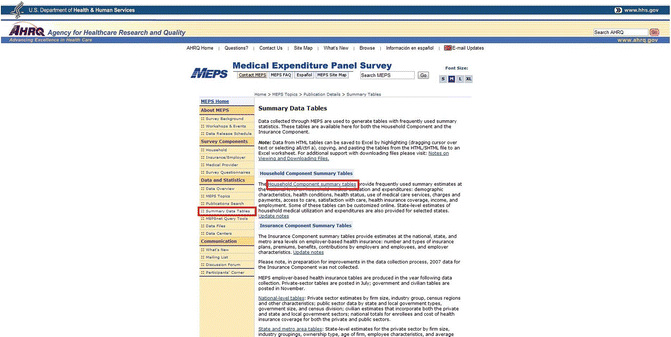
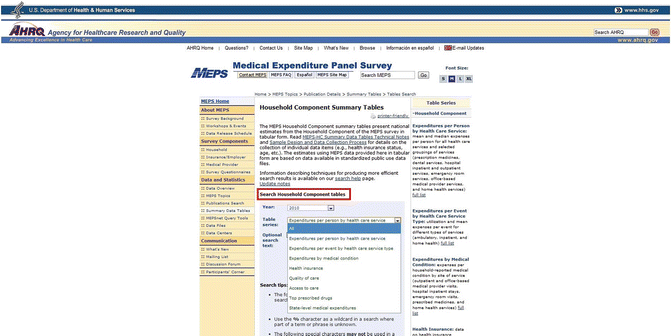
Table 9.2
Available cost data for various healthcare services in the Medical Expenditures Panel Survey (MEPS)
Median and mean costs per person by categories of services |
|---|
1. Total health services |
2. Prescription medicines |
3. Dental services (further delineated by orthodontists and general dental visits) |
4. Medical equipment and services (further delineated by vision aids and other supplies and equipment) |
5. Hospital inpatient services (with and without overnight stays) |
6. Emergency room services |
7. Hospital outpatient services (further delineated by physicians and nonphysicians) |
8. Office-based medical provider services (further delineated by visits to physicians, nonphysicians, chiropractors, nurse or nurse practitioners, optometrists, physicians assistants, physical or occupational therapists) |
9. Home health services (further delineated by agency sponsored visits and paid independent providers) |

Fig. 9.6
Accessing the Medical Expenditure Panel Survey summary data tables

Fig. 9.7
Accessing the Medical Expenditure Panel Survey cost data
Despite the comprehensive nature of the costs available in MEPS, there are at least two notable limitations inherent in the data that readers should be aware of. Firstly, the data are aggregate in nature for each major type of medical service. Therefore, it will not allow the quantification of costs with more granularity [e.g., to compare more expensive surgical procedures (e.g., lumbar fusion surgery) versus relatively less expensive procedures (e.g., lumbar epidural steroid injections)]. Secondly, these cost estimates are surveyed at the population level and reported nationally as well as by State. While it will be valid to use in estimating the healthcare costs related to occupational injuries in general, it will become less accurate when trying to estimate costs incurred by those injured workers who are suffering from chronic pain and disability. As mentioned in the introduction to this chapter, chronic occupational disability usually comprises a very small minority of patients who account for the vast majority of the incurred healthcare costs (Hashemi et al., 1997; Hashemi, Webster, & Clancy, 1998; Hashemi, Webster, & Clancy, et al., 1998). Therefore, use of the MEPS database will inevitably underestimate the true costs associated with chronic cases.
Despite these limitations, the MEPS datasets have been a wealth of resource for researchers investigating the cost and quality of healthcare in the United States (Jimenez, Cook, Bartels, & Alegría, 2013; Sharp & Fendrick, 2013; Shi et al., 2013; St Sauver et al., 2013). To overcome some of the limitations in granularity, there are several other Federal databases that can be accessed. Also from the AHRQ, the Healthcare Cost and Utilization Project (HCUP, http://www.hcup-us.ahrq.gov/) pools data from Federal and State governments, hospital associations, and private organizations and presents these as patient-level and encounter-level data on a broad range of healthcare variables, including cost. Similarly, the Center for Medicare and Medicaid Services also provides access to more granular, patient-level data (http://www.cms.gov/Research-Statistics-Data-and-Systems/Research-Statistics-Data-and-Systems.html). However, access to both these resources requires payment of fees and execution of data use agreements, unlike MEPS which is publicly available for free. Finally, another possibility to overcome the limitation of MEPS is to negotiate access to billing records from payors. This option would be the most desirable, especially when estimating healthcare costs of chronically disabled workers, as database queries can be limited to patients who meet certain criteria for having a certain number of days of temporary total disability (TTD) and days away from work.
Stay updated, free articles. Join our Telegram channel

Full access? Get Clinical Tree


