Fig. 1
Representative image of Ki-67 immunohistochemical staining in mouse early-stage atherosclerotic plaques. apoE-KO mice were fed a high-fat/high-cholesterol diet for 6 weeks. 6 μm-thick histological sections were obtained from the ascending aorta and stained as described in the text. The media of the vascular wall is delineated by discontinuous lines. Ki-67-positive nuclei corresponding to proliferating cells are stained dark brown with DAB
3.2 Combined Immunofluorescent Staining of Ki-67 and the Cell-Type Specific Markers Mac3 (Macrophages) and α-SMA (VSMCs)
2.
Incubation with primary antibodies. Drain the blocking solution from slides. Use a liquid repellent pen to draw a circle around each tissue section. Apply to each section 40 μl of diluted primary antibody solution. Best results are obtained by combining all three primary antibodies in the same solution (1/100 Ki-67, 1/50 α-SMA, 1/300 Mac3 in blocking solution). Incubate for 2 h at 37 °C or overnight at 4 °C.
3.
Wash in PBS, 3 × 5 min.
4.
Incubation with secondary antibodies. Apply to each section 40 μl of diluted secondary antibody solution (containing 1/500 Alexa Fluor® 633-conjugated anti-Rabbit IgG, and 1/500 Alexa Fluor® 488-conjugated anti-Rat IgG in blocking solution) (see Note 10 ). Incubate for 30 min at room temperature.
5.
Wash in PBS, 3 × 5 min.
6.
Nuclei counterstaining. Apply to each section 40 μl of DAPI working solution and incubate for 5 min (see Note 11 ).
7.
Mount slides using mounting medium 2.
8.
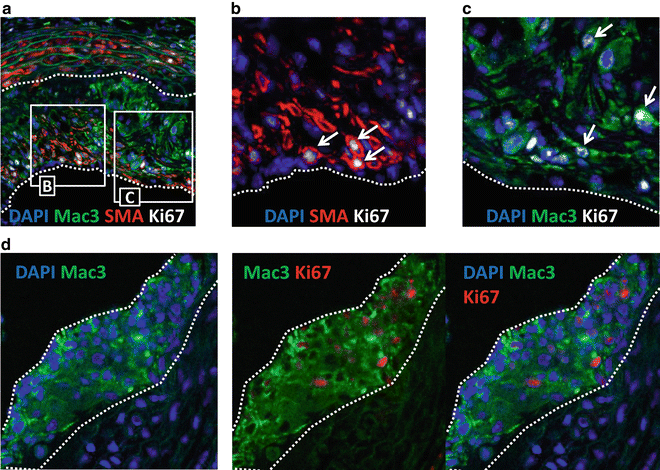
Observation under confocal fluorescence microscope, image acquisition and analysis (see Notes 12 – 15 ). Figure 2 shows representative images of this immunofluorescent staining.


Fig. 2
Representative images of triple immunofluorescent staining of Ki-67 and the cell type-specific markers Mac3 and α-SMA in mouse atherosclerotic plaques. apoE-KO mice were fed a high-fat/high cholesterol diet for 12 weeks (a–c) or 6 weeks (d). 6 μm-thick histological sections were obtained from the ascending aorta and stained as described in the text. Atherosclerotic plaques are delineated by discontinuous lines. (a) Immunofluorescent staining of an advanced atherosclerotic plaque exhibiting Mac3-positive macrophages (green), α-SMA-positive VSMCs (red), Ki-67-positive nuclei (white) and total nuclei stained with DAPI (blue). Squared regions are shown at higher magnification (b, c). Arrows point to Ki-67-positive cells. (d) Immunofluorescent staining of an early lesion (fatty streak) consisting almost exclusively of Mac3-positive macrophages (green). Proliferating macrophages are positive for Ki-67 (red)
4 Notes
1.
Mac3 is one of the most popular murine macrophage markers. However, there are other antibodies specific for macrophage markers that can be used with this same protocol, such as anti-F4/80 (e.g., rat monoclonal, clone Cl:A3-1, Cat. No. MCA497, Serotec MCA497) or anti-CD68 (e.g., rat monoclonal, clone A-11, Cat. No. MCA1957, Serotec).
2.
α-SMA (smooth-muscle specific α-actin isoform) is the best VSMC marker in mouse tissues, but the intensity of its staining varies depending on the differentiation state of the cells. Atherosclerosis progression is known to involve a phenotypic switching of VSMCs, from a contractile to a synthetic phenotype, which is paralleled by a reduction in the expression of α-SMA. Consistently, the intensity of α-SMA staining in atherosclerotic arteries is typically much stronger in medial than intimal VSMCs. While dilutions of this antibody higher than 1/50 will allow the detection of medial VSMCs, they may not stain intimal VSMCs properly.
3.


Given the high cross-reactivity between mouse and rat IgG and the abundance of immunoglobulins in atherosclerotic lesions, it is essential to use secondary antibodies that have been adsorbed against mouse IgG and/or mouse serum.
Stay updated, free articles. Join our Telegram channel

Full access? Get Clinical Tree


