The shape of the femoral head at the time when Perthes disease heals is the most important determinant of the risk for degenerative arthritis; hence, the shape of the femoral head and congruence of the hip are the most useful outcome measures. Although several prognostic factors that predict femoral head deformation may be identified during the course of Perthes disease, only two prognostic factors may be identified early enough to institute preventive intervention: femoral head extrusion and the age at onset of the disease. Femoral head extrusion is the only factor that may be influenced by treatment.
The term “prognosis” is derived from the Greek word prognostikos , which means “of knowledge beforehand.” It is worthwhile keeping this interpretation of the term in mind while considering various factors that influence the prognosis in Perthes disease.
As in the case of any disease, the importance of identifying reliable prognostic factors in Perthes disease is to enable the clinician to institute appropriate intervention to minimize the risk of an unsatisfactory outcome. Thus, the value of a particular prognostic indicator depends on 3 factors:
- 1.
Can the prognostic factor be reproducibly and consistently identified?
- 2.
Does the prognostic factor reliably predict a potentially adverse outcome?
- 3.
Can the prognostic factor be recognized sufficiently early in the course of the disease for any intervention to be effective in preventing the adverse outcome?
In the ensuing discussion an attempt is made to evaluate various prognostic factors in the light of these 3 characteristics.
Outcomes in Perthes disease
A large proportion of children who develop Perthes disease will end up with normal or near-normal hips that function well throughout their lives; this would be an optimal outcome. However, some children will go on to develop secondary degenerative arthritis in adult life. Thus, the poor outcome of Perthes disease is development of secondary degenerative arthritis of the hip in early or mid adult life, and treatment in childhood is aimed at preventing this.
Although the final outcome should be assessed in adult life, the interim outcome of Perthes disease may be assessed at two points in childhood and adolescence; the first is when the disease heals and the second is at skeletal maturity. A suboptimal outcome at either of these two points will have a direct bearing on the third and final outcome in adult life.
First Level of Outcome
Suboptimal outcomes at healing
- 1.
The femoral head may lose it spherical shape and become
- a.
Ovoid ( Fig. 1 A)
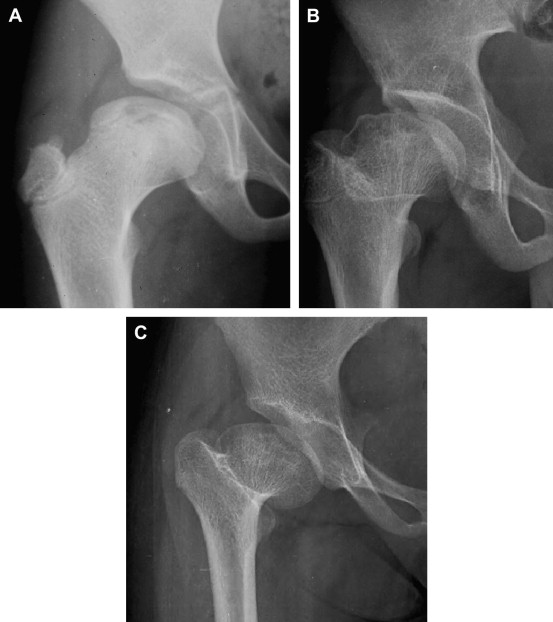
Fig. 1
Examples of suboptimal outcomes at healing. The femoral head has become ovoid ( A ), irregular ( B ), or enlarged ( C ) in these hips when the disease has healed.
- b.
Frankly irregular in contour ( Fig. 1 B)
- a.
- 2.
The femoral head may become enlarged
- a.
The acetabulum may also enlarge proportionately to cover the femoral head
- b.
The femoral head may be too large to be covered by the acetabulum ( Fig. 1 C)
- a.
- 3.
The femoral head and the acetabulum may no longer be congruous.
Second Level of Outcome
Suboptimal outcome at skeletal maturity
- 1.
The femoral neck may be foreshortened on account of growth inhibition of the capital femoral growth plate with associated “overgrowth” of the greater trochanter ( Fig. 2 ). Although there may be a suggestion of this when the disease heals, the full extent of the growth abnormality will not be evident until complete cessation of skeletal growth has taken place.
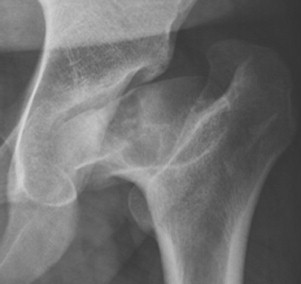
Fig. 2
Appearance of the hip of a patient with healed Perthes disease at skeletal maturity showing suboptimal outcomes. The femoral head is not spherical, its contour is irregular, and the femoral neck is short. The full extent of trochanteric “overgrowth” is evident now.
- 2.
Any of the 3 suboptimal outcomes if noted at healing will be evident at skeletal maturity (see Fig. 2 ), though some minor change may have occurred between healing and skeletal maturity as a consequence of remodeling.
Third Level of Outcome: Long-Term Outcome
Suboptimal outcome in adult life
Degenerative arthritis of the hip
All of the suboptimal outcomes noted at skeletal maturity will be evident in the adult. However, they are inconsequential if the patient has no symptoms or if there is no evidence of arthritis.
The outcomes at healing, skeletal maturity, and in the adult may be termed the short-term outcome, the intermediate-term outcome, and the long-term outcome, respectively.
Outcome measures
Short-Term Outcome (At Healing)
Assessment of the shape of the femoral head
The most widely used method of assessment of sphericity of the femoral head is that described by Mose and colleagues. Mose used a transparent template of concentric circles 2 mm apart to place over the radiograph so as to overlay the femoral head ( Fig. 3 A).
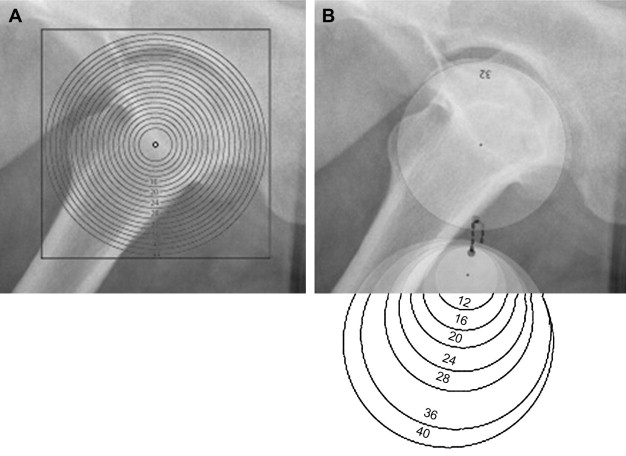
The head is considered to be spherical when the articular margin of the femoral head perfectly matches the arc of a circle of the same radius on both the anteroposterior and lateral radiographs. The head is regarded as ovoid if the femoral articular margin fits the arc of a circle perfectly in both views but the radius of the femoral head differs on the anteroposterior and lateral views by 2 mm or less. The head is regarded as being flattened or irregular if the articular margin of the femoral head does not conform to the arc of a circle in either view, or if the articular surface conforms to the arcs of circles in both views, but the radius of the femoral head differs in the two views by more than 2 mm.
Practical problems that have been reported with the use of the Mose template are difficulty in visualizing the margin of the femoral head through the template and identifying with certainty the circle that matches the articular margins in the anteroposterior and lateral radiographs. Because the circles are so close together (2 mm), parallax errors may also occur. Herring and colleagues suggested a method using a compass and a protractor to locate the center of the femoral head and then marking the best-fit circle to match the radius of the femoral head. Edgren used a series of transparent plastic circles of various sizes instead of a single template. The author has been using a similar set of translucent plastic disks of varying diameters (see Fig. 3 B) for several years. The disk that best fits the contour of the femoral head is selected, as shown in Fig. 3 . This method is a lot easier than using the original Mose template and the method described by Herring.
The contour of the femoral head can also be assessed by digitizing the tracings of radiographs and matching them to a best-fit circle with the help of a computer. With more centers using Picture Archiving and Communication Systems (PACS) and viewing radiographs on computer screens, the template itself may be used less frequently, but exactly the same measurements can easily be made with software programs designed for radiographic measurements.
Assessment of the size of the femoral head
The Mose template, translucent disks as described earlier, or software programs may be used to accurately measure the radius of the femoral head. The radius of the femoral head of the affected side is compared with that of the unaffected hip to estimate the degree of enlargement of the head in unilateral cases. Accurate estimates of the size of the femoral head may be impossible if the femoral head is grossly deformed, as in Fig. 2 .
Assessment of femoral head coverage by the acetabulum
The center-edge (CE) angle of Wiberg and the acetabular-head index (AHI) are methods for estimating the extent to which the acetabulum covers the femoral head. The Reimer migration index, on the other hand, measures the extent of the femoral head that is uncovered ( Fig. 4 ).
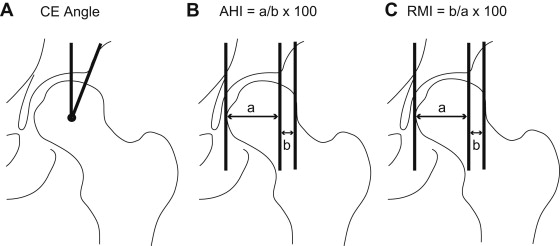
If the femoral head is distorted it may be difficult or impossible to accurately locate the center of the femoral head, and in such instances the CE angle cannot be reliably estimated; the AHI and the migration index are not influenced by the shape of the femoral head. The author prefers to use the Reimer migration index, as it is included in commercially available software programs for making measurements on hip radiographs.
Assessment of the femoral head shape and congruency of the hip
In 1981 Stulberg and colleagues suggested a classification that has since been widely used to describe the outcome of Perthes disease. The affected hip can be classified into 1 of 5 classes (Class I to Class V) from plain radiographs in this system at healing, at skeletal maturity, or in the adult. The classification system takes into consideration the shape and size of the femoral head and neck, the shape of the acetabulum, and the congruence of the femoral head and the acetabulum. Class I hips are essentially normal while all other Classes show varying degrees of abnormality ( Table 1 ).
| Class | Femoral Head Shape | Femoral Head Size, Femoral Neck Length, and Configuration of the Acetabulum | Congruency |
|---|---|---|---|
| Class I | Spherical | Normal size of femoral head, neck, and acetabulum | Congruous (spherical congruency) |
| Class II | Spherical | Coxa magna, coxa brevis, or acetabular dysplasia present | Congruous (spherical congruency) |
| Class III | Ovoid | Coxa magna, coxa brevis, or acetabular dysplasia present | Congruous (aspherical congruency) |
| Class IV | Flat (irregular) | Coxa magna, coxa brevis, or acetabular dysplasia present | Congruous (aspherical congruency) |
| Class V | Flat (irregular) | Mild or no coxa magna, no coxa brevis, normal-shaped acetabulum, and no acetabular dysplasia | Incongruous (aspherical incongruency) |
Although the classification system was described in 1981 its reproducibility was only assessed 18 years later by Neyt and colleagues, who suggested that the reproducibility of the classification system is not very good. Herring and colleagues more recently suggested some modifications in the classification system to improve the reproducibility; in particular, they recommended actually drawing the best-fit circle to assess the shape of the femoral head. Herring and colleagues noted excellent reproducibility of the Stulberg classification with these modifications, with weighted kappa values of 0.82 ; an identical kappa value was reported by Shah and colleagues, who also used templates to measure the sphericity of the femoral head while applying the Stulberg classification.
Wiig and colleagues combined Stulberg Classes I and II into one group and similarly combined Stulberg Classes IV and V. These investigators reported satisfactory reproducibility of the 3-group Stulberg classification, with a kappa value of 0.70.
One of the limitations of the Stulberg classification is that it is a discrete ordinal scale, and if this outcome measure is used in long-term prospective studies the sample size has to be a great deal larger than when an outcome measure with a continuous scale is used. For this reason the deformity index, a continuous measure proposed by Nelson and colleagues, is an attractive option. Nelson and colleagues demonstrated that the reproducibility of estimation of this index that measures changes in the epiphyseal height and width is excellent.
Intermediate-Term Outcome (at Skeletal Maturity)
Assessment of the shape and size of the femoral head, and the extent of femoral head coverage
These variables can be assessed as done at healing.
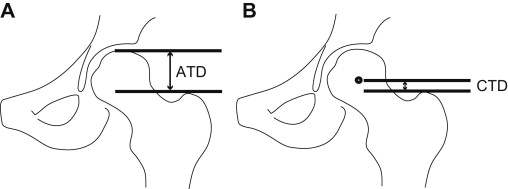
Assessment of the level of the trochanter in relation to the femoral head
The articulo-trochanteric distance initially described by Edgren and the center-trochanteric distance ( Fig. 5 ) measured on anteroposterior radiographs of the pelvis assess the extent of greater trochanteric “overgrowth” that has occurred on account of growth inhibition of the femoral capital physis. The latter measurement cannot be used if the femoral head is distorted, as the center of the femoral head cannot be accurately located.
Assessment of limb length
Clinical or radiographic measurement of the limb lengths will help to quantify limb length inequality.
Clinical assessment of hip function
Any of the standard scoring systems that evaluate hip function may be employed.
In Adult Life
In addition to all the assessments performed at skeletal maturity, radiological evaluation to identify signs of arthritic change is essential.
Outcome measures
Short-Term Outcome (At Healing)
Assessment of the shape of the femoral head
The most widely used method of assessment of sphericity of the femoral head is that described by Mose and colleagues. Mose used a transparent template of concentric circles 2 mm apart to place over the radiograph so as to overlay the femoral head ( Fig. 3 A).

The head is considered to be spherical when the articular margin of the femoral head perfectly matches the arc of a circle of the same radius on both the anteroposterior and lateral radiographs. The head is regarded as ovoid if the femoral articular margin fits the arc of a circle perfectly in both views but the radius of the femoral head differs on the anteroposterior and lateral views by 2 mm or less. The head is regarded as being flattened or irregular if the articular margin of the femoral head does not conform to the arc of a circle in either view, or if the articular surface conforms to the arcs of circles in both views, but the radius of the femoral head differs in the two views by more than 2 mm.
Practical problems that have been reported with the use of the Mose template are difficulty in visualizing the margin of the femoral head through the template and identifying with certainty the circle that matches the articular margins in the anteroposterior and lateral radiographs. Because the circles are so close together (2 mm), parallax errors may also occur. Herring and colleagues suggested a method using a compass and a protractor to locate the center of the femoral head and then marking the best-fit circle to match the radius of the femoral head. Edgren used a series of transparent plastic circles of various sizes instead of a single template. The author has been using a similar set of translucent plastic disks of varying diameters (see Fig. 3 B) for several years. The disk that best fits the contour of the femoral head is selected, as shown in Fig. 3 . This method is a lot easier than using the original Mose template and the method described by Herring.
The contour of the femoral head can also be assessed by digitizing the tracings of radiographs and matching them to a best-fit circle with the help of a computer. With more centers using Picture Archiving and Communication Systems (PACS) and viewing radiographs on computer screens, the template itself may be used less frequently, but exactly the same measurements can easily be made with software programs designed for radiographic measurements.
Assessment of the size of the femoral head
The Mose template, translucent disks as described earlier, or software programs may be used to accurately measure the radius of the femoral head. The radius of the femoral head of the affected side is compared with that of the unaffected hip to estimate the degree of enlargement of the head in unilateral cases. Accurate estimates of the size of the femoral head may be impossible if the femoral head is grossly deformed, as in Fig. 2 .
Assessment of femoral head coverage by the acetabulum
The center-edge (CE) angle of Wiberg and the acetabular-head index (AHI) are methods for estimating the extent to which the acetabulum covers the femoral head. The Reimer migration index, on the other hand, measures the extent of the femoral head that is uncovered ( Fig. 4 ).
If the femoral head is distorted it may be difficult or impossible to accurately locate the center of the femoral head, and in such instances the CE angle cannot be reliably estimated; the AHI and the migration index are not influenced by the shape of the femoral head. The author prefers to use the Reimer migration index, as it is included in commercially available software programs for making measurements on hip radiographs.
Assessment of the femoral head shape and congruency of the hip
In 1981 Stulberg and colleagues suggested a classification that has since been widely used to describe the outcome of Perthes disease. The affected hip can be classified into 1 of 5 classes (Class I to Class V) from plain radiographs in this system at healing, at skeletal maturity, or in the adult. The classification system takes into consideration the shape and size of the femoral head and neck, the shape of the acetabulum, and the congruence of the femoral head and the acetabulum. Class I hips are essentially normal while all other Classes show varying degrees of abnormality ( Table 1 ).
Related posts:
 The Epidemiology and Etiology of Perthes Disease
 Articulated Distraction
 Review of Total Hip Resurfacing and Total Hip Arthroplasty in Young Patients Who Had Legg-Calvé-Perthes Disease
 Prognostic Factors and Outcome Measures in Perthes Disease
Articulated Distraction
Consensus Statements on the Management of Perthes Disease
Prognostic Factors and Outcome Measures in Perthes Disease
Articulated Distraction
Consensus Statements on the Management of Perthes Disease
Stay updated, free articles. Join our Telegram channel

Full access? Get Clinical Tree


