Fig. 13.1
A positron and electron within close proximity within the atom of Fluroine-18 labeled deoxyglucose (18FDG) interact and are “annihilated,” resulting in the production of two gamma rays (photons), β+ and β–
Positron and electron masses are then converted into energy as two gamma rays (photons) traveling in nearly opposite (usually at almost 180°) directions to one another.
PET scanners detect pairs of gamma rays resulting from annihilation (Fig. 13.2):
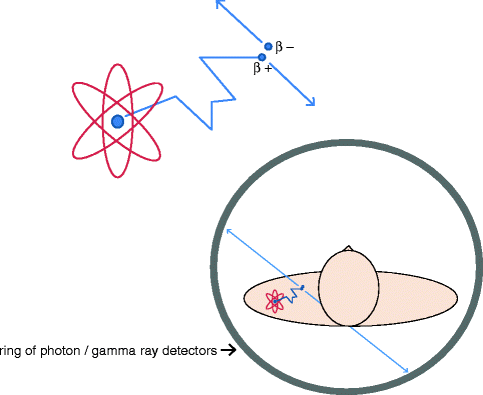
Fig. 13.2
PET scanners detect pairs of gamma rays resulting from annihilation and determine from where these two gamma rays/photons originated. This process is termed “co-incidence” detection in which pairs of photons which strike photon detectors located on a ring of detectors surrounding the patient
Determine from where these two gamma rays/photons originated
“co-incidence” detection (detects pairs of photons which strike photon detectors located on a ring of detectors surrounding the patient)
assumes that if two gamma rays/photons strike a photon detector (on ring of detectors surrounding the patient) at nearly the same time, and at approximately 180° to one another, that they have originated from the same source (annihilation) and are “co-incidental” to one another.
Produce an image showing the location in the body where the positrons have annihilated.
The vast majority of new PET scanners marketed and sold today consist of a combined, integrated, computed tomography (CT) scanner. The two scanners are physically located in the same gantry, but do not perform scans simultaneously:
Rapid spiral CT scan is usually first acquired, followed by the more slowly acquired PET scan.
PET is able to measure the metabolic activity of various tissues when utilizing a positron emitting isotope such as 18FDG:
18FDG is a non-specific radiotracer which preferentially accumulates in sites of infection and inflammation, and it accumulates in areas of high metabolic activity.
18FDG is taken up by inflammatory cells, predominantly macrophages, such as those found in atherosclerotic plaques.
Research has demonstrated that there is no measurable 18FDG uptake into the walls of normal vessels [4].
It is important to note that, although virtually all plaques contain some macrophages, not all plaques appear to take up 18FDG (Figs. 13.3, 13.4, and 13.5):
Get Clinical Tree app for offline access

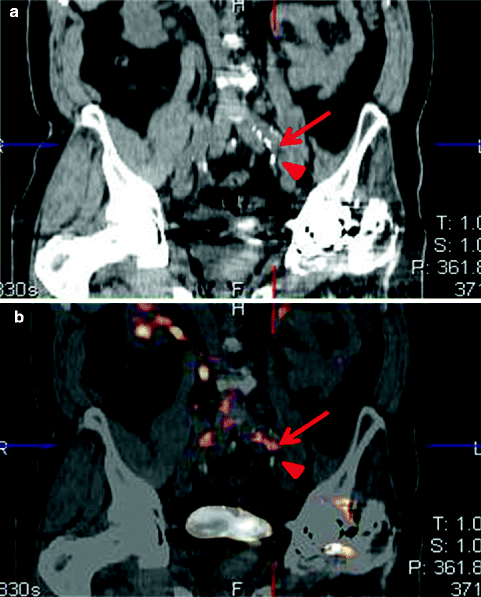
Fig. 13.3
CT image (a) and corresponding PET/CT image (b) demonstrating calcifications of the left common iliac artery. Solid arrow indentifies region of calcification (a) with corresponding 18FDG uptake (b) consistent with actively inflamed atherosclerotic lesion. Arrow head identifies region of calcification (a) without significant FDG uptake (b) in a non-inflamed calcific atherosclerotic lesion (Courtesy of Sun Y. Kim, M.D., Walter Reed Army Medical Center, Departments of Radiology and Nuclear Medicine)
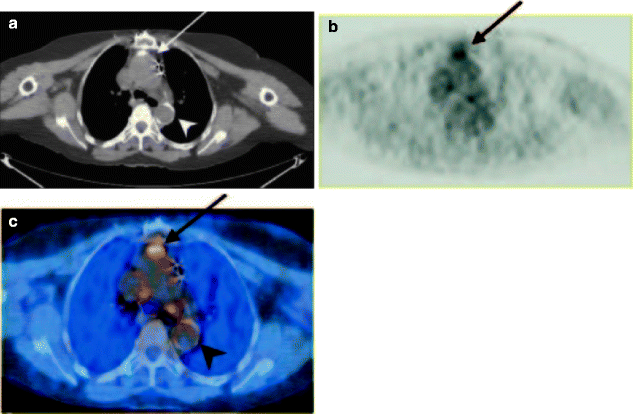
Fig. 13.4
(a–c) A 71-year-old woman with a history of breast carcinoma and colon cancer and a medical history of hypertension. CT (a), 18F-FDG PET (b), and fused PET/CT (c) images show CT calcifications in wall of thoracic aorta with (arrow) and without (arrowhead) focal 18F-FDG uptake (Reproduced with permission from Ben-Haim et al. [10])
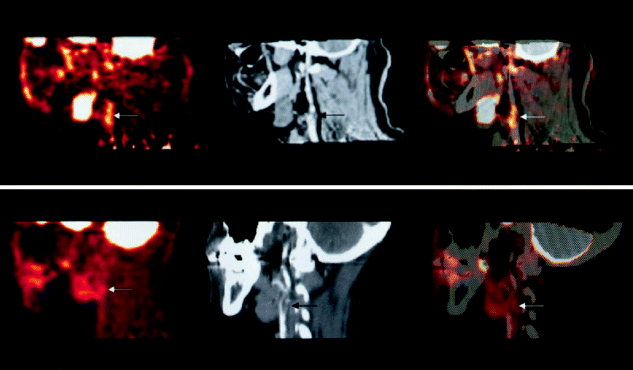
Fig. 13.5
The upper row (from left to right) shows PET, contrast CT, and co-registered PET/CT images in the sagittal plane from a 63-year-old man who had experienced two episodes of left-sided hemiparesis. Angiography demonstrated stenosis of the proximal right internal carotid artery; this was confirmed on the CT image (black arrow). The white arrows show 18FDG uptake at the level of the plaque in the carotid artery. As expected, there was high 18FDG uptake in the brain, jaw muscles, and facial soft tissues. The lower row (from left to right) demonstrates a low level of 18FDG uptake in an asymptomatic carotid stenosis. The black arrow highlights the stenosis on the CT angiogram, and the white arrows demonstrate minimal 18FDG accumulation at this site on the 18FDGPET and co-registered PET/CT images (Reproduced with permission from Rudd et al. [4])
Experimental models of atherosclerosis indicate that 18FDG uptake is directly proportional to plaque macrophage content [5] (Fig. 13.6).
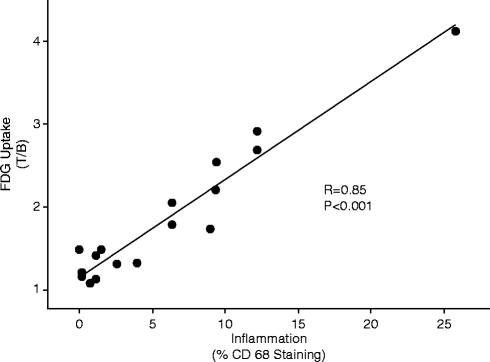
Fig. 13.6
Mean within-patient 18F-fluorodeoxyglucose (FDG) uptake versus inflammation in carotid endarterectomy patients. For each of the 17 subjects, all histologic sections were averaged to generate a mean per-patient value for percentage macrophage staining. Likewise, the corresponding imaging data were combined to generate a mean target-to-background ratio (T/B) for each patient. There was a significant correlation between mean T/B and mean inflammation (r = 0.85; p < 0.001). The correlation remained significant (r = 0.82; p < 0.001) even after the outlier with the highest plaque inflammation was removed from the analysis (Reproduced with permission of Elsevier from Tawakol et al. [6])Related posts:
 Insights into the Natural History of Atherosclerosis Progression
 Factors Contributing to the Development of Atherosclerosis
 Atherosclerosis: Clinical Perspectives Through Imaging Carotid Intima-Media Thickness
 Intravascular Ultrasound
 Noncontrast Cardiac CT for the Detection of Calcified Atherosclerosis
 Coronary Atherosclerosis Imaging by Coronary CT Angiography

Stay updated, free articles. Join our Telegram channel

Full access? Get Clinical Tree

