Fig. 22.1
Superior aspect of the adult (left) and newborn (right) skull. Various bones and sutures are indicated (Adapted from Williams [1])
Unlike the mature adult human cranial bone, which consists of two layers of rigid cortical bone (inner and outer tables) housing the relatively deformable cancellous (diploe) layer, in the newborn the cranial bone is primarily cortical, with no diploe component. Around 3–6 months of age, the structure gradually transforms into the sandwich composition of the adult skull. At birth, the calvarial bones are thin and ossification does not extend into the suture lines of the skull. The frontal bone is divided along the midline by the metopic suture and outlined posteriorly by the coronal suture. The parietal bones are two symmetric plates covering the lateral aspect of the skull. They are separated by the sagittal suture in the midline. Anteriorly, they are abutted by the coronal suture, posteriorly by the lambdoidal suture, and inferiorly but the squamosal suture. The occipital bone, or more specifically the squamous portion of the occipital bone, is formed by the lambdoidal suture that traverses symmetrically from the lambdoid and merges into the posteriolateral fontanelle. With age, the sutures continue to diminish in size, but closure occurs at different intervals. The metopic suture closes during the sixth to eighth year of life. Complete fusion of the bony plates with obliteration of the sutures occurs around 20 years of age when the skull has reaches is full definitive size.
The soft spots or fontanelles of a newborn head are large patches of fibrous tissue located between the boney plates of the skull [1–5]. Fontanelles can be compared to the synchondrosis of the cervical spine (Fig. 22.2). They are not fused in the newborn. There are six major fontanelles with variable smaller or accessory fontanelles usually located along the sagittal suture. The six fontanelles are the anterior, posterior, and the paired anterolateral and posteriolateral fontanelles. The anterior fontanelle is located along the bregma of the intersection of the coronal, sagittal, and metopic sutures. This fontanelle is the largest at birth with an average diameter of 25 mm. The posterior fontanelle is located along the lambda, which is the intersection of the sagittal and lambdoidal sutures. The anterolateral fontanelles are located along the pterion, which is the intersection of the coronal and squamosal sutures. Closure of the fontanelles occurs at various times. The posterior and anterolateral fontanelles close within 2–3 months after birth, and the posteriolateral fontanelle closes approximately at 1 year. In contrast, the anterior fontanelle closes at around 18–24 months of age.
22.1.1.2 Brain
In utero, a specialized region of cells forms the neural plate from which the structures of the nervous system are formed by cellular division. As the cells along the outer most edge proliferate more rapidly, the neural groove is created. This process continues with the margins growing up and around to form the neural tube, with closure initially at the area of the neck, and proceeding in the rostral and caudal directions. The various components of the central nervous system develop from the neural tube. Once closed, the neural tube represents all components of the nervous system with the rostral portion forming the cerebral hemispheres and brainstem, and the caudal portion forming the spinal cord. These events form the basic blueprint of the human nervous system from which growth in utero will proceed until birth.
Post-natal, the brain water content decreases and there is general increase in the volume the brain. By age 2, the brain has reached nearly 80 % of its adult volume and by age 5 the brain is adult-size. From age 4 to 20 brain white matter volume increases linearly, but these increases are spatially inhomogeneous with white matter increases in the dorsal prefrontal cortex, but not in the ventral prefrontal regions during this time period. Cortical gray matter volume increases non-linearly to maximum at age 12 and then decreases to age 20 [1, 6–8].
22.1.2 Biomechanical Studies
22.1.2.1 Skull Material Properties
While studies describing the mechanical properties of the adult human cranial bone under compression, tension, bending and shear are available, a paucity of such information exists for the developing pediatric population [9–12]. Specific to the growing population, in an early study, cranial bone specimens from two full-term newborns (gestation age 40 weeks) and one 6-year-old human cadaver were tested using three-point bending technique at a quasi-static rate of 0.5 mm/min [13–15]. In the two newborn specimens, frontal and parietal bone samples were tested. In the 6-year-old specimen, parietal bone samples were used. Tests were conducted along an axis parallel and perpendicular to the long axis of the specimen. Data from the 6-year-old parietal specimen indicated differences in the modulus between the parallel (7.38 ± 0.84 GPa) and perpendicular (5.86 ± 0.69 GPa) orientations. Significant differences in the elastic modulus were also found between parallel (3.88 ± 0.78 GPa) and perpendicular (0.951 ± 0.572 GPa) fiber orientation for the newborn (Fig. 22.3). In addition to these data, tests were conducted on four fetal cadavers with gestational age ranging from 25 to 40 weeks (Table 22.1). Significant differences in the elastic modulus were found between parallel (1.65 ± 1.17 GPa) and perpendicular (0.145 ± 0.062 GPa) orientations.
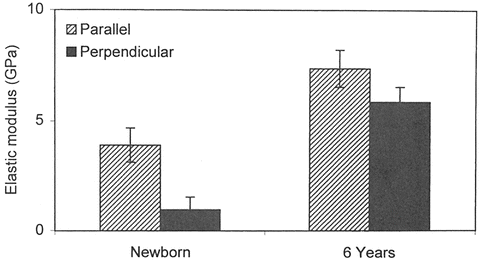

Fig. 22.3
Comparison of the elastic modulus between the newborn and 6-year-old human cadavers in three-point bending under parallel and perpendicular orientations (Adapted from McPherson and Kriewall [15])
Table 22.1
Elastic modulus from three-point bending tests on six human cadavers (Adapted from McPherson and Kriewall [15])
Elastic modulus (GPa) | ||||||||
|---|---|---|---|---|---|---|---|---|
Parallel orientation | Perpendicular orientation | |||||||
Gestational age (weeks) | Parietal bone | n | Frontal bone | n | Parietal bone | n | Frontal bone | n |
25 ± 2 | 1.30 ± 0.6 | 8 | – | 0.12 ± 0.01 | 8 | |||
27 ± 2 | 0.94 ± 0.41 | 10 | – | 0.18 ± 0.03 | 3 | |||
28 ± 2 | 3.62 ± 0.46 | 5 | – | 0.14 ± 0.08 | 5 | |||
38 ± 2 | 4.24 ± 0.73 | 9 | – | 0.84 ± 0.19 | 8 | |||
40 ± 2 | 4.01 ± 1.28 | 3 | 3.05 ± 0.88 | 2 | 1.74 ± 0.59 | 3 | 1.70 ± 0.79 | 2 |
40 ± 2 | 3.51 ± 0.50 | 10 | 3.06 ± 0.84 | 10 | 0.57 ± 0.14 | 5 | ||
In a later study, cranial bone specimens from 10 human cadavers with age ranging from 20 to 42 gestational weeks were tested using three-point bending techniques at a loading rate of 0.0083 mm/s [14]. The bending stiffness ranged from 1.4 to 25.1 N/mm. The elastic modulus for the perpendicular orientation (1.044–1.996 GPa) was lower than the modulus for the parallel orientation (3.02–7.46 GPa). These data, on a specimen-by-specimen basis, are included in Table 22.2.
Table 22.2
Biomechanical properties of human fetal parietal bone under three-point bending at loading rate of 0.0083 mm/s. Data obtained from 10 cadavers (Adapted from Kriewall [14])
Elastic modulus (MPa) | |||
|---|---|---|---|
Gestational age (weeks) | Stiffness (N/mm) | Parallel orientation | Perpendicular orientation |
20 | 4.1 | 4,232 | 1,238 |
30 | 3.3 | 3,478 | 1,044 |
30 | 1.4 | 3,634 | 1,626 |
33 | 2.3 | 3,029 | 1,996 |
34 | 4.7 | 3,390 | 1,646 |
39 | 17.5 | 4,301 | – |
40/newborn | 25.1 | 5,167 | 1,434 |
40/newborn | 20.4 | 2,961 | – |
40/newborn | 6.8 | 3,594 | 1,684 |
2-week-old | 14.1 | 7,360 | – |
Margulies and Thibault obtained human infant cranial bone specimens from four cadavers [16]. Subjects ranged in age from 25 weeks gestation to 6 months of age. From each cadaver, bilateral strips of parietal bone adjacent to the sagittal suture were excised. All strips were cut parallel to sagittal suture. For each test specimen, the rupture modulus (σrupt), elastic modulus (E), and energy per unit volume absorbed to failure (Uo) were calculated from the measured force and centerline deflection data. Tests were conducted at slow (0.042 mm/s) and fast (42.33 mm/s) rates. These data are included in Table 22.3.
Table 22.3
Mechanical properties of human infant parietal bone in three-point bending (Adapted from Margulies and Thibault [16])
Cadaver | Age | Sample | Side | Rate (mm/s) | σRupt (MPa) | E (MPa) | Uo (N∙mm/mm3) |
|---|---|---|---|---|---|---|---|
1 | 25 weeks gest. | 1 | Left | 0.042 | 4.5 | 71.6 | 0.0312 |
2 | Left | 42.33 | 4.0 | 43.8 | |||
2 | 30 week gest. | 1 | Left | 0.042 | 3.1 | 95.3 | |
2 | Right | 42.33 | 11.2 | 444.5 | 0.0624 | ||
3 | Right | 0.042 | 14.9 | 618.8 | |||
4 | Right | 42.33 | 8.9 | 407.7 | 0.0575 | ||
5 | Right | 42.33 | 17.0 | 455.4 | 0.0675 | ||
3 | 1 week term | 1 | Left | 42.33 | 10.6 | 820.9 | 0.0607 |
4 | 6 months term | 1 | Left | 0.042 | 42.1 | 2,111.7 | 0.1392 |
2 | Right | 0.042 | 44.6 | 2,199.4 | 0.1834 | ||
3 | Left | 42.33 | 2,671.9 | ||||
4 | Right | 42.33 | 71.7 | 3,582.2 | 0.4361 |
Coats and Margulies tested human infant cranial bone in three point bending at high rates similar to those experienced in a fall [17]. Human pediatric cranial bone and suture were collected at autopsy (46 specimens from 21 infant calveria). Two cranial specimens were removed and frozen from each subject: one occipital bone and one parietal parasagittal sample. A drop test apparatus was designed and validated to test samples in three-point bending and tension at high rates. Bending modulus, ultimate stress, and ultimate strain were calculated (Table 22.4). The authors emphasized that the ultimate strain reported should be considered an underestimation of the actual strain of the material. The authors conducted a three-way ANOVA of specimen location, donor age, and strain rate and found a significant influence of both location (parietal/occipital) and donor age on bending modulus and ultimate stress. Parietal bone ultimate stress and modulus were larger than occipital bone. Ultimate stress and modulus increased with the age of the donor. Ultimate stress was significantly affected by the three-way interaction between donor age, location, and strain rate. Ultimate strain was the only parameter that was sensitive to strain rate, and it increased with strain rate.
Table 22.4
High rate three point bending data for infant cranial bone (Adapted from Coats and Margulies [17])
Cranium | Age | Region | Bending modulus (MPa) | Ultimate stress (MPa) | Ultimate strain (mm/mm) |
|---|---|---|---|---|---|
1 | 21 weeks gest | Occipital | 181.1 | 12.5 | 0.0627 |
2 | 21 weeks gest | Occipital | 45.3 | 8.8 | 0.0071 |
3 | 21 weeks gest | Occipital | 89.4 | 9.8 | 0.0027 |
Occipital | 132.9 | 12.3 | 0.002 | ||
Parietal | 50.2 | 5.5 | 0.0037 | ||
Parietal | 120.1 | 5.6 | 0.0089 | ||
4 | 32 weeks gest | Occipital | 58.7 | 3.3 | 0.0416 |
5 | 34 weeks gest | Parietal | 552.9 | 81.1 | 0.0045 |
6 | 35 weeks gest | Parietal | 97 | 7 | 0.0026 |
7 | 38 weeks gest | Occipital | 290 | 12.6 | 0.0467 |
Occipital | 448.1 | 31.4 | 0.0735 | ||
8 | 39 weeks gest | Occipital | 211.1 | 6.7 | 0.0501 |
Occipital | 229.3 | 7.4 | 0.0346 | ||
Parietal | 253.9 | 7.6 | 0.0264 | ||
Parietal | 933.1 | 31.8 | 0.0431 | ||
10 | 19 days old | Parietal | 336.8 | 37.8 | 0.149 |
12 | 21 days old | Occipital | 550.7 | 5.8 | 0.0125 |
Occipital | 516.2 | 4.6 | 0.0068 | ||
Parietal | 182.7 | 8.4 | 0.045 | ||
13 | 1 month old | Occipital | 449.2 | 18.5 | 0.0465 |
Parietal | 815.5 | 53.7 | 0.0753 | ||
14 | 1.5 months old | Occipital | 28.6 | 8.7 | 0.0068 |
Occipital | 57.7 | 13.5 | 0.0039 | ||
15 | 1.5 months old | Parietal | 372.4 | 19.7 | 0.07 |
Parietal | 518.2 | 29.6 | 0.0533 | ||
Parietal | 581.3 | 25.6 | 0.0639 | ||
16 | 1 months, 23 days old | Occipital | 421.4 | 15.1 | 0.0314 |
17 | 2 months old | Parietal | 297.4 | 14.2 | 0.0515 |
Parietal | 522.4 | 27.1 | 0.0765 | ||
18 | 2 months, 9 days old | Occipital | 186.4 | 3.1 | 0.0259 |
Occipital | 186.1 | 5.7 | 0.0268 | ||
19 | 3 months old | Occipital | 1,317.6 | 43.4 | 0.0254 |
Occipital | 463.5 | 26.1 | 0.0456 | ||
Parietal | 1,155.2 | 69.7 | 0.0807 | ||
20 | 4.5 months old | Occipital | 317.7 | 16.4 | 0.0542 |
Occipital | 392.8 | 19.5 | 0.0538 | ||
Parietal | 552.4 | 23.7 | 0.05 | ||
21 | 11 months old | Occipital | 602.9 | 37.6 | 0.003 |
Occipital | 322.1 | 17.3 | 0.0031 | ||
Parietal | 783.8 | 52.1 | 0.0032 | ||
Parietal | 573 | 48.8 | 0.0034 | ||
22 | 12 months old | Occipital | 104.2 | 6.2 | 0.0538 |
Occipital | 621.8 | 21.2 | 0.1613 | ||
Parietal | 200.8 | 19.3 | 0.1217 | ||
Parietal | 566.5 | 51.5 | 0.0936 | ||
23 | 13 months old | Parietal | 216.8 | 15.1 | 0.0885 |
Davis et al. harvested the calvarium from a 6 year old cadaver, and conducted 4 point bending experiments on 47 samples [18]. Samples were classified by morphology as either “cortical only” (n = 7), “sandwiched” defined as layered cortical and trabecular (n = 17), “transitional” defined as between cortical and sandwiched (n = 5), and “across closed suture” (n = 18). All suture specimens failed at the suture. Cortical-only specimens (1.88 ± 0.16 mm) were significantly thinner than sandwich structure specimens (3.38 ± 0.45 mm) or suture specimens (3.60 ± 0.71 mm), but sandwich and suture specimens were not significantly different from one another. Average strain rates spanned two orders of magnitude (0.045, 0.44, and 2.2 s−1) but did not affect modulus, ultimate strain or ultimate stress. The effective modulus of elasticity of cortical (9.87 ± 1.24 GPa), sandwich (3.69 ± 0.92 GPa), and suture (1.10 ± 0.53 GPa) specimens were all different from one another. Cortical specimens had the highest ultimate strength (184.49 ± 25.19 MPa), followed by sandwich specimens, (82.87 ± 22.00 MPa), followed by the suture specimens (27.18 ± 9.23 MPa). Ultimate strain was not dependent on morphology. Plots of ultimate stress (Fig. 22.4) and elastic modulus (Fig. 22.5) versus specimen thickness are provided. Despite large differences in the elastic modulus or the ultimate stress between specimens of differing morphology, the authors noted that the bending stiffness was uniform between cortical and suture specimen morphologies. This suggests that the skull utilizes thickness and structure as compensatory mechanisms for the relative weakness and lower elastic modulus of the sutures at this age.
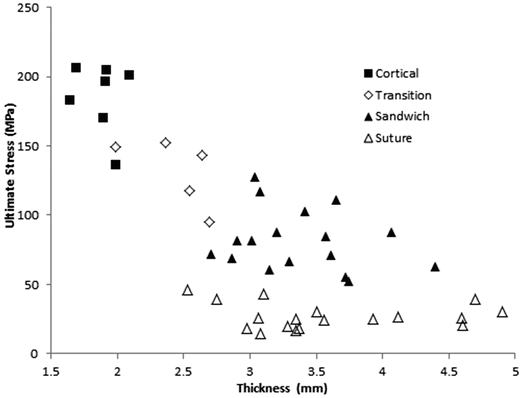
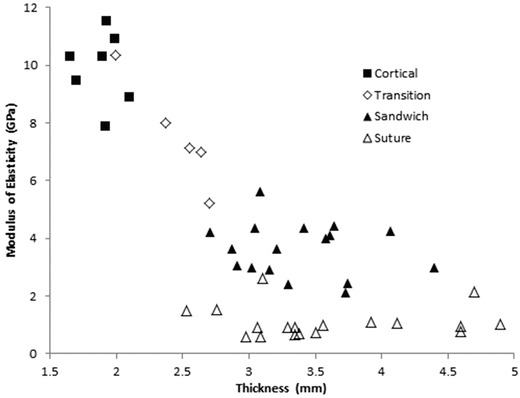

Fig. 22.4
Ultimate stress vs. specimen thickness from 4-point bending tests of samples from a 6 year old cranium (Adapted from Davis et al. [18])

Fig. 22.5
Modulus of elasticity vs. specimen thickness from 4-point bending tests of samples from a 6 year old cranium (Adapted from Davis et al. [18])
Although investigations have been conducted delineating the characteristics of the adult sutures [9, 19], biomechanical studies of sutures of the human skull in the pediatric age group have received less attention. For pediatric specimens, Davis et al. described the properties of suture in the 6 year old, and these data have been discussed above [18]. For the infant, where the suture is quite soft, Coats and Margulies harvested human infant pediatric cranial bone-suture-bone specimens from the coronal suture (n = 14 specimens from 11 calveria) and tested them in tension to rupture at rates of 1.2 and 2.38 m/s [17]. Rupture consistently occurred at the bone-suture interface. The authors found no significant effect of donor age or strain rate on the elastic modulus, ultimate stress, or ultimate strain of pediatric suture. Elastic modulus, ultimate stress, and ultimate strain for infant human suture are shown in Table 22.5.
Table 22.5
Material properties for infant cranial suture tested in tension (Adapted from Coats and Margulies [17])
Specimen number | Age | Elastic modulus (MPa) | Ultimate stress (MPa) | Ultimate strain (mm/mm) |
|---|---|---|---|---|
1 | 21 weeks gest | N/A | 3.5 | N/A |
2 | 28 weeks gest | 14.2 | 6.7 | 0.6943 |
13.2 | 6.3 | 4.7029 | ||
4 | 32 weeks gest | 4.3 | 4.5 | 2.8320 |
5 | 34 weeks gest | 6.9 | 5.7 | 1.2776 |
6 | 35 weeks gest | 8.1 | 4.2 | 1.1234 |
9 | 2 days old | 3.8 | 3.7 | 1.2776 |
11 | 2 weeks old | 6.4 | 2.2 | 1.0930 |
3.8 | 3.1 | 1.2014 | ||
16 | 1 month, 23 days old | N/A | 4.6 | N/A |
N/A | 7.2 | N/A | ||
18 | 2 months, 9 days old | N/A | 6.8 | N/A |
21 | 11 months old | 4.2 | 4.1 | 1.2511 |
22 | 12 months old | 16.2 | 3.5 | 0.3324 |
22.1.2.2 Brain Material Properties
Substantial evidence links cell death with deformation of nervous system tissue [23–27]. Thus, for the purposes of predicting brain injury, one must predict brain deformation. From an engineering mechanics perspective, a constitutive relationship links the tractions and body (inertial) forces experienced by the brain during a TBI event with the resulting deformation of the brain tissue. Thus, many have sought to elucidate the material properties of the brain to inform scaling of whole head kinematic adult TBI tolerance between species [28] and between ages within the same species [29], and for the development of pediatric finite element head/brain models [21]. (For a comprehensive review of brain material properties, see Chatelin et al. [30].)
Brain tissue is non-linear and viscoelastic. Thus, when determining the mechanical properties of brain tissue, the experimental protocol must deform the tissue samples at strain magnitudes and rates similar to that which is observed in TBI events. Direct observation of brain deformation for the calculation of strain during impact events is extremely difficult. Several studies have quantified brain-skull displacements in animals and human cadavers [31–33], but this technique currently lacks the spatial resolution to capture strain. Tagged magnetic resonance imaging of low amplitude head accelerations in humans that produce no injury, strains range from 2 % to 5 % [34, 35]. In hemi-section rapid rotation experiments of immature pig cadavers exposed to angular accelerations that would produce mild TBI, strains range from 9 % to 39 % [36]. Thus, we can expect that the relevant strains for more severe events would exceed 40 %, and thus mechanical tissue property tests should be in this range.
Determination of brain material properties generally requires removing tissue material from a live subject or fresh cadaver. It should be noted that difficulties exist with regard to characterization of the mechanical properties of soft tissue material ex vivo because of its quick deterioration postmortem [37–39]. It is well know that mechanical properties such as stress-relaxation characteristics differ significantly between live and dead brain tissue, and the variations maybe due to alterations in the parenchyma and vasculature pressure. Consequently, if one were to use autopsied brain tissue for the determination of the mechanical properties, time would be a critical factor. Porcine studies have been conducted to determine the mechanical response of the brain (to shear loads) within 3 h postmortem [40, 41]. However, practical and logistic constraints may limit the use of human cadaver brain to directly determine mechanical properties. Although it is possible to obtain tissues from operating rooms during surgery (with appropriate institutional approval and adherence to government regulations), the tissue may not all be fully usable for biomechanical material property testing because of the presence of pathologies. With careful attention to the aforementioned issues, limited material property testing of pediatric human [42] and animal brain tissue [40, 43–45] has been conducted. We present below a summary of the mechanical tissue testing that has been performed on both pediatric animal and human subjects.
Prange and Margulies [40] tested fresh swine white and gray matter at the infant and toddler ages, and adult swine and human specimens (surgical discards), using a parallel plate shear device at strains up to 50 %. The data were fit to a first order Ogden hyperelastic material model.
By examining brain tissue properties at specific strains across a broad strain spectrum (2.5–50 %), the authors found that the infant is approximately twice as stiff as either the toddler or the adult porcine animals at strains relevant to injurious TBI (Table 22.6). In addition, the authors noted significant heterogeneity (up to 50 %) in material stiffness between corpus callosum and gray matter, and between two white matter regions (corona radiata and corpus callosum.)
Table 22.6
Ogden material property parameters for pediatric and adult tissue (Adapted from Prange and Margulies [40])
Species | Human | Porcine | |
Region | Gray matter | Mixed gray/white matter | |
Age | Adult | 5 day old | 4 week old |
# samples | 6 | 6 | 5 |
α | 0.0323 | 0.0100 | 0.0326 |
μ0 (Pa) | 295.7 | 526.9 | 216.5 |
C1 | 0.335 | 0.332 | 0.316 |
τ1 (s) | 2.40 | 2.96 | 3.00 |
C2 | 0.461 | 0.389 | 0.428 |
τ2 (s) | 0.146 | 0.181 | 0.190 |
It should be noted, that at small strains (approximately less than 5–10 %) which are relevant to sub-injurious or possibly mild injury head impact events, the aforementioned trend reverses and the infant brain is softer than the adult. Thibault and Margulies [41] collected samples of frontal cerebrum from neonatal (2–3 days) and adult pigs and tested them within 3 h post-mortem. The complex shear modulus of the samples was measured in a custom-designed oscillatory shear testing device at engineering shear strain amplitudes of 2.5 % or 5 % from 20 to 200 Hz. In this range, the elastic and viscous components of the complex shear modulus increased significantly with the age-based development of the cerebral region of the brain.
These trends are also observed in the rat. Finan et al. used microindentation to determine viscoelastic properties of different anatomical structures in sagittal slices of juvenile and adult rat brain [43]. Strains were limited to 10 %. The authors found that the brain becomes stiffer as the animal matures. Similarly, Gefen et al. conducted controlled 1 mm indentation of a force probe into the intact rat brain, both inside the braincase and with the brain removed from the skull [44]. Rats were either 13, 17, 43 or 90 days old, and test samples were either preconditioned (PC) or non-preconditioned (NPC), the former to study the effect of repeated blows to the head. The instantaneous (Gi) and long-term (G′) shear moduli of brain tissue were determined. The immature rat brain (Gi = 3,336 Pa NPC, 1,754 Pa PC; G’ = 786 Pa NPC, 626 Pa PC) was significantly stiffer (p < 0.05) than the mature brains (Gi = 1,721 Pa NPC, 1,232 Pa PC; G’ = 508 Pa NPC, 398 Pa PC).
These results at small strains are also reflected in human pediatric tissue studies. Chatelin et al. (2012) conducted a rheological study on autopsy brain tissue from seven subjects aged 2 months old to 55 years old. Three tissue morphologies were extracted – gray matter (thalamus), white matter (corona radiata), and brain stem. Samples were tested 24–48 h post-mortem in oscillatory shear to 0.5 % engineering strain, at frequencies ranging from 0.5 to 10 Hz. Results show a two to three fold increase in storage or loss modulus between the three infant subjects (2, 2 and 5 months old) and either the two toddler subjects (22 and 23 months old), or the two adult subjects (50 and 55 year old).
The compendium of these data highlights the importance of test conditions on the stiffness of brain material across the child to adult age spectrum. These results suggest that at small strains the infant brain is softer than the adult, but at large strains most relevant for moderate and severe TBI, the adult is softer than the infant. It is also important to note that the small strain studies have demonstrated an increase in storage or loss modulus with increasing strain rate [46, 47], and at this writing we are unaware of any brain tissue testing conducted at both high strain and high strain rates comparable to those observed in injurious TBI events. More research is required to find the appropriate tissue properties for brain material at both high strain and high strain rates.
Selection of appropriate material properties of the brain can have significant effect on the predicted outcome in finite element models of the head. The coefficients of the material model for the brain will directly affect the resulting strains, with stiffer brain materials leading to lower strains, given the same input conditions. In the infant, where the vault is softer due to the pliable sutures and incomplete skull bone formation, variations in brain material stiffness may influence the response of the skull. For example, when simulating falls in the infant, varying brain tissue material properties within the ranges reported in the literature can increase by approximately one-third the maximum principal stress in the skull [21], and thus selection of FE brain material properties may affect not only the strain in the brain, but also the prediction of skull fracture in the young.
22.1.3 Brain and Skull as a System
Response of the whole pediatric head has been confined to only one study of neonates. Prange et al. [48] conducted compression and drop tests on three fresh frozen isolated human head specimens ages 1, 3, and 11 days post-natal. First, each head was exposed to compression between two rigid flat plates. The maximum head deformation during the compression was limited to 5 % of the total gauge length of the head to ensure no damage or fracture. Following preconditioning, the head was compressed at constant velocity using four different rates – 0.05 mm/s (quasi-static), 1.0, 10 and 50 mm/s. Compression tests were conducted in the anterior-posterior (AP) and right-left (RL) directions. Following the compression tests, each head was dropped on a rigid flat surface from 15 or 30 cm. At each drop height, the head was impacted once in each of the five locations: vertex, occiput, forehead, right parietal bone, and left parietal bone. For biofidelity evaluation of the infant ATD, similar experiments were conducted with the CRABI 6 month old ATD head.
The force deflection data for all tests exhibited an initial toe region with increasing stiffness at higher displacements. The linear stiffness was dependent on rate of displacement. The average stiffness values for the 0.05, 1.0, 10, and 50 mm/s constant velocity compression tests were 7.45, 23.3, 29.9, and 29.5 N/mm respectively. The quasi-static stiffness was significantly less than the three higher rates (Fig. 22.6). Peak acceleration and HIC varied with drop height but did not change between impact locations. Maximum head acceleration by drop height and impact location is shown in Fig. 22.7. Average peak acceleration and HIC during the 30 cm drop height impacts were 55.3 g and 84.1 respectively. Both these average values were significantly greater than the average peak acceleration and HIC values of 38.9 g and 32.9 respectively for the 15 cm drop height impacts. The acceleration pulse durations were not significantly different between the 15 and 30 cm drop height impacts with an average pulse duration of 18.3 ms. At both 15 and 30 cm drop heights, CRABI acceleration was similar to the cadaver data for the vertex, occiput, and forehead impacts but significantly greater for the lateral impact (Fig. 22.8).
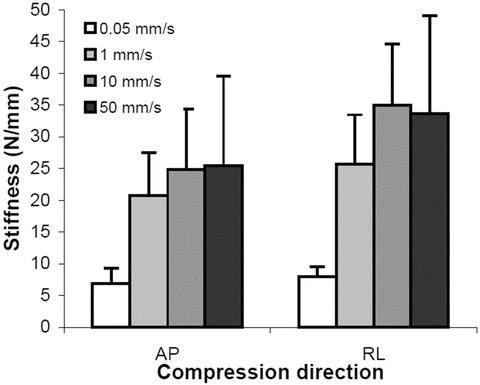
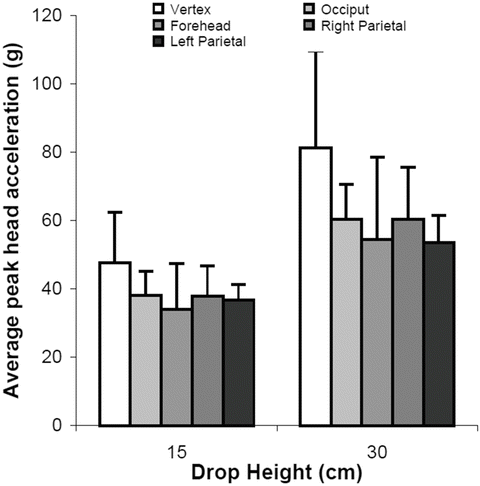
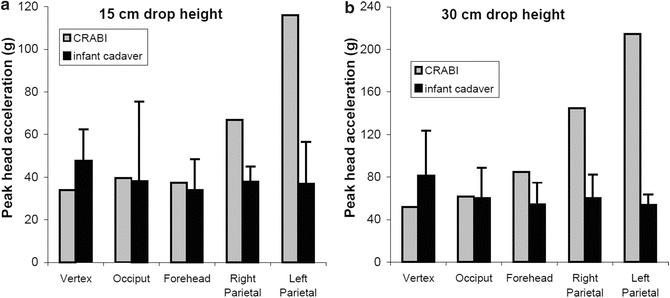

Fig. 22.6
Stiffness values determined from head compression tests at different constant velocities in two different directions from three neonate human cadavers. AP is anterior-posterior and RL is right-left (Reprinted with permission. The Stapp Association from Prange et al. [48])

Fig. 22.7
Average peak head acceleration from drop tests of three neonate human cadavers, stratified by drop height and impact location (Reprinted with permission. The Stapp Association from Prange et al. [48])

Fig. 22.8
CRABI and infant cadaver peak head acceleration for five impact locations from 15 cm (a) and 30 cm (b) drop heights. Error bars indicate standard deviation (Reprinted with permission. The Stapp Association from Prange et al. [48])
22.1.4 Injury Scaling Methods in Pediatric TBI Animals Models
Studies of human patient populations suggest that young children who sustain severe TBI in early childhood or moderate or severe TBI in infancy may be particularly vulnerable to significant residual cognitive impairment [49–53]. However, it is unclear in these studies if the youngest patients have poorer outcomes because they experienced more severe TBI events than their older counterparts, or if there is a biochemical or physiological vulnerability in the young. To separate TBI severity from vulnerability, researchers turn to animal models of human pediatric and adult TBI. By imparting the same scaled TBI insult to the adult and pediatric animal, the biochemical or physiological vulnerability between ages can be quantified. Several methods of such scaling are described below.
22.1.4.1 Mass-Acceleration Scaling
Ibrahim et al. conducted rapid rotation TBI experiments on pigs representing the infant (3–5 day old pig) and toddler (4 week old) humans [36]. To scale loading conditions between animal ages, Holbourn’s scaling law for acceleration was utilized [54],
![$$ {\alpha}_i={\alpha}_t{\left[\frac{M_t}{M_i}\right]}^{\frac{2}{3}} $$](/wp-content/uploads/2016/09/A31137_3_En_22_Chapter_Equa.gif) where the subscripts i and t refer to the infant and toddler, M is the mass of the brain, and α is the angular acceleration of the head. The infant animals were exposed to higher angular accelerations than the toddler pigs, such that both age groups experience similar theoretical brain tissue strain. The authors found no difference in the percentage volume of axonal injury or subarachnoid hemorrhage score between these two animals of differing age that received similar scaled TBI insults. While these data suggest that scaling is an accurate method to transform injury thresholds between the old and young, an assumption is that the brain tissue material modulus is similar across the age spectrum.
where the subscripts i and t refer to the infant and toddler, M is the mass of the brain, and α is the angular acceleration of the head. The infant animals were exposed to higher angular accelerations than the toddler pigs, such that both age groups experience similar theoretical brain tissue strain. The authors found no difference in the percentage volume of axonal injury or subarachnoid hemorrhage score between these two animals of differing age that received similar scaled TBI insults. While these data suggest that scaling is an accurate method to transform injury thresholds between the old and young, an assumption is that the brain tissue material modulus is similar across the age spectrum.
![$$ {\alpha}_i={\alpha}_t{\left[\frac{M_t}{M_i}\right]}^{\frac{2}{3}} $$](/wp-content/uploads/2016/09/A31137_3_En_22_Chapter_Equa.gif)
22.1.4.2 Scaled Cortical Impact
Controlled cortical impact is a laboratory TBI injury method where an indentor is rapidly driven into the brain. Unlike the rapid rotation mechanism described above which leads to diffuse brain injury, the most severe location of tissue damage is typically at the site of indentation. Depending on the severity of injury and time since the injury occurred, injured tissue may extend to the contralateral hemisphere. When studying brain injury across the child-adult age spectrum, scaled cortical impact is necessary to ensure experiments across groups of animals of different ages receive the same impact severity relative to their brain size. One such method is to ensure a uniform percent volume of displaced brain by the impactor across animal ages, as performed by Missios et al. [55]. Those authors performed scaled controlled cortical impacts in the infant, toddler and early adolescent age groups of pig. Cortical indentation was performed with a stainless steel impactor applied directly to the exposed brain (some protocols will leave the dura intact). For each animal age group, a specific indentor diameter and penetration depth was used such that the indentor displaced 1 % of the total brain volume. In total, 67 (30 males) animals were tested. At 7 days post-indentation, the animals were sacrificed and five coronal brain sections centered around the site of indentation were the basis for injury quantification. Injury was defined as any tissue with the presence of necrosis with or without hemorrhage, neuronal dropout or damage, and/or reactive gliosis, all identified by light microscopy in each of the five coronal brain sections. Injury was evaluated 7 days following TBI. The percent area of injured tissue was determined and compared across ages.
Immediately following indentation, the degree of cortical surface hemorrhage at the site indentation was uniform across all age groups, suggesting that the scaling approach led to uniform mechanical insult across age. Seven days after indentation, the percent area of injured tissue increased as a function of age. Infants had smaller lesion sizes than toddlers (3.0 ± 0.8 percent of cortical surface area versus 8.5 ± 1.6) and toddlers had smaller lesion sizes than adolescents (8.5 ± 1.6 versus 25.1 ± 2.7).
22.1.4.3 Pressure Scaling
Bittingau et al. exposed 3, 10, 14 and 30 day old rats to weight drop impacts proximal to the sensorimotor cortex [56]. To ensure severity of injury was not influenced by skull thickness, the skull at the location of impact was mechanically thinned prior to injury in animals in the 10, 14 and 30 day old rats, such that each had a similar skull thickness to the 3 day old rat. To ensure animals in each age group received a mechanically similar insult, the height from which the weight was dropped was adjusted to yield equal contact pressure across all ages. Results suggest that vulnerability decreases with age. Twenty-four hours following scaled impact, apoptotic cell damage was substantially elevated in 3 and 7 day old animals, compared to the 10 and 14 day rats, and injury was almost undetectable at 30 days. Interestingly, apoptosis was worst for the 7 day old animals – the second youngest animal. This non-linearity in the vulnerability-age relationship may be due to biomechanical factors – such as age-dependent changes in the stiffness of rat brain [43, 44] – or biochemical factors, such as documented N-methyl-d-asparate (NMDA) receptor hypersensitivity in the 7 day old rat leading to excitotoxicity [57, 58].
22.1.4.4 Scaled Acute Subdural Hematoma
Durham and Duhaime induced experimental subdural hematoma (SDH) in 15 pigs of age 5 days, 1 month, and 4 months old [59]. To induce SDH, a volume of blood equal to 10 % of the intracranial volume of each pig was injected through a right frontal burr hole. Following injection, the dura was sealed with cyanoacrylate glue and scalp sutured. At 7 days post-injury, the animals were euthanized. A 1.5 cm thick coronal section centered under the injection site was analyzed for injury via histology including hematoxylin and eosin staining and TUNEL staining. A significant difference in percentage of injured hemisphere was noted between the 5-day old group (0 %) and the 1 month old (7 %) and 4-month old (9 %) animals.
22.1.4.5 Acute Injury Severity Scaling
Another approach to comparing the outcome following brain injury between adult and pediatric animals exposed to the same scaled insult is to adjust the mechanical insult until the acute injury response is equal across age groups, and then examine long term outcome. For example, Cernak et al. examined the response to TBI in rats across the pediatric to adult age spectrum [60]. Rats were subjected to a single TBI event at either 7 days old, 14 days old, 21 days old or 3 months old. To induce TBI, animals were positioned prone while a pneumatically-driven impactor struck the bare skull. A metal disc was affixed to the skull to eliminate injury differences cause by skull maturity, and the animal head was supported by a gel pillow that allowed the head to rotate as a result of the impactor strike. To provide uniform impact intensity across the age groups, the authors tuned the impactor stroke in each age group such that a similar (20–25 %) acute (<5 min) mortality rate was observed across all age groups. This technique allowed the researchers to study the short- and long-term consequences of the same injury severity induced across a broad age range.
Responses between young and old animals show several important trends. While all animals regardless of age exhibited signs of vasogenic edema compared to uninjured age-match shams at 20 min post-injury, pediatric animals resolved their edema at 4 and 24 h following injury while edema persisted in adults at these later time points. In addition, younger animals showed persistent and substantial deficits in motor function at multiple time points up to 90 days following TBI, compared to age-matched shams. Conversely, adults had only modest deficits that were resolved within 7 days post TBI. Interestingly, cognitive testing showed an opposite trend, with pediatric animals showing little difference from shams in Morris water maze platform tests, and adults showing consistently poorer performance as compared to shams.
Scaling of the TBI event across animals of the same age within the same species is an emerging area of TBI research, with all the aforementioned publications occurring in the last 6 years. These methods of ensuring proportionality of TBI insult across age are essential to scaling well validated and accepted adult injury criteria to children. Clearly, this emerging branch of TBI research has not reached any conclusion, with some studies showing equivalent vulnerability between the young and old, some showing the eldest to be more vulnerable than the youngest, and some showing the young to be more vulnerable than the adult. These contradictory conclusions are fueled by differences in species chosen for research, the time point(s) post-injury when deficit is assessed, and the histological or behavioral methods used to quantify deficit. Additional research is this area will elucidate the answers to these questions.
In addition to recognizing the role of impact severity on outcome, the direction of impact also plays an important role. Eucker et al. conducted non-impact rapid rotation TBI experiments in three anatomic planes of head rotation that produced mild to severe TBI, using 3–5 day old pigs that represent approximately the 1 year old human [61]. The authors found that regional cerebral blood flow, primary brain injury (extra-axial bleeding, diffuse axonal injury), and secondary brain injury (ischemia and infarct) differed by head rotation direction, with sagittal and axial rotations resulting in moderate to severe TBI, and coronal injuries resulting in mild to no TBI. When considering the motion of the brain in these experiments, it is important to note that the coronal rotation in the biped human is most like an axial rotation in the pig.
22.1.5 Injury Criteria
The widely used Head Injury Criterion (HIC) was developed in the 1970s. The basis of the HIC lies in the Wayne State University tolerance curve which was developed by dropping embalmed human cadaver foreheads onto unyielding flat surfaces [62–64]. In its final form, the tolerance curve was developed by combining the result from a wide variety of pulse shapes, cadavers, animals, human volunteers, clinical research, and injury mechanisms. Skull fracture and/or concussion was used as the failure criterion except for long-duration human volunteer tests wherein no apparent injuries were reported. The criterion is given by the following equation:
![$$ HIC= max{\left[\Big\{1/({t}_2-{t}_1\Big\}{\displaystyle {\int}_{t1}^{t2}a(t)dt}\right]}^{2.5} $$](/wp-content/uploads/2016/09/A31137_3_En_22_Chapter_Equb.gif) where t1 and t2 are arbitrary times during the acceleration phase, and a(t) is the resultant acceleration response. Attempts have been made to establish pediatric head injury tolerance using adult data for the HIC and angular thresholds. A widely used procedure for scaling the angular/rotational acceleration between species is based on the mass of the brain as described above for scaling across age [54, 65].
where t1 and t2 are arbitrary times during the acceleration phase, and a(t) is the resultant acceleration response. Attempts have been made to establish pediatric head injury tolerance using adult data for the HIC and angular thresholds. A widely used procedure for scaling the angular/rotational acceleration between species is based on the mass of the brain as described above for scaling across age [54, 65].
![$$ {\alpha}_H={\alpha}_A{\left[{M}_A/{M}_H\right]}^{\frac{2}{3}} $$](/wp-content/uploads/2016/09/A31137_3_En_22_Chapter_Equc.gif) where subscripts H and A refer to the human and animal, respectively, M is the mass of the brain, and α is the angular acceleration of the head. The underlying assumption is that the density, material property, and brain shape between the animal and the human are equal. This equation results in a value of 1,700 rad/s2 for the angular acceleration threshold for the adult human. Using this approach and assuming the mass of the infant brain to be 0.5 kg, pediatric head injury tolerances have been obtained [66]. Because developmental and anatomic differences exist between the pediatric and adult skull and brain, this equation was modified in later studies [29, 41] to incorporate the age-related material property changes in the brain tissues,
where subscripts H and A refer to the human and animal, respectively, M is the mass of the brain, and α is the angular acceleration of the head. The underlying assumption is that the density, material property, and brain shape between the animal and the human are equal. This equation results in a value of 1,700 rad/s2 for the angular acceleration threshold for the adult human. Using this approach and assuming the mass of the infant brain to be 0.5 kg, pediatric head injury tolerances have been obtained [66]. Because developmental and anatomic differences exist between the pediatric and adult skull and brain, this equation was modified in later studies [29, 41] to incorporate the age-related material property changes in the brain tissues,
![$$ {\alpha}_C={\alpha}_{Ad}{\left[{M}_{Ad}/{M}_C\right]}^{\frac{2}{3}}\left\{{G}_C^{\prime }/{G}_{Ad}^{\prime}\right\} $$](/wp-content/uploads/2016/09/A31137_3_En_22_Chapter_Equd.gif) where the subscripts Ad and C refer to the adult and child, respectively, and G′ is the elastic modulus of the brain. In the case where the infant brain is stiffer than the adult [40], the acceleration tolerance of the child would be higher than that which was predicted by considering brain mass alone. However, in the case where the infant brain is softer than the adult [40], the acceleration tolerance of the child would be lower than that which was predicted by considering brain mass alone. Additional research in this area is required to elucidate these relationships.
where the subscripts Ad and C refer to the adult and child, respectively, and G′ is the elastic modulus of the brain. In the case where the infant brain is stiffer than the adult [40], the acceleration tolerance of the child would be higher than that which was predicted by considering brain mass alone. However, in the case where the infant brain is softer than the adult [40], the acceleration tolerance of the child would be lower than that which was predicted by considering brain mass alone. Additional research in this area is required to elucidate these relationships.
![$$ HIC= max{\left[\Big\{1/({t}_2-{t}_1\Big\}{\displaystyle {\int}_{t1}^{t2}a(t)dt}\right]}^{2.5} $$](/wp-content/uploads/2016/09/A31137_3_En_22_Chapter_Equb.gif)
![$$ {\alpha}_H={\alpha}_A{\left[{M}_A/{M}_H\right]}^{\frac{2}{3}} $$](/wp-content/uploads/2016/09/A31137_3_En_22_Chapter_Equc.gif)
![$$ {\alpha}_C={\alpha}_{Ad}{\left[{M}_{Ad}/{M}_C\right]}^{\frac{2}{3}}\left\{{G}_C^{\prime }/{G}_{Ad}^{\prime}\right\} $$](/wp-content/uploads/2016/09/A31137_3_En_22_Chapter_Equd.gif)
Recognizing the need to account for both material and geometric variations, as an initial step, injury assessment reference values for the 6 month old infant ATD were obtained by combining geometric and material scaling data between the adult and pediatric groups [67]. The skull bone modulus of elasticity from literature was used to determine the modulus of elasticity ratio for the skull of the 6 month old infant ATD [15]. The mechanical properties of the human skull between the newborn and the 6-year-old were approximated by a linear fit. Using the principles of scaling discussed in the earlier section and detailed in the Appendix, injury assessment reference values developed for the adult midsize male (Hybrid III) and scaled to estimate the corresponding values for the HIC and head acceleration for the child dummies. Injury assessment reference values were developed for the CRABI 6-month-old ATD with deploying passenger airbags [67]. The recommended values are peak resultant head acceleration of 50 g associated with a 22-ms HIC of 390. It was stated that the 390 value for HIC should not be permitted for shorter time duration pulses with values above 50 g. Using skull bone modulus as a governing parameter for material scaling, HIC values of 121, 275, and 525 were obtained for the 12 month old, 3 year old, and 6 year old dummies, respectively [68].
The advent of the finite element modeling in biomechanics research affords the opportunity for determining head injury thresholds for children. Klinich et al. developed a finite element model (FEM) of a 6-month-old infant head using available material properties and humanlike geometry [22]. The infant head FEM was used to simulate different injury and no-injury loading conditions based on child restraint response data from reconstruction tests. Logistic regression analysis was used to estimate threshold stresses associated with skull fracture. The acceleration responses of the infant head FEM and the CRABI ATD were compared for the no-injury and injury producing conditions. Provisional injury assessment reference values were estimated for the current CRABI ATD (Table 22.7).
Table 22.7
Tolerance limits for various head injury criteria, derived from finite element model reconstructions of rear-facing infant seat airbag fatalities (Adapted from Klinich et al. [35])
Head | Tolerance for injury lies between | Tolerance for severe injury lies between | |||
|---|---|---|---|---|---|
Peak resultant accel (g) | Infant head | 46 | 152 | 152 | 217 |
CRABI FEM | 42 | 143 | N/A | N/A | |
CRABI ATD | 46 | 128 | N/A | N/A | |
3 ms clip resultant accel (g) | Infant head | 42 | 107 | 107 | 108 |
CRABI FEM | 40 | 110 | N/A | N/A | |
CRABI ATD | 45 | 77 | N/A | N/A | |
Mean resultant accel (g) | Infant head | 15 | 79 | 79 | 85 |
CRABI FEM | 12 | 63 | N/A | N/A | |
CRABI ATD | 17 | 49 | N/A | N/A | |
HIC (unlimited) | Infant head | 207 | 881 | 881 | 1,477 |
CRABI FEM | 143 | 758 | N/A | N/A | |
CRABI ATD | 239 | 376 | N/A | N/A | |
HIC (15 ms) | Infant head | 146 | 881 | 881 | 1,477 |
CRABI FEM | 98 | 758 | N/A | N/A | |
CRABI ATD | 161 | 376 | N/A | N/A | |
22.2 Neck
22.2.1 Developmental Anatomy
The major structural components of the neck include the cervical spinal column and soft tissues. The cervical spine consists of seven vertebrae (C1–C7). The intervertebral discs start inferiorly from C2. Spinal ligaments interconnect from the base of the skull (occiput) to C7 and proceed distally. The spinal cord that originates from the foramen magnum is housed in the osseous-ligament anatomy of the spinal column. Muscles originate and insert at various locations along the neck and proceed along the cranial and caudal directions. A brief description of the developmental anatomy of the various components is given below.
22.2.1.1 Vertebrae
The primary developmental characteristic of the vertebral column is the presence of cartilaginous tissue, termed synchondroses, which convert to bone as the individual ages.
Atlas
The first vertebra (Cl) is called the atlas. It is formed from three primary ossification centers; two bilaterally in the posterior neural arches, present at birth and one anteriorly, developing several months to 2 years postnatally. The junctions between the anterior and bilateral posterior centers are called the neurocentral synchondroses. The two neural arch centers meet dorsally at the posterior synchondrosis. Fusion of the posterior synchondrosis occurs first – in the fourth or fifth year of life, followed by the neurocentral synchondrosis approximately 1 year later. The spinal canal fully forms and attains the mature adult size following complete fusion of the primary ossification centers [69–71].
Axis
The second vertebra (C2) is called the axis. It is formed from five primary ossification centers; one in the centrum (vertebral body location), two bilaterally in the posterior neural arches, and two in the odontoid process [72–75]. The two centers in the odontoid are separate in utero and join to form a single ossification center by the seventh month prenatally. The posterior synchondrosis forms at the junction of the neural arches and fuses in postnatal year 3 to 4. The cartilaginous regions between the odontoid and the neural arches, the dentoneural synchondroses, ossify at a similar time. The odontoid process is connected to the body of C2 by dentocentral synchondrosis and fuses by postnatal year 4 to 6. Paired neurocentral synchondroses connect the two posterior arches and centrum and fuse at a similar time. The synchondrosis that joins the tip of the odointoid process to its body forms between ages 3 and 6 years and remains cartilaginous until 12 years of age and in certain cases never ossifies. As in the case of the atlas, the spinal canal reaches its mature size following closure of the posterior and neurocentral synchondroses [69–71].
Typical Cervical Vertebrae
Each of the five vertebrae of the lower cervical spine, C3–C7, is formed from three primary ossification centers, one in the anterior centrum and two in the posterior neural arches [72–77]. The neurocentral synchondroses are the joining element between the neural arches and centrum bilaterally. The two neural arches are connected to each other by the posterior synchondrosis which fuses in postnatal year 2. Joining of the anterior and posterior ossification centers occurs in postnatal year 3 or 4. Similar to Cl and C2, the spinal canal size attains the adult dimension following completion of these primary ossifications [69, 70]. Figure 22.9 illustrates the characteristics of ossification in the atlas, axis, and a typical cervical vertebra.
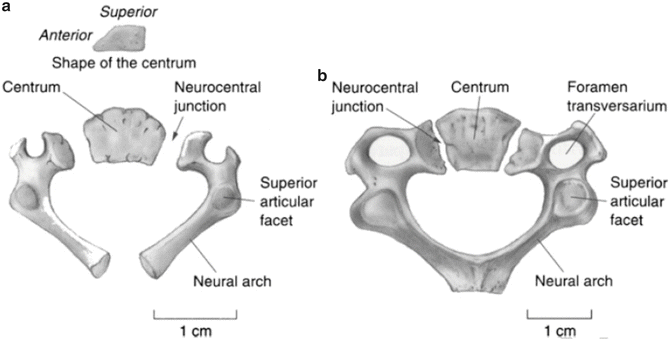

Fig. 22.9
Cervical vertebrae of a perinate (a) and a 3 year old (b) showing the synchondroses and other relevant vertebral anatomy (Reprinted from Scheuer and Black [78])
During development, the overall dimensions and shape of the vertebrae change. With advancing age, vertebral bodies attain a more rectangular shape and increase in height as the superior and inferior growth plates develop [79–85]. This growth continues until puberty. The growth plates contribute to the longitudinal development of the vertebral body. The latitudinal growth occurs by the expansion of the neural arch ossification centers that develops into three independent growth zones bilaterally: the pedicle, lamina, and transverse processes. The uncovertebral joints of C3–C7, formed between the lateral edges of the superior surfaces of one vertebral body and the inferior surface of the vertebral body directly above, do not form until age 6 years [78, 86–90]. These joints are responsible for the saddle shape of the cervical vertebrae and coupled motion of the spine [91, 92].
Facet Joints
Bilateral facet joints form the posterior connection between the inferior articular surface of the superior vertebra and the superior articular surface of the inferior vertebra (Fig. 22.10). The two surfaces are connected by the synovial joint consisting of the synovial fluid, synovial membrane, articular cartilage, and capsular ligaments. Developmentally, orientations of the facet joints change and the variations depend on the vertebral level. The joints in the upper spine are more horizontal than those of the lower cervical spine and become more upright with advancing age (Fig. 22.11) [72–74, 83, 93, 94]. The more horizontal orientation of the upper spine facet joints, together with the softer intervertebral components, appears as pseudosubluxation in younger ages [95–99]. Pseudosubluxation, initially defined through lateral x-rays of the pediatric cervical spine of the neck in extension by Cattell and Filtzer in 1965, refers to normal anterior displacement of a vertebra relative to its inferior adjacent vertebra that is so pronounced that it resembles an injurious condition [97]. Approximately 40 % of children demonstrate non-injurious pseudosubluxation at C2–C3 and 20 % at C3–C4. The changing facet joint orientation likely contributes to variations in the distribution of external load with increasing age (i.e. the relative contribution of axial versus shear loading) [83, 100].
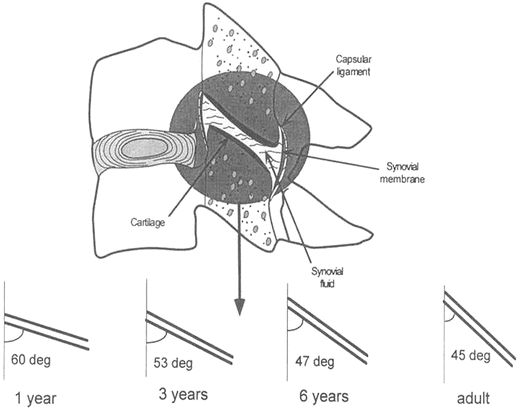
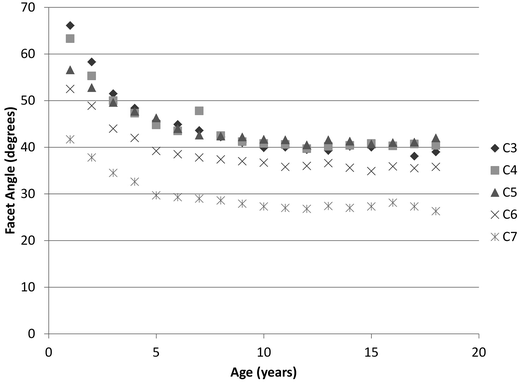

Fig. 22.10
Exploded facet joint illustrating its components (top). Variation of the facet joint orientation as a function of age is shown (bottom)

Fig. 22.11
Variation of the facet joint angle as a function of age (Data adapted from Kasai et al. [83])
Quantitative Description of Vertebral Growth
The most comprehensive quantitative study of vertebral developmental anatomy was performed by Kasai et al. via radiographs of approximately 350 children from birth to 18 years [83]. The authors quantified numerous metrics including vertebral diameter, vertebral height, facet joint angle, lordosis angle from C3 to C7 and cervical length. Selected developmental observations include: an increase in vertebral body diameter and height with age (Fig. 22.12), an increase in the initially horizontal facet angle through age 10 years, and decrease in the cervical lordosis angle through age 9 years and then increase through the ages of puberty. In addition to dimensional changes, these authors quantified the available sliding motion of adjacent vertebra, defined as the relative horizontal displacement of adjacent vertebrae during flexion and extension as a percent of intervertebral disc diameter. As an example, for C2–C3 the maximum sliding motion ranged from 34 % for 1 year olds to 13 % for 18 year olds. Other cervical levels demonstrated similar observations. This reference provides a wealth of additional quantitative information.
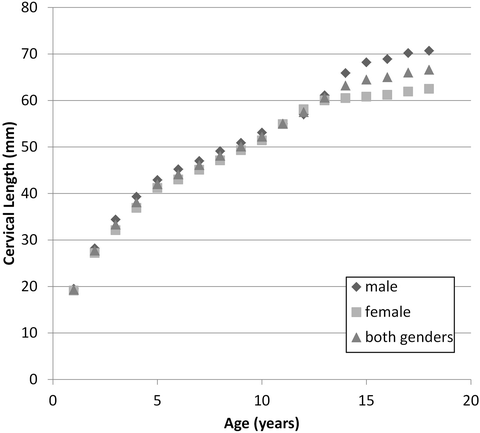

Fig. 22.12
Variation of the summated height of the typical cervical vertebral bodies denoted as cervical length from C3 to C7 as a function of age and gender (Data adapted from Kasai et al. [83])
Age-Related Groupings
Based on vertebral growth and characteristic distributions in the constituents between the cartilaginous structures of the synchondrosis and the bone itself, pediatric structures can be broadly categorized into four groups [78, 86–90]. In general, the age group between newborn and 1 year can be skeletally represented by the presence of three primary ossification centers. The age group between 1 and 3 years can be represented by the fusion of the posterior synchondrosis. The age group between 3 and 6 years is marked by fusion of the bilateral neurocentral synchondroses, and the 11- to 14- year (approximately puberty) group corresponds to secondary ossification and initiation of the development of the uncinate and uncovertebral anatomy (Fig. 22.13). Skeletally mature adult vertebral anatomy in the human occurs during the second decade of life.
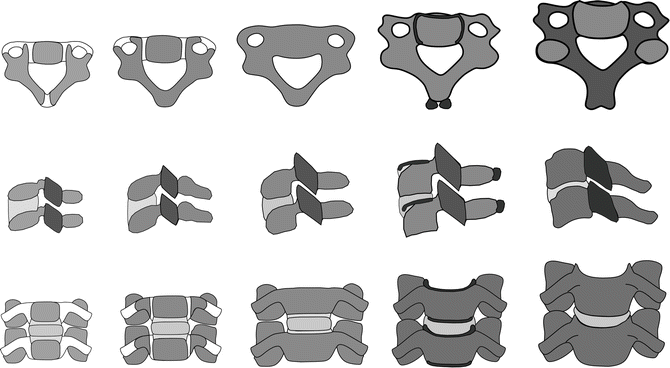

Fig. 22.13
Typical cervical vertebrae (top row) as viewed from the top and functional units as viewed from the side (middle row) and front (bottom row). Typical growth patterns are illustrated. Starting from the left, patterns represent groups I, II, III, IV and adult spines. Cartilage is shown in lighter color and bony components are shown in darker color. Secondary ossifications are shown in the darkest color for group IV (all three rows). In the middle row, the facet joints are expanded to illustrate changes in their orientation with age
22.2.1.2 Ligaments
Cervical vertebrae are connected to each other and the base of the skull by ligaments. Ligaments are unique to the upper cervical region, i.e., the occiput-atlas-axis complex [101, 102]. Beginning anteriorly, the anterior atlanto-occipital membrane connects the occiput to C1; it is renamed the anterior longitudinal ligament below C1. The apical ligament attaches from the occiput to the tip of the odontoid process of C2. The alar ligaments attach from the superior-lateral aspect of the odontoid process and run obliquely to the occiput. The cruciate ligament has a strong transverse portion that runs laterally around the odontoid process and attaches at both ends to the medial aspects of the arch of the atlas. The vertical cruciate ligament attaches from the occiput, just posterior to the apical ligament, intertwines with its transverse portion, and attaches again to the posterior-inferior aspect of the vertebral body of the axis. The tectorial membrane attaches to the anterior one-third of the occiput just posterior to the vertical cruciate ligament. This ligament tapers inferiorly to become continuous with the posterior longitudinal ligament. The posterior atlanto-occipital membrane connects the superior aspect of the posterior arch of the atlas to the occiput [103]. Proceeding inferiorly from C2, the anterior and posterior longitudinal ligament, ligamentum flavum, bilateral capsular, and interspinous ligaments connect one vertebra to its immediate adjacent vertebra (Fig. 22.14).


