Body region
% AIS2–6 injuries
Head
31.4 %
Face
4.2 %
Neck
1.4 %
Chest
10.3 %
Abdomen
5.4 %
Pelvis
6.3 %
Arms
8.2 %
Legs
32.6 %
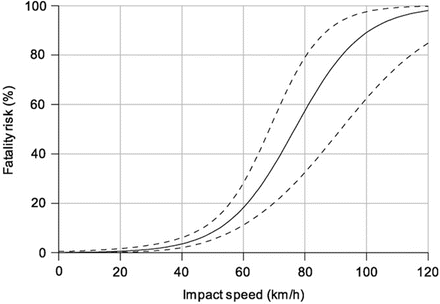
The strong correlation between vehicle impact speed and pedestrian injury severity is well documented [5, 16–20]. However, absolute risk levels are disputed and the newer data from Rosen and Sander [20] shown in Fig. 24.1 may be the most reliable to date. It shows a steep increase in fatality risk for impacts above about 40 km/h.
24.1.2 Injuries from Vehicle and Ground Contact
24.1.3 Injury Risk as a Function of Vehicle Type
Impacts with larger passenger cars result in more serious pedestrian injuries than smaller cars [22–24]. However, there is an even stronger relationship between vehicle type (cars, trucks, SUVs etc.) and pedestrian injury/fatality risk. Lefler et al. [25] used a combination of the Pedestrian Crash Data Study (PCDS) data, the General Estimates Data and the Fatal Accident Reporting System data from the US to show that 11.5 % of pedestrians struck by large SUVs are killed, compared with 4.5 % for pedestrians struck by cars. A more recent analysis concluded that the odds-ratio for pedestrian fatalities from LTVs impacts compared to cars is closer to 1.5 [26].
Longhitano et al. [27, 28] used the Pedestrian Crash Data System to analyze the influence of vehicle type on pedestrian injury distribution, see Fig. 24.2. Ground impact injuries were not included. They found AIS3+ head injuries in 71 % of cases for car impacts compared to 81 % of cases for LTVs. AIS3+ injuries of the mid-body regions were found in car impacts in only 25 % of cases compared to 60 % of cases for LTVs. They concluded that the head was the most frequently injured body region for both vehicle categories, but the next most important body region is the lower extremity for impacts with cars, whereas for impacts with LTVs it is the torso. In less motorized countries, the most severe pedestrian injuries (AIS4-5) occur in accidents which involve either buses or trucks [29].
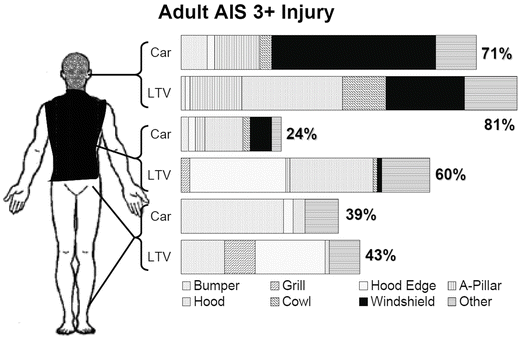

Fig. 24.2
Distribution of AIS3+ pedestrian injuries as a function of vehicle type (Adapted from [27])
A recent breakdown of body regions injured and the vehicle components involved for European data is shown in Table 24.2. The data show that the overwhelming majority of lower extremity injuries are caused by the bumper. For head injuries, the windshield and A-Pillar are mainly responsible, but a significant proportion of head injuries comes from subsequent contact with the ground.
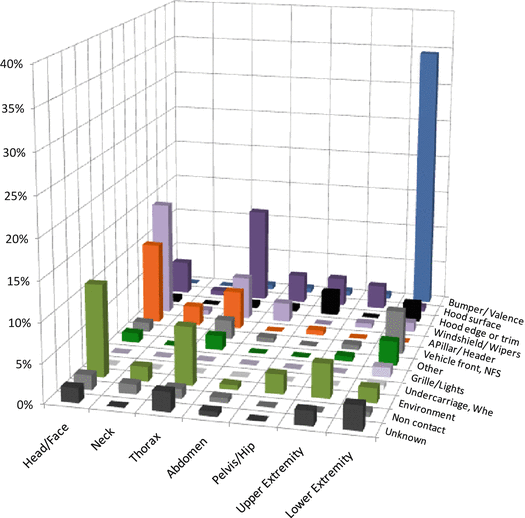
Table 24.2
Body regions injured and the vehicle components involved [30], reprinted with permission from the Association for the Advancement of Automotive Medicine

24.1.4 Pedestrian Impact Kinematics
The movement of pedestrians during and after vehicle impact is key to understanding the resulting injury mechanisms and for informing improved vehicle design. The most important factors determining pedestrian kinematics during impact are the shape and speed of the vehicle and the height, stance and speed of the body relative to the vehicle at the instant of impact. Film evidence of pedestrian accidents shows that significant variations in the impact configurations and the resulting kinematics frequently occur. This chapter focuses on the most common impact sequences, but individual accident cases are unlikely to be fully described by the descriptions in this chapter.
About 80 % of pedestrians were standing up and moving across the road when struck from the side by the fronts of passenger cars [31, 32], and about 60 % of pedestrians made no avoidance maneuver prior to impact such as jumping, accelerating, turning away or stopping [33]. Therefore the most important pedestrian accident scenario is a side-struck pedestrian moving at walking pace across the vehicle line of travel. However, this configuration may not be representative of children, as one analysis found that nearly half of child pedestrians struck by vehicles were running when struck [34].
24.1.5 Wrap Projection
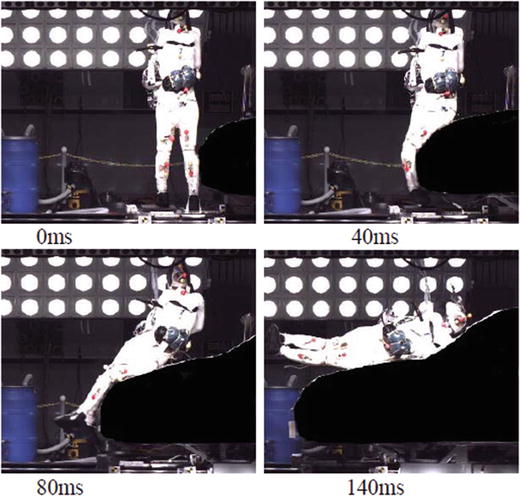
Pedestrian wrap projection occurs when the principal vehicle impact force is applied below the centre of gravity. This is the most common sequence for pedestrians struck by vehicle fronts and can occur regardless of the orientation of the pedestrian at impact. In very low speed impacts the pedestrian may be able to prevent head impact by active bracing using the arms. For moderate to high severity collisions, primary impact is followed by a further contact where the head and/or arms/shoulders are struck by the bonnet/windscreen area on the vehicle, and the pedestrian may then continue to rotate towards the roof. When the front of a passenger car strikes a side-facing adult pedestrian, the first contact is between the bumper and the knee region, see Fig. 24.3, which shows a 40 km/h staged pedestrian impact with a cadaver [35]. The following timings relate to this staged impact. Initially the struck-side leg is accelerated in the direction of vehicle travel. Due to inertia effects, the movements of the non-contacted body regions lag behind those of the struck region, facilitated by a combination of articulation in the joints, soft tissue deformation and bending of the long bones. The lower leg and foot on the struck side fold underneath the bumper and the non-struck leg remains still for at least 30 ms after initial vehicle contact. Similarly, the pelvis and the whole upper body remain almost horizontal for 40 ms, see Fig. 24.3.
By about 20 ms, there is contact between the bonnet leading edge and the pedestrian upper leg/pelvis on the struck side, the severity of which depends on the vehicle shape. Rotation of the upper body onto the bonnet then proceeds so that 120 ms after primary impact the torso has rotated sufficiently for the arm and shoulder on the struck side to contact the bonnet. The motion of the head initially lags behind the torso as its inertia causes lateral bending in the neck. However, the resulting lateral bending moment in the neck causes the head to “catch up” with the torso rotation and by about 120 ms the head contacts the vehicle in the region of the bonnet/windscreen/grille.
The length measured along the vehicle front profile from the ground to the pedestrian head impact location is the Wrap Around Distance WAD [36], which provides a useful measure of which vehicle front-end components contact the head in pedestrian/cyclist impacts. Taller pedestrians are twice as likely to have a head impact on the windscreen, while shorter ones are 50 % more likely to have a head impact on the bonnet [37]. In general, a low bonnet leading edge height results in the pedestrian being carried further onto the car and closer to the windshield [38].
24.1.6 Forward Projection
Forward projection occurs when the pedestrian centre of gravity is within the primary impact zone. This typically occurs where an adult is struck by a minivan or a truck, a small adult is struck by a large SUV or a child is struck by a passenger car, van, truck or an SUV. The location of first contact depends on the size of the struck body relative to the vehicle front, but subsequent contacts follow in very quick succession since the pedestrian is struck by an almost flat and vertical surface, see Fig. 24.4 [39]. As a result, the mid-body region is rapidly accelerated in the direction of vehicle travel with very little rotation so that the mid-body region and the vehicle attain an almost common post-impact velocity.
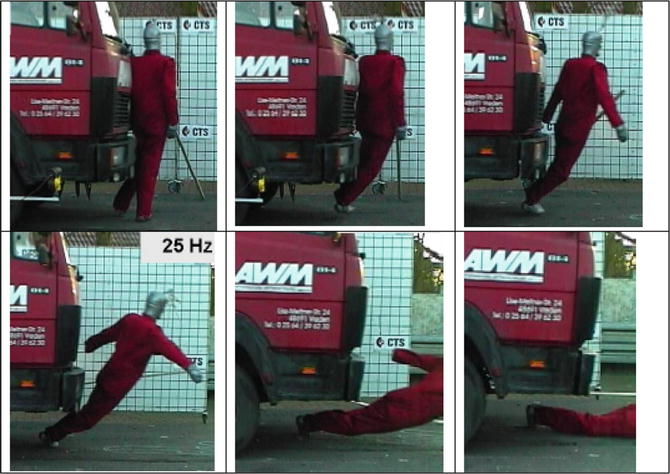

Fig. 24.4
Pedestrian forward projection kinematics: vehicle impact speed of 16.9 km/h against a stationary dummy [39]
Forward projection impacts occur provided the height of the vehicle’s front leading edge is above the pedestrian’s centre of gravity height. In such cases, the impact will be effectively concentric and the mid-body region and the vehicle front attain a common post-impact velocity. When the bonnet leading edge height is just below the body centre of gravity height, the resulting kinematics appear as a combination of wrap and forward projection.
24.1.7 Post Head Impact Kinematics for Forward and Wrap Projection Cases
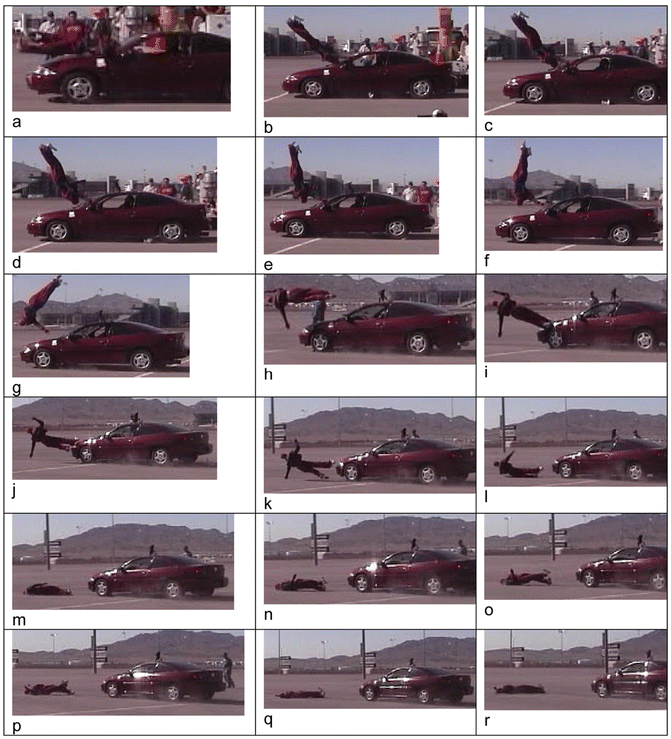
Figure 24.5 shows the results of a staged wrap projection impact of a stationary adult pedestrian dummy at 58 km/h [40]. Only the post head impact movement is shown. Evidence from this and other staged tests shows little restitution in the head impact [41], which therefore attains a common linear velocity with the bonnet/windscreen impact location immediately after head impact. The body then pivots about the head, either lifting the legs towards the roof in higher severity collisions or dropping the body back towards the bonnet due to gravity in lower severity collisions. The kinematic sequence depends mostly on the vehicle shape and impact speed, and the impact angle and angular velocity of the body at head impact.
Separation of the pedestrian from the vehicle following head impact in wrap projections marks the beginning of the airborne trajectory (Fig. 24.5), and the occurrence of this depends substantially on vehicle braking. In cases where the body does not drop back onto the bonnet, separation will occur if the vehicle is braking. However, in the subsequent somersault type movement of the body further contacts with the bonnet are possible if vehicle braking is insufficient. For forward projection, following separation from the vehicle due to braking, the body falls over and contacts the ground. In cases where the vehicle does not brake sufficiently following impact, the vehicle may run over the pedestrian. The contact with the ground is highly variable for both wrap and forward projection pedestrian impacts, and prediction of ground contact kinematics is very difficult. Nonetheless, high fronted vehicles lead to more severe head ground contact conditions [42, 43].
24.1.8 Vehicle Design Standards for Pedestrian Protection
The safety of pedestrians was not a serious consideration in vehicle design until the 1980s. This followed the belief that little could be done to protect pedestrians in the event of a vehicle impact [4, 7] but also by vehicle manufacturers’ reluctance to develop an area not governed by legislation and not considered to provide sufficient added value to the vehicle. In consequence, existing standards are relatively new and subject to updates and legal implementation is evolving. However, there is now substantial public appetite in many countries for the regulation of vehicle design for pedestrian safety, as evidenced by the introduction of pedestrian safety testing by consumer driven safety organizations such as the New Car Assessment Programmes operational in Europe, Japan and Australia.
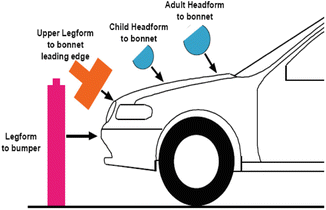
The main bodies who have developed pedestrian safety standards are Working Groups of the European Enhanced Vehicle Safety Committee (EEVC), the International Organization for Standardisation (ISO) and the International Harmonised Research Activities/United Nations Economic Commission for Europe (UNECE). The IHRA has now largely superseded the work of the ISO and their work has been followed by the development of a Global Technical Regulation (GTR) for pedestrian protection [44]. The tests proposed by the EEVC, ISO and the IHRA are all similar and are aimed at protecting pedestrians struck from the side by a vehicle at speeds up to 40 km/h, since this was judged to be the upper limit at which pedestrian protection could be achieved and over 80 % of pedestrian accidents are below this speed [15, 45, 46]. In all cases pedestrian subsystem impactor tests were developed in favour of pedestrian dummy tests, see Fig. 24.6. This is quite different to the full scale dummy tests stipulated in frontal impact vehicle occupant protection standards (e.g. FMVSS 208 [47]) and several arguments have been proposed to justify this, mostly relating to repeatability and dummy biofidelity. The principal goal of a subsystem impactor test is to reproduce the force interaction between the corresponding vehicle and pedestrian body parts, and provide an assessment of the resulting injury likelihood by comparison with accident or cadaver data. However, the choice of impactors in lieu of a whole-body dummy makes it almost impossible to determine the net change in pedestrian risk resulting from a specific vehicle design alteration [48].
The current EEVC legform, developed by the UK Transport Research Laboratory [50, 51], consists of two foam-covered rigid segments representing the upper and lower leg of a 50 percentile adult male connected by a simulated knee joint. It was designed to be propelled in free flight at 40 km/h against the vehicle bumper, and the knee lateral bending angle and shear displacement and upper tibia lateral acceleration are compared to tolerance thresholds derived from biomechanical testing, see Table 24.3.
Table 24.3
EURO-NCAP and GTR biomechanical thresholds for 40 km/h free flight adult headform impact to vehicle bumper
Knee bending angle (o) | Knee shear displacement (mm) | Tibia head acceleration (g) | |
|---|---|---|---|
EEVC | 15 | 6 | 150 |
GTR | 19 | 6 | 170 |
An alternative flexible legform impactor (FlexPLI) with a more biofidelic knee joint [52] (see Fig. 24.7) has been developed by the Japanese Automobile Manufacturers Association (JAMA) in collaboration with the Japanese Automobile Research Institute (JARI) [53]. The rigid TRL rather than the flexible FlexPLI legform has been chosen for the first phase of the GTR, but it is planned to introduce the FlexPLI in future. For the GTR a higher tolerance of 19° for lateral knee bending for the TRL impactor was adopted [44], see Table 24.3.
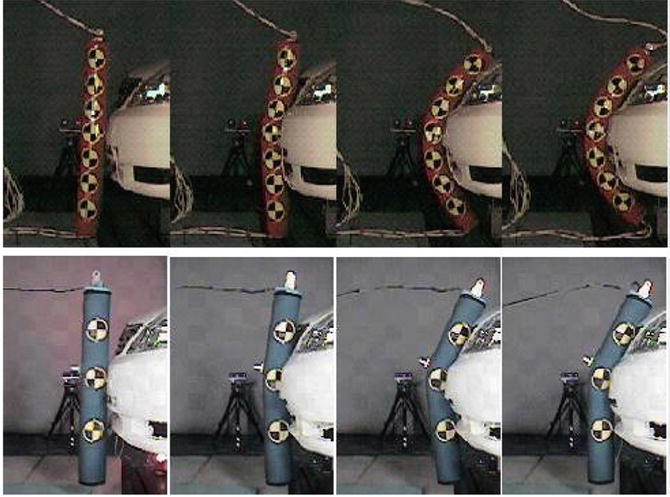

Fig. 24.7
Comparison of TRL and JAMA-JARI legforms in contact with a vehicle bumper showing increased flexibility of the JAMA-JARI prototype (Adapted from [54])
The EEVC has considered the isolated legform impactor test representative of a whole-body dummy test if the bumper impact occurs at or below the knee joint level (i.e. 500 mm or less above the ground) [55]. For vehicles with high bumpers, the bumper impacts the femur part of the legform impactor and the absence of the hip joint constraint and upper body mass can lead to rigid body rotation of the legform impactor without lateral bending of the knee [56, 57]. To account for this, the EEVC and GTR have allowed for an optional alternative horizontal upper legform to bumper test in cases where the bumper is located high and close to the bonnet leading edge [55]. However, the acceptance level for the EEVC upper legform test in this configuration is demanding (5 kN force and 300 Nm bending moment) and the EEVC have used this to discourage a design trend towards higher bumpers [58]. A comparison between the EEVC legform impactor test and staged tests using cadavers struck by a Peugeot 206 and a Renault Twingo showed that the critical bending moment proposed by the EEVC for the legform impactor is appropriate, but that the shear displacement threshold is not [59].
24.1.9 Upper Legform to Bonnet Leading Edge
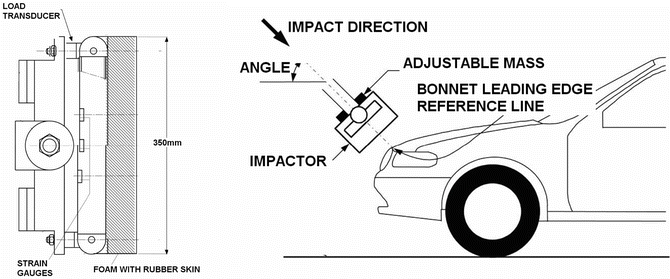
The bonnet leading edge contact with an adult pedestrian is mostly in the region of the femur [60], and the EEVC upper legform impactor represents a (shortened) segment of an adult femur [55], see Fig. 24.8. There are load cells at the upper and lower supports of the upper legform, and strain gauges measure the peak bending moment in the middle of the impactor. Staged tests using an adult dummy struck by instrumented car fronts [61] and multibody pedestrian models [62] showed that the effective mass, impact velocity and impact angle for the upper leg depend in a predictable manner on the shape of the vehicle front. This resulted in input parameters for the EEVC upper legform impactor test where the vehicle’s bonnet leading edge height and bumper lead are measured and look-up tables are used to define impactor velocity, impact angle and impact energy. The impact mass is then determined from the impact velocity and energy.
The biomechanical tolerance thresholds proposed for the impactor are intended to predict a 20 % risk of fractures of the femur and pelvis and the EEVC threshold values are 5 kN for the sum of impactor forces and a 300 Nm bending moment limit. Cadaver studies have shown that femur and pelvis injuries for impact energies below 200 J are insignificant and therefore no EEVC bonnet leading edge test is proposed for vehicles where the upper legform impact energy is less than 200 J. A recent comparison between the EEVC upper legform impactor test and staged tests using cadavers and multibody simulations showed that the upper leg impact angle and velocity in the EEVC specification are reasonably representative of real accidents for both a Peugeot 206 and a Renault Twingo [59]. However, the high incidence of spinal, thoracic and abdominal injuries in a sample of 80 pedestrian accidents highlights the types of serious injuries that are not addressed by the current subsystem testing protocols [63].
There is currently no GTR upper legform test for the bonnet leading edge, partly due to difficulties encountered with this test by the EEVC [58], where the streamlined shape of modern passenger cars has resulted in a substantial reduction in bonnet leading edge injuries [58]. However, data from the USA shows a large number of mid-body injuries have been found due to the prevalence of light trucks and vans, and a means to evaluate these is important [64].
24.1.10 Headform to Bonnet Top: Adult and Child
The EEVC and the ISO developed a child headform to assess child head injury risk from contact with the forward sections of the bonnet and an adult headform test to assess adult pedestrian injury risk from contact with the rear part of the bonnet, wings and scuttle. The EEVC headform tests are limited to the front of the vehicle up to and including the base of the windscreen, because these were the only areas that were thought feasible to improve [65]. Both the EEVC and ISO headforms are spherical and featureless to increase test repeatability and both have the same construction: a semi-rigid sphere, covered in a deformable rubber or foam “skin”. The impactors are designed to be propelled in free flight at 40 km/h at a predetermined angle against various portions of the bonnet top. The IHRA headform specifications are the same as for the ISO [66].
The EEVC adult headform has shown good correlation of the resultant acceleration time history by comparison with some cadaver tests [67]. In cadaver tests and computer simulations with a vehicle impact speed of 40 km/h, head impact velocities to the bonnet were reportedly 43–50 km/h, with the direction of impact approximately 65° to the horizontal [67]. Computer simulations also showed the head impact angle for adults to be circa 65° and 40–55° for children. However, the EEVC have recognized that head impact velocity varies substantially as a function of vehicle shape [55, 56] and the simplification of a fixed impact velocity for the headform test eliminates the influence of overall vehicle shape on head impact conditions. A recent comparison between the EEVC headform impactor test and cadaver tests with a Peugeot 206 and a Renault Twingo showed that the cadaver head impact velocity and the impact angle are generally lower than the EEVC specification [59]. Other cadaver tests have shown the velocity of head impact on the vehicle can be both higher and lower than the original vehicle impact velocity on the pedestrian [68–70], and these findings may be a function of pedestrian stature and vehicle shape.
The ISO/IHRA have proposed slightly different impactor specifications and impact conditions than the EEVC. The differences in the impactor masses are small, but there are substantial differences in the vehicle regions covered and in the prescribed impact conditions. For the EEVC tests, the child headform test area is bounded by Wrap Around Distances of 1,000–1,500 mm, while the adult headform test area is bounded by a WAD of 1,500–2,100 mm, unless the latter extends beyond the windscreen, in which case the lower windscreen frame forms the rear boundary of the test area. The EEVC test does not include the windscreen and only includes the windscreen frame if it lies within the specified WAD, even though the EEVC have accepted that most adult head impact locations are outside the zone considered by their test method [58]. Other tests, such as those of EuroNCAP, define different zones for testing on the vehicle [71].
The acceptance level for the EuroNCAP headform is now a Head Injury Criterion (HIC) score of 650. The HIC equation derives from power regression analysis of the Wayne State Tolerance Curve [72, 73] and the HIC is iteratively calculated from the resultant head centre of gravity acceleration ( ) time history in g units:
![$$ \begin{array}{l}HIC= max\left[\left[{t}_2-{t}_1\right]{\left[\left[\frac{1}{t_2-{t}_1}\right]{\displaystyle {\int}_{t_1}^{t_2}adt}\right]}^{2.5}\right]\;\\ {}\kern1.8em {t}_2-{t}_1\le 15 ms\end{array} $$](/wp-content/uploads/2016/09/A31137_3_En_24_Chapter_Equa.gif) All proposed tests only account for the linear acceleration of the headform via the HIC, and do not include rotational acceleration effects which are known to be significant for brain trauma such as diffuse axonal injuries [74]. However, a HIC value of 1,000 has previously been found to be a good indicator of serious head injury for real pedestrian cases involving adults and children [75] and it was concluded that there was insufficient data available to propose a separate robust HIC acceptance level for child protection [55].
All proposed tests only account for the linear acceleration of the headform via the HIC, and do not include rotational acceleration effects which are known to be significant for brain trauma such as diffuse axonal injuries [74]. However, a HIC value of 1,000 has previously been found to be a good indicator of serious head injury for real pedestrian cases involving adults and children [75] and it was concluded that there was insufficient data available to propose a separate robust HIC acceptance level for child protection [55].
 ) time history in g units:
![$$ \begin{array}{l}HIC= max\left[\left[{t}_2-{t}_1\right]{\left[\left[\frac{1}{t_2-{t}_1}\right]{\displaystyle {\int}_{t_1}^{t_2}adt}\right]}^{2.5}\right]\;\\ {}\kern1.8em {t}_2-{t}_1\le 15 ms\end{array} $$](/wp-content/uploads/2016/09/A31137_3_En_24_Chapter_Equa.gif)
For the GTR, child and adult headform tests at 35 km/h are defined. The threshold HIC score for the bonnet or windscreen is 1,000 and the windscreen frame and A-pillars are excluded from the test zone [64]. The reason for this exclusion is that it was considered that the A-pillar stiffness requirements for vehicle rollover protection preclude reduction of HIC scores for pedestrian head impact against the A-pillars. For the windscreen, it has been argued that the low HIC scores for mid-windscreen contacts mean that the advantages of including the windscreen in the test would be minimal [76]. However, the windscreen is responsible for many head injuries and the potential for improved windscreen design will be addressed later in this chapter.
While current tests have the capacity to assess the effectiveness of active features such as pop-up hoods and bonnet airbags (see later sections), they cannot assess the effect active features such as brake assist and autonomous braking. In the near future, tests will therefore need to be designed to assess the effectiveness of integrated active and passive safety features for pedestrian safety.
24.1.11 Implementation into Legislation
Pedestrian safety legislation varies considerably in different jurisdictions and developments are ongoing. In the United States, there is no legislation. In the EU, the EEVC pedestrian legform and headform impactor tests have been included in a European Directive [77] which is in place since 2005. Japan introduced pedestrian regulations also in 2005 for head protection. Japan and Korea will introduce the GTR in 2013.
24.1.12 The Influence of Vehicle Design on Pedestrian Injuries
The principles governing the individual influences of vehicle shape and stiffness on pedestrian injuries are relatively straightforward and can be summarized by Ashton’s statement in 1979 that a smooth and compliant front profile may reduce overall pedestrian injury severity [6]. The three main vehicle related considerations for pedestrian and cyclist injuries are mass, shape and stiffness. Vehicle mass will first be shown not to be very significant. In contrast, vehicle stiffness will be seen from first principles to be a fundamental parameter for pedestrian and cyclist injury and the importance of vehicle shape will also be demonstrated since this determines the impact locations of the vehicle surfaces on the body. Furthermore, it will be seen that shape influences the energy associated with each impact, while stiffness determines the corresponding force. Therefore shape and stiffness combine to determine injury likelihood for pedestrians when struck by a particular vehicle type.
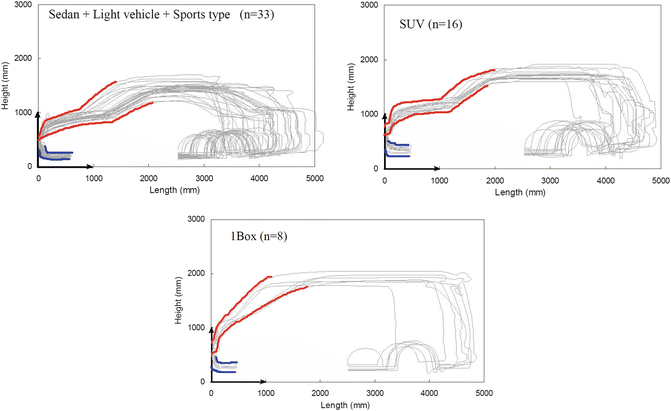
There are hundreds of vehicle types which can be potentially involved in a pedestrian accident. These include cars, buses, vans, sport utility vehicles and trucks and significant variations are found even within these categories, see Fig. 24.9.
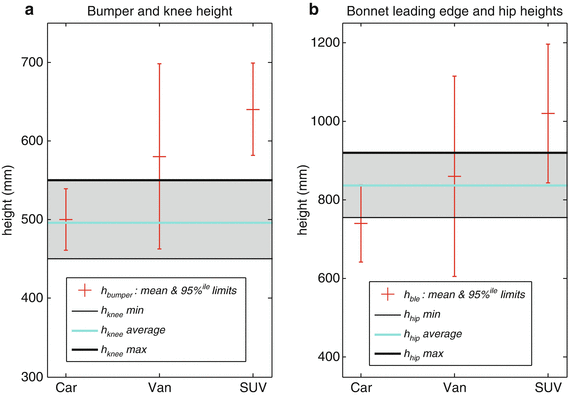
Snedeker et al. [78] published average bumper height, bonnet leading edge height and bumper lead for cars, SUVs and vans, see Table 24.4. Great variations in commercial truck sizes are found and these are therefore not included here. There are also significant differences in pedestrian stature with age, gender and ethnicity, nutrition etc., see Fig. 24.10 [79].
Height above ground | Car (mm) | Van (mm) | SUV (mm) |
|---|---|---|---|
Bumper height | 500 | 580 | 640 |
Bumper lead | 140 | 160 | 140 |
Bonnet leading edge | 740 | 860 | 1,020 |
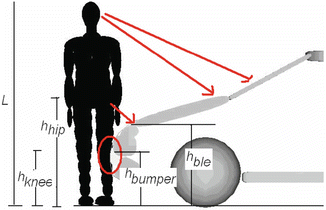
The bumper typically strikes the lower limbs, while the bonnet leading edge strikes in the region of the hip and head impact subsequently occurs on with either the bonnet top or the windscreen area, see Fig. 24.11.
Therefore, a comparison of bumper height  with knee height
  and bonnet leading edge height
  with hip height
  for the different vehicle classes is instructive, see Fig. 24.10. The average and 95 percentile limits are given for the adult knee and hip heights as well as for the bumper and bonnet leading edge for each vehicle type [78]. The variability in bonnet leading edge height for vans means that there are cases where contact occurs both above and below the hip height, depending on pedestrian stature.
 with knee height
  and bonnet leading edge height
  with hip height
  for the different vehicle classes is instructive, see Fig. 24.10. The average and 95 percentile limits are given for the adult knee and hip heights as well as for the bumper and bonnet leading edge for each vehicle type [78]. The variability in bonnet leading edge height for vans means that there are cases where contact occurs both above and below the hip height, depending on pedestrian stature.
24.1.13 Influence of Vehicle Mass
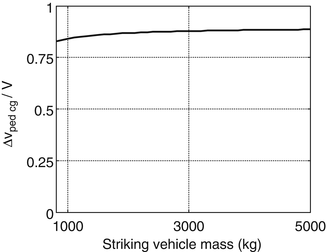
It can be shown from fundamental considerations that the mass difference between most motorized vehicles and pedestrians is sufficiently large to make the considerable mass disparity between different vehicle types striking pedestrians and cyclists largely insignificant. For example, consider a pedestrian modeled as a rigid rod struck by the bonnet leading-edge (ignoring the bumper contact) of vehicles of the same shape but ranging in mass from 800 to 5,000 kg. Assuming a common post-impact velocity at the impact location, and a vertical height difference ( ) between the pedestrian cg and the bonnet leading edge of 0.15 m, the ratio of pedestrian centre of gravity velocity change (Δ
 ) to vehicle impact velocity (
 ) can be used as a crude measure of impact severity normalised with respect to the vehicle impact speed [11], and Fig. 24.12 shows the very low sensitivity of this ratio to striking vehicle mass over the large mass range considered.
 ) between the pedestrian cg and the bonnet leading edge of 0.15 m, the ratio of pedestrian centre of gravity velocity change (Δ
 ) to vehicle impact velocity (
 ) can be used as a crude measure of impact severity normalised with respect to the vehicle impact speed [11], and Fig. 24.12 shows the very low sensitivity of this ratio to striking vehicle mass over the large mass range considered.
Fig. 24.12
Ratio of pedestrian centre of gravity velocity change (Δ ) to collision velocity (
 ) estimated using momentum conservation and a single segment pedestrian representation [11]
 ) to collision velocity (
 ) estimated using momentum conservation and a single segment pedestrian representation [11]
This indicates that the substantial mass difference between passenger cars (mean mass 1,275 kg) and heavier vehicles such as SUVs (mean mass 1,625 kg [80]) and even larger trucks does not greatly influence pedestrian injury risk. A similar result was obtained with detailed Madymo multibody modeling [81] and analysis of accident data [24, 25], and it can be concluded that mass variation alone is not a very important vehicle design parameter for pedestrian protection.
24.1.14 Influence of Vehicle Stiffness
The stiffness of the vehicle structure significantly influences pedestrian injury severity. This is obvious from the fundamental relationship between maximum crush ( ) and mean acceleration (
 ) for the idealised case of a plastic, concentric impact between a vehicle mass
  striking a pedestrian mass
  at a velocity
![$$ \overline{a}=\frac{1}{2}\frac{V^2}{d_{\max }}\left[\frac{M}{M+m}\right] $$](/wp-content/uploads/2016/09/A31137_3_En_24_Chapter_Equb.gif) This equation shows that impact severity assessed by mean acceleration
This equation shows that impact severity assessed by mean acceleration  increases with the square of the impact velocity for a fixed crush depth, and is inversely proportional to deformation for a fixed impact velocity. Therefore, maximizing crush depth and minimizing impact speed are essential for pedestrian and cyclist protection.
 ) and mean acceleration (
 ) for the idealised case of a plastic, concentric impact between a vehicle mass
  striking a pedestrian mass
  at a velocity
![$$ \overline{a}=\frac{1}{2}\frac{V^2}{d_{\max }}\left[\frac{M}{M+m}\right] $$](/wp-content/uploads/2016/09/A31137_3_En_24_Chapter_Equb.gif)
 increases with the square of the impact velocity for a fixed crush depth, and is inversely proportional to deformation for a fixed impact velocity. Therefore, maximizing crush depth and minimizing impact speed are essential for pedestrian and cyclist protection.
The distribution of vehicle stiffness has recently been determined from analysis of EuroNCAP pedestrian impactor tests [82]. Results from 425 tests were divided into categories according to headform HIC score and legform shear force and bending moment. The categories were coded green for good, red for poor and yellow for intermediate, and the mean and ±1 standard deviation force versus deformation corridors were derived. The results for the bumper, bonnet (front, middle and rear) and windscreen base are shown in Fig. 24.13. Significant differences between vehicle regions and vehicle types are present, and therefore the current vehicle fleet presents a broad range of pedestrian and cyclist injury risk based on stiffness alone. Not surprisingly, therefore, adjusting the stiffness of a small production car without influencing the styling showed that substantial improvements could be made to the EEVC test results scores [83].
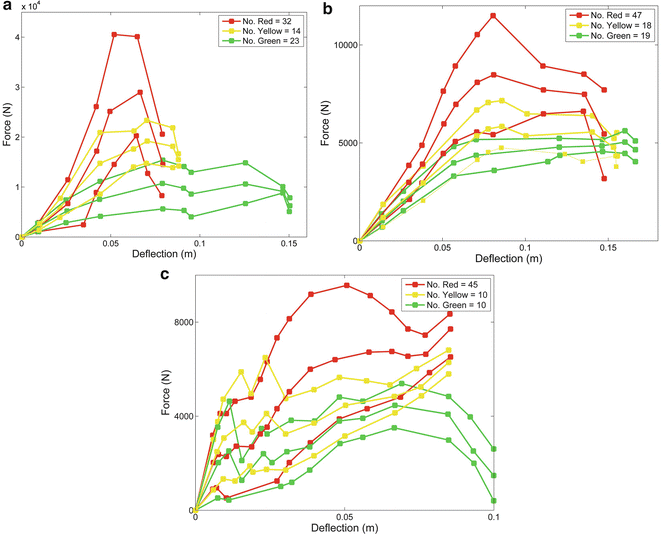

Fig. 24.13
Mean and  1 standard deviation stiffness plots for (a) the bumper, (b) bonnet front and (c) windscreen base derived from EuroNCAP pedestrian impactor tests (Adapted from [82]): colours represent vehicle rating: green = good, red = poor, yellow is intermediate
 1 standard deviation stiffness plots for (a) the bumper, (b) bonnet front and (c) windscreen base derived from EuroNCAP pedestrian impactor tests (Adapted from [82]): colours represent vehicle rating: green = good, red = poor, yellow is intermediate
24.1.15 Influence of Overall Vehicle Shape
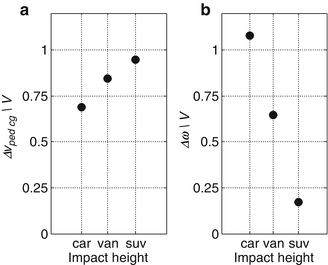
Vehicle shape relative to pedestrian height determines which body regions are struck and the impact energy associated with each body region impact. We have seen that there are major differences in injury patterns for different classes of vehicle. The bonnet surface and windshield are the most important injury inducing contact regions for passenger vehicles, while for light trucks and vans (including SUVs) the main injury sources are the bonnet surface and the bonnet leading edge. Vehicle shape is substantially dependent on vehicle class and the majority of vehicles striking pedestrians can be broadly classified as cars, SUVs and trucks/vans. Using the mean dimensions for cars, SUVs and vans ([78]), the conservation of momentum applied to a single segment pedestrian model can again be used to predict the generalized momentum transfer in the primary vehicle impact associated with different vehicle shapes. As a first approximation when assessing overall pedestrian kinematics as a function of vehicle class, it is reasonable to consider the bumper and bonnet leading edge contacts as a single contact occurring at the average height of the bumper and bonnet. Assuming as before a 50th percentile male mass and height, a mean car mass of 1,265 kg and mean SUV/van masses of 1,625 kg, the relative severity of the primary impact for each of the vehicle types can be assessed by considering the linear and angular post impact velocities of the pedestrian segment. The centre of gravity linear velocity (Δ ) normalised by vehicle impact speed (
 ) and the normalized body angular velocity change (Δω) can then be found using conservation of momentum [11] and these kinematic quantities are a measure of the linear and angular impulse transmitted to the struck pedestrian and their variation for the average impact height of cars, vans and SUVs are shown in Fig. 24.14. This approach clearly shows that the lower impact height of cars results in a significantly lower linear impulse in the primary impact compared to SUVs, but this is accompanied by a significantly higher angular impulse for car impacts compared to SUVs.
 ) normalised by vehicle impact speed (
 ) and the normalized body angular velocity change (Δω) can then be found using conservation of momentum [11] and these kinematic quantities are a measure of the linear and angular impulse transmitted to the struck pedestrian and their variation for the average impact height of cars, vans and SUVs are shown in Fig. 24.14. This approach clearly shows that the lower impact height of cars results in a significantly lower linear impulse in the primary impact compared to SUVs, but this is accompanied by a significantly higher angular impulse for car impacts compared to SUVs.