Fig. 1.
Haddon matrix.
Personal factors (psychophysical preparation);
Vector or Agent Factors (materials and opponent);
Physical Environmental factors (meteorological and environmental analysis). Hereafter the “Physical Environmental factors” will be called “environmental parameters” and they will be referred to meteorological parameters (i.e.: air temperature, air humidity, wind, rain, etc.…) that affect the sport performance;
Socio-environmental factors (of internal and external social environment).
Focusing on Fig. 1, and in particular on the column “Physical – Environmental Factors”, it is evident how different methodologies have to be used for the analysis of the environmental parameters during the different temporal phases of a specific sport event. During the pre-event phase a climatological and statistical analysis proves to be the most suitable. On the other hand, during the event, a deterministic forecast methodology, associated with very short-term numerical weather prediction models, is suggested. Finally, in the post-event phase meteorological measurements can be used, if available, for refining the performance analysis.
If the environmental parameters are not taken into account, one column would be missing within the Haddon matrix and hence an error would be produced using the performance assessment model.
The importance of Environmental Analysis for sport performance is often underestimated by coaches and sport managers. This is mostly due to the lack of knowledge about the added value brought by innovative techniques for both measuring and predicting environmental parameters.
The different time-scales for conducting a proper environmental analysis and a weather forecasting, during a general sport event, can be divided as follows:
This subdivision, and the related weather forecasts, have to be used with regard to the possibilities offered by each Sports’ Rule for what concerns the use of meteorological information.
Long term (up to 30 days before the event);
Medium term (from 30 days before the event to 8 days before the event);
Short term (from 8 days to 6 h before the event);
Very short term (from 6 h before the event until the ‘action’).
With this kind of meteorological analysis, and according to the Haddon matrix, a proper assessment of the environmental parameter is assured.
A series of in-depth focus groups conducted with different stakeholders (athletes, coaches, managers, performance analysts) coming from the main National Sports Federations of the Italian Olympic Committee (CONI) has allowed to estimate the importance of meteorological variables and the impact of different lead-time weather forecasts on the general performance, for several sports [13, 14].
In particular the following disciplines have been analyzed:
Cycling: road;
Rowing;
Canoe and Kayak;
Athletics: Marathon and Race Walks;
Modern Pentathlon;
Equestrian Sports;
Tennis;
Archery;
Shooting Sports;
Triathlon;
Sailing.
2.2 Computer Supported Training
The prototype software is able to load the training data (e.g.: time, position and heart rate) monitored by specific tools that are widely used even among non-professional practitioners (Garmin, Polar, Suunto, etc.). The software tool is also able to load the meteorological data, or other environmental data, measured by one or more monitoring stations of interest. Other important data to analyze are those monitored on the athlete, such as for example his/her skin temperature or humidity [5]. These last data are important when testing the features of particular clothing. All the above mentioned data are generally measured in different positions and in different times. In order to carry out the analysis all the external data must be time interpolated to get them on the same times at which the performance is available (synchronization process).
In a similar way, when the meteorological data are measured by more than one station, a spatial interpolation is needed to estimate the values at the same positions where the performance has been registered. There are situations where it is not correct to perform the spatial interpolation, in such cases it is possible to indicate a radius of influence of each station, or to define areas of competence of each monitoring stations.
Of course the spatial interpolation may be more reasonable in some situations than in other ones. For example, if N stations are measuring wind speed and direction during a sailing race over a relative small water surface, the spatial interpolation is more than reasonable. On the other hand, if the same number of stations is measuring the same variables during a cycling race over a mountain region, the simple spatial interpolation might not be reasonable. In such cases a diagnostic meteorological model (e.g. CALMET) would do a better work, but it cannot be easily incorporated in a software as the one described here.
For other variables, such as temperature, specific algorithms are available to carry out spatial interpolation even in complex terrain [15]. Indeed, air temperature at the ground depends on some variables, such as altitude above sea level, air temperature vertical gradient and land cover type. The interpolation of sparse measurements of temperature over the domain should account for these parameters.
Other meteorological variables are calculated by the software if not available among the measurements. For example, solar radiation can be estimated starting from the geographic location of the athlete, which depends on the time, and on cloud cover, which can be obtained, for example, from METAR (Meteorological Aerodrome Report) data.
The software is developed with .NET framework 3.5 in Visual Basic language. The cartographic layers has to be found by an Open Access map to be used freely by the Coaches and the Athletes. The Open Street map [16] is an efficient GIS data that can be integrated into the sports performance software.
2.3 Case Study: Cycling
Considering the contents of the two previous paragraphs, it has been decided to apply the environmental analysis to a sport which is particularly influenced by the environmental conditions. For these reasons the sport of cycling has been chosen since, as it will be shown later in this paper, it is strongly influenced both by environmental conditions and by weather conditions.
In order to carry out the tests, whose results have been analyzed with the computerized methodology described in Sect. 2.2, the protocol developed by Pezzoli et al. [5] has been applied. Particular attention has been given to the following topics:
An high-precision anemometer (JDC – SKYWATCH Geos 11) was used; this tool has already proved extremely performing in the application of meteorology to sport [5]. The meteorological variables have been used to calculate the apparent temperature index. Considering the studies of Leung et al. [17] and Robaa [18] it has been decided to use the NET index, which is more complete of the Heat Index (HI) and of the Windchill (WC) because it is also a function of wind speed, in addition to air temperature and relative humidity.
Study of the test course. It has been decided to carry out the tests on an oval track, in order to keep constant some important variables (altitude, slope, etc.) and to avoid the introduction of possible bias factors. In this way the repeatability of the test conditions has been guaranteed, making comparable the results obtained in the different test sessions. The tests have been carried out on the circuit of San Francesco al Campo, Turin, Piedmont, Italy (Fig. 2).
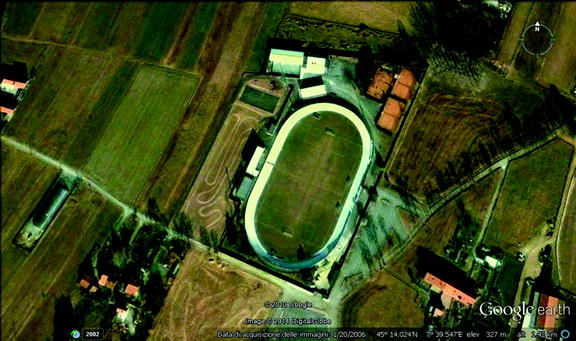
Fig. 2.
Track of San Francesco al Campo, Turin – Piedmont – Italy.
Environmental analysis of the race course. The tests took place on 2 September 2013, from 10:25 LT to 11:55 LT, and all the environmental parameters have been measured during this time interval. The following meteorological variables have been measured in continuous with a sampling rate of 1′:
(a)
Wind direction and speed;
(b)
Air temperature;
(c)
Relative humidity;
(d)
Atmospheric pressure.
Finally the temperature of the track surface has been measured in continuous with a sampling time of 15″ by means of a thermocouple recording thermometer model JDC – Center 306.
Research of a target athlete and of clothing for the test. It has been decided to work with a single professional athlete, belonging to a high-level elite, capable to guarantee the perfect reproducibility of the tests. Two different typologies of clothing have been compared in order to verify that the described protocol, and the software, are capable to give reliable results with respect to the expected results:
(a)
“Infrared Carbon” short-sleeved shirt and shorts, manufactured by B-Emme;
(b)
Ceramic short-sleeved shirt and shorts, manufactured by B-Emme.
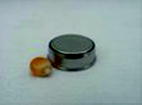
Performance analysis. The aim of this analysis is to detect the different values of power expressed by athletes in different test conditions and consequently to evaluate the internal heat production expressed in Watt (W). During this phase the following parameters have been constantly registered: power, speed, cadence of pedaling, slope of the road and heart rate. The power and the related internal heat production have been measured using the PowerTap system. To measure the skin temperature, it was decided to use the iButtons, small sensors constituted by a chip enclosed in stainless steel which is 16 mm thick (Fig. 3). Due to its very small size, the instrument can be easily applied to the skin of the tester without interfering with the movement or the technical gesture. The iButton can be mounted virtually anywhere because it is rugged enough to withstand harsh environments (indoors or outdoors). It has many application fields, lately it has also been used in different sports for the measurement of environmental parameters [19]. Six iButtons have been used, placed in pairs on the right and on the left of the following muscles: pectorals, lumbar, and dorsal.
Related posts:
 for Sharing Good Practices in Sport Management
 and UI Design for Ergonomic Heart Rate Monitoring in Endurance Sports: Realizing an Improved Tool for Health and Sports Activities on Base of Android Smartphone Programming and ANT+
 of Mobile Technologies in the Preparations for Long Distance Running
 the Sensorimotor Training Using Wireless Sensors: Studying the Effects of Balance Boards with Different Dimensions of Instability
 Soccer Ball Detection in Difficult Situations
 Peloton Dynamics in Competitive Cycling: A Quantitative Approach

Stay updated, free articles. Join our Telegram channel

Full access? Get Clinical Tree


