Chapter 44 Nutritional Medicine
 Evolutionary Aspects in Human Nutrition
Although the human gastrointestinal tract is capable of digesting both animal and plant foods, a number of physical characteristics indicate that Homo sapiens evolved to primarily digest plant foods. Specifically, our teeth are composed of 20 molars, which are perfect for crushing and grinding plant foods, along with eight front incisors, which are well suited for biting into fruits and vegetables. Only our front four canine teeth are designed for meat eating. Our jaws swing both vertically to tear and laterally to crush, but carnivores’ jaws swing only vertically. Additional evidence that supports the body’s preference for plant foods is the long length of the human intestinal tract. Carnivores typically have a short bowel, and herbivores have a bowel length proportionally comparable to that of humans. Thus, the human bowel length favors plant foods.1
A Look at Our Closest Wild Relatives
To answer the question, “What should humans eat?” many researchers look to other primates, such as chimpanzees, monkeys, and gorillas. Nonhuman wild primates are also omnivores or, as often described, herbivores and opportunistic carnivores. They eat mainly fruits and vegetables, but may also eat small animals, lizards, and eggs if given the opportunity. Only 1% and 2%, respectively, of the total calories consumed by gorillas and orangutans are animal foods. The remainder of their diet is from plant foods. Because humans are between the weights of the gorilla and orangutan, it has been suggested that humans are designed to eat around 1.5% of their diet as animal foods.2 Most Americans derive well over 50% of their calories from animal foods.
Wild primates fill up not only on fruit but also on other highly nutritious plant foods. As a result, wild primates weighing one tenth as much as a typical human ingest nearly 10 times the level of vitamin C and much higher amounts of many other vitamins and minerals. Other differences in the wild primate diet are also important to point out, such as a higher ratio of α-linolenic acid, the essential ω-3 fatty acid, to linoleic acid, the essential ω-6 fatty acid2 (Table 44-1).
TABLE 44-1 Estimated Mineral Intakes of Wild Monkeys and Humans
| MINERAL | TOTAL DAILY INTAKE OF 7-kg ADULT MONKEY (mg) | RECOMMENDED DAILY ALLOWANCE FOR 70-kg MAN (mg) |
|---|---|---|
| Calcium | 4571 | 800 |
| Phosphorus | 728 | 800 |
| Potassium | 6419 | 1600-2000 |
| Sodium | 182 | 500 |
| Magnesium | 1323 | 350 |
| Iron | 38.5 | 10 |
| Manganese | 18.2 | 2.0-5.0 |
| Copper | 2.8 | 1.5-3.0 |
Hunter–Gatherer Diets
Data from anthropologists looking at hunter–gatherer cultures provide much insight as to what humans are designed to eat; however, it is very important to point out that these groups were not entirely free to determine their diets. Instead, their diets were molded by what was available to them. For example, the diet of the Inuit Eskimos is far different from that of the Australian aborigines. It may not be appropriate to answer the question, “What should humans eat?” simply by looking at these studies. Nonetheless, it is important to point out that regardless of whether hunter–gatherer communities relied on animal or plant foods, the rate of diseases of civilization, such as heart disease and cancer, is extremely low in such communities.3
It should also be pointed out that the meat that our ancestors consumed was much different from the meat found in supermarkets today. Domesticated animals have always had higher fat levels than their wild counterparts, but the desire for tender meat has led to the breeding of cattle that produce meat with a fat content of 25% to 30% or more, compared with less than 4% for free-living animals and wild game. In addition, the type of fat is considerably different. Domestic beef contains primarily saturated fats and virtually undetectable amounts of ω-3 fatty acids. In contrast, the fat of wild animals contains more than five times more polyunsaturated fat per gram and has a good amount of beneficial ω-3 fatty acids (approximately 4%).4
Considerable evidence indicates that a high intake of red or processed meat increases the risk of mortality. For example, in a cohort study of half a million people aged 50 to 71 years at baseline, men and women in the highest versus lowest quintile of red and processed meat intake had elevated risks for overall mortality.5
In another prospective cohort study, subjects were followed from 1980 (women) or 1986 (men) until 2006. Low-carbohydrate diets, either animal-based (emphasizing animal sources of fat and protein) or vegetable-based (emphasizing vegetable sources of fat and protein), were computed from several validated food-frequency questionnaires assessed during follow-up.6 A low-carbohydrate diet based on animal sources was associated with higher all-cause mortality in both men and women, whereas a vegetable-based, low-carbohydrate diet was associated with lower all-cause and cardiovascular disease mortality rates.
The Pioneering Work of Burkitt and Trowell
Much of the link between diet and chronic disease originated from the work of two medical pioneers, Denis Burkitt, MD, and Hugh Trowell, MD, authors of Western Diseases: Their Emergence and Prevention, first published in 1981.7 Although now extremely well-recognized, their work is actually a continuation of the landmark work of Weston A. Price, a dentist and author of Nutrition and Physical Degeneration. In the early 1900s, Dr. Price traveled the world observing changes in teeth and palate (orthodontic) structure as various cultures discarded traditional dietary practices in favor of a more “civilized” diet. Price was able to follow individuals as well as cultures over 20 to 40 years and carefully documented the onset of degenerative diseases as their diets changed. On the basis of extensive studies examining the rate of diseases in various populations (epidemiologic data) and his own observations of primitive cultures, Burkitt formulated the following sequence of events:
First stage. In cultures consuming a traditional diet consisting of whole, unprocessed foods, the rate of chronic diseases like heart disease, diabetes, and cancer is quite low.
Second stage. Commencing with eating a more “Western” diet, there is a sharp rise in the number of individuals with obesity and diabetes.
Third stage. As more and more people abandon their traditional diet, conditions that were once quite rare become extremely common. Examples are constipation, hemorrhoids, varicose veins, and appendicitis.
Fourth stage. Finally, with full westernization of the diet, other chronic degenerative or potentially lethal diseases, such as heart disease, cancer, osteoarthritis, rheumatoid arthritis, and gout, become extremely common.
Since Burkitt and Trowell’s pioneering research, a virtual landslide of data has continually verified the role of the Western diet as the key factor in virtually every chronic disease, especially obesity and diabetes. Box 44-1 lists diseases with convincing links to a diet low in plant foods. Many of these now common diseases were extremely rare before the twentieth century.
 Trends in U.S. Food Consumption
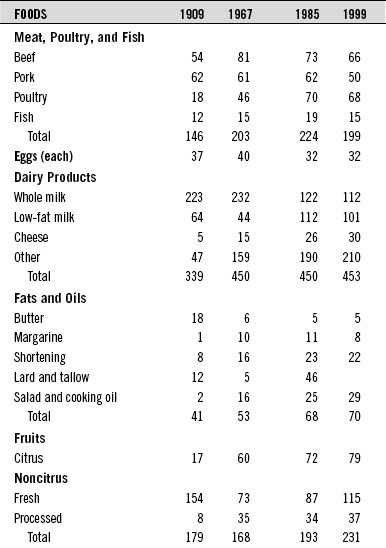
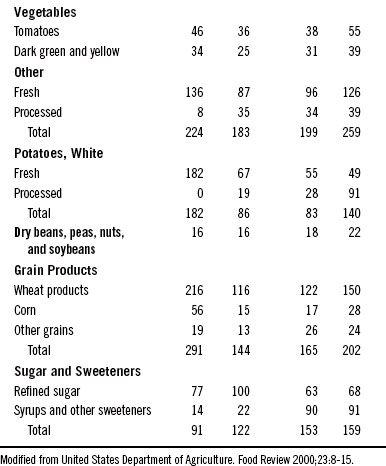
During the twentieth century, food consumption patterns changed dramatically (Table 44-2). Total dietary fat intake rose from 32% of the calories in 1909 to 43% by the end of the century. Overall carbohydrate intake dropped from 57% to 46%, and protein intake remained fairly stable at about 11%.
 The Government and Nutrition Education
1. The Milk Group: milk, cheese, ice cream, and other milk-based foods
2. The Meat Group: meat, fish, poultry, eggs, with dried legumes and nuts as alternatives
3. The Fruit and Vegetable Group
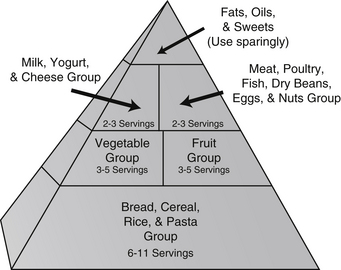
In an attempt to create a new model in nutrition education, the USDA first published the “Eating Right Pyramid” in 1992. It received harsh criticisms from numerous experts and other organizations. One big question that should be asked is, “Is it appropriate to have the USDA making these recommendations?” After all, the USDA serves two somewhat conflicting roles: (1) it represents the food industry, and (2) it is in charge of educating consumers about nutrition. Many people believe that the pyramid was weighted more toward dairy products, red meat, and grains because of influence from the dairy, beef, and grain farming and processing industries. In other words, the pyramid was designed not to improve the health of Americans but rather to promote the USDA agenda of supporting multinational agrifoods giants (Figure 44-1).
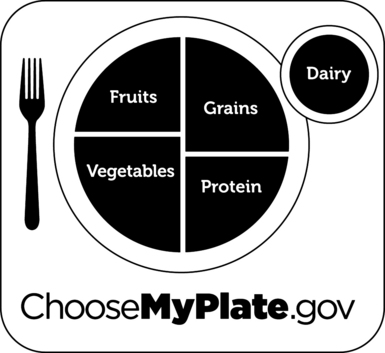
On June 2, 2011 the USDA unveiled a new food icon, MyPlate, to replace the food pyramid (see Figure 44-2). This simplified illustration is designed to help Americans make healthier food choices. MyPlate is the first step in a multi-year effort to raise awareness and educate consumers of eating more healthfully. The initial launch came with some simple recommendations:
Hopefully, this new campaign will be more successful than prior efforts. And, hopefully, the program will not yield to political pressure, and focus on communicating important nutritional guidance (Figure 44-2).
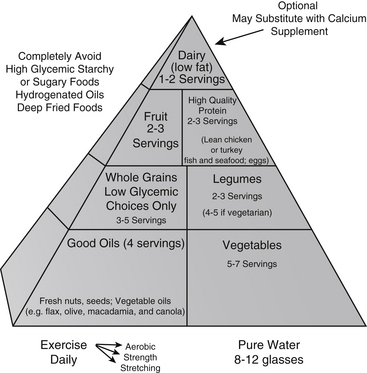
 The Optimal Health Food Pyramid
On the basis of existing evidence we have created The Optimal Health Food Pyramid (Figure 44-3). The major difference from the USDA pyramid is that the Optimal Health Food Pyramid incorporates the best of two of the most healthful diets ever studied—the traditional Mediterranean diet (see later) and the traditional Asian diet. In addition, the Optimal Health Food Pyramid more clearly defines what the healthy components within the categories are and stresses the importance of vegetable oils and regular fish consumption as part of a healthful diet. Appendix 8 provides a patient handout that clearly defines the components of the Optimal Health Food Pyramid.
Stay updated, free articles. Join our Telegram channel

Full access? Get Clinical Tree


