Variable
Normalizing factor
Force
Two-thirds root of the ratio of mass of PMHS to reference mass
Deflection
Cube root of the ratio of mass of PMHS to reference mass
Acceleration
Cube root of the ratio of reference mass to mass of PMHS mass
Time
Cube root of the ratio of mass of PMHS to reference mass
Moment
Ratio of mass of PMHS to reference mass
26.2.1.2 Applications
Early applications of this method involved normalization of seatbelt forces from frontal impact tests wherein the total body mass ranged from 36 to 102 kg, thus making a strong case for normalization of data [12]. A later application consisted of normalizing data from 49 PMHS side impact tests with a range of velocities and boundary/contact conditions, and these studies formed a basis for the Thoracic Trauma Index metric, used in the first US side impact regulations, promulgated in 1990 [13]. The equal stress equal velocity method has also been used in recent side impact studies for applications to the mid-size ES-2re and small-size SID-IIs dummies in the United States [14]. Forty-two PMHS sled tests conducted at the Medical College of Wisconsin were used to normalize data to the standard mass of the two different dummies, representing the mid-size male and small female [4, 5, 15]. The latest update of the FMVSS-214 standards incorporates analyses of data from these recent experiments [16]. Other applications include normalizing side impact sled test results to small-size female dummy mass to extract acceleration, force and deflection responses in an attempt to evaluate the biofidelity of fifth-percentile dummies [17]. Yoganandan et al. adopted this approach to determine the force-time histories from oblique side impact PMHS sled tests wherein data were obtained from load cells attached to anthropometry-specific modular load wall.
26.2.2 Impulse Momentum Approach
To determine region-specific normalizing factors, this approach uses specific body region/segmental characteristics and it also accounts for the type of the impact test [18]. Mass and stiffness ratios are used along with assumptions of lumped mass and spring models. Sled tests and whole body free fall/drop tests are treated as one degree of freedom and pendulum tests are treated as two-mass spring systems.
26.2.2.1 One Degree of Freedom Model
This method is explained using lateral impact PMHS sled tests, described in detail in the chapter on thorax injury biomechanics. The purpose of segmentation of load-walls in a side impact sled test is to isolate the loads and kinematics of body regions. Tests with a segmented wall accommodating thorax, abdomen and pelvic load plates enable a portion of the total body mass of the PMHS to load the respective plate. Body-region specific effective mass properties are computed as the ratio of the impulse of the respective load plates to the impact velocity. The impulse is computed from time-zero to the time at which the velocity reaches the sled velocity. The effective body region-specific mass ratio is defined as the ratio of the effective mass to the total body mass of each subject. The average of the effective mass ratios for the entire ensemble tested using the same experimental design is determined for each body region. To determine the standard effective mass of each PMHS for the specific body region, the average effective mass ratio is multiplied by the mass of the reference. The mass ratio factor for each subject is defined as the ratio of the reference effective mass of the body region to the effective body-region specific mass of each subject, determined above. The stiffness ratio factor for each subject can be obtained as the ratio of a characteristic length of the body region of the reference (example, right to left lateral distance of the thorax of the mid-size male dummy) to the same measurement from each PMHS. This is termed as the characteristic length approach. If the length is unknown, extending the assumption of geometric similitude to the total body, the stiffness ratio may be estimated using the cube root of the body mass ratios of the standard surrogate and each PMHS. The normalized force, deflection, acceleration and time are obtained using the standard stiffness and mass ratio factors (Table 26.2). Another method of determining the stiffness factor includes the use of the force and deflection from each PMHS test and this is described later.
Table 26.2
Normalizing factors for the impulse momentum method using the one degree of freedom model
Variable | Normalizing factor |
|---|---|
Force | Square root of the product of mass and stiffness factors |
Deflection | Square root of the ratio of mass to the stiffness factor |
Acceleration | Square root of the ratio of stiffness to the mass factor |
Time | Square root of the ratio of mass to the stiffness factor |
26.2.2.2 Two Degrees of Freedom Model
Data from tests with a pendulum wherein an impactor is attached to the forward facing end of the device and the impactor delivers the dynamic load to a specific region of the human body (example, shoulder) can be normalized using this model. The mass and acceleration of the impactor are used to determine the force applied to the PMHS [19]. The body-region specific effective mass properties are computed as the ratio of the impulse to the impact velocity. The impulse is computed as the time-integral of the mass times the acceleration of the pendulum impactor divided by the time-integral of the acceleration of the PMHS. The normalizing factors shown (Table 26.2) for the single degree of freedom model is modulated by the weighting factor, defined as the ratio of the sum of the mass of the pendulum and effective mass computed above to the sum of the mass of the pendulum and effective mass of the reference. In other words, all quantities shown in Table 26.2 are multiplied (within the square root function) by this weighting factor (Table 26.3).
Table 26.3
Normalizing factors for the impulse momentum method using the two degree of freedom model
Variable | Normalizing factor |
|---|---|
Force | Square root of the product of mass and stiffness factors and weighting factor |
Deflection | Square root of the ratio of mass to the stiffness factor multiplied by the square root of the weighting factor |
Acceleration | Square root of the ratio of stiffness to the mass factor multiplied by the square root of the weighting factor |
Time | Square root of the ratio of mass to the stiffness factor multiplied by the square root of the weighting factor |
26.2.2.3 Normalizing Factor for Velocity
Renormalization to a common velocity is needed if considerable differences exist in the insults between different PMHS tests. This is likely more of an issue with pendulum tests and PMHS with widely varying total body mass. This can also occur from the device aspect stemming from the use of energy absorbing materials or due to the inherent biological variability in the surrogate. Increased body mass index or adipose tissue may also be a factor. A standard impact velocity representative of all tests in the ensemble should be initially chosen for this purpose. The afore determined force and deflection responses are further modulated (multiplied) by the velocity factor, defined as the ratio of the standard velocity to the velocity sustained by the tested PMHS, although the time factor does not need renormalization.
26.2.2.4 Another Method for the Determination of the Stiffness Ratio
Another approach has been suggested to determine the stiffness ratio [9, 18–21]. Using the force and deflection data, the effective stiffness of each PMHS is determined by dividing twice the integral of the force-deflection response by the square of the peak deflection of the PMHS. The stiffness ratio is the stiffness of the reference to the effective stiffness of the PMHS. A limitation is the need to obtain force and deflection data from each PMHS test. This necessitates use of devices such as a chestband or accelerometer in the instrumentation list. The numerator of the stiffness ratio cannot be obtained from geometrical measurements for the reference subject (dummy) and it is test specific. Because not all intact PMHS tests have used chestbands to record deformation, these two features render the application of this method to existing data difficult. Double integration of acceleration data is also not fully accurate to obtain deflections. Although this method appears to be more accurate than using the length as a surrogate for stiffness, experimental design should accommodate the determination of kinetics in the biological surrogate. This may be adopted in future course of experiments if this method proves to be more efficacious, i.e., reduce the spread in the resulting corridors.
26.2.2.5 Applications
This method has been adopted for developing human response corridors from different PMHS experiments [19, 22–29]. Forces and deflection responses were normalized to adult mid-size male and data were obtained from 14 PMHS subjected to 44 blunt lateral impacts at three velocities using a pendulum device [19]. The International Standards Organization for side impact has used this approach to develop regional biofidelity response corridors. Yoganandan et al., used this approach to determine the deflection-time histories from oblique side impact sled tests wherein data were obtained from chestbands wrapped on the thorax and abdomen [21]. The stiffness factors based on the force and deflection responses of each PMHS in lateral impacts was used to compare the results with the characteristic length method used in the impulse momentum approach [5, 15, 20, 30]. The use of PMHS-specific stiffness from the force-deflection responses improved coefficients of variations compared to the characteristic length method.
26.2.3 Mean and Standard Deviation Responses for Corridors
In the beginning subjective methods were used to establish surrogate response corridors [31]. Mathematical processes include the equal stress equal velocity and impulse momentum methods. The mean and plus and minus one standard deviations in the temporal domain for fundamental responses (force, acceleration and deflection) constitute human response corridors. This also applies to the cross-variables, i.e., force-deflection responses.
26.2.3.1 Fundamental Time-Varying Responses
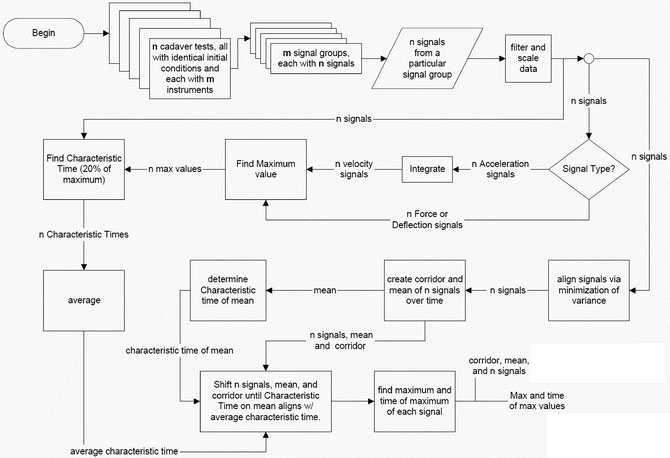
It is important to align the signals of the variables from the impact test. One of the simplest methods is to align the maximum magnitude of the ordinate and shift the signal in time such that each peak occurs at the same time for all PMHS tests [32]. As this method can lead to inaccurate alignments, another method would be to align the signals based on the initiation of the acceleration/deceleration pulse. Although this method appears to be straightforward, difficulties exist if different body regions absorb the impact loading initiating at different times during the loading phase of the PMHS. The cumulative variance method is used [33]. In recent side impact tests, forces and deflections were isolated for different body regions: forces for the thorax, abdomen and pelvis and deflections of the thorax and abdomen [15]. The following methods were established to determine the mean and standard deviation responses and corridors from a variety of test conditions. For flat wall tests, t0 was determined by initiation of arm contact on the thoracic load plate. In pelvic, thoracic and abdominal offset tests, t0 was coincident with specimen contact with the offset load plate. Contact with the load plate was determined by finding the first point in time where the force exceeded 200 N and then incrementing backward to find the point in time where the force-time history crossed zero force. The time of occurrence of the zero-crossing load was taken to be the start of the impact event for all signals. While signals appeared to have the same shape, their time of occurrence varied between PMHS and it was attributed to local geometry. To preserve relative timing information between sensors attached to different body regions, the following methods were developed to establish the time of occurrence of each signal.
A characteristic time for each signal was defined to quantify when a particular signal occurred relative to t0 (Fig. 26.1). Initiating from the peak amplitude of the force, the signal was traced back temporally to determine one-fifth of the peak amplitude. The characteristic time was defined as the time of occurrence of the one-fifth of the peak force. The characteristic time for acceleration signals was determined in the same manner, except that the signal was first integrated and then the peak and one-fifth point of the integrated acceleration were determined, after determining characteristic time. The integrated acceleration curve was discarded and the characteristic time was associated with the original acceleration curve. Average characteristic time for each signal group was determined to quantify average time at which signals in the group occurred relative to t0. The signals in each signal group were aligned by minimizing the cumulative variance.
Terms a and b are the magnitudes of the two signals at the ith time step; t is the greater of the start times of signal a and b; and ti is the lesser of the end times of signals a and b. Signal start and end times were defined as follows. For force and deflection signals, starting from the peak of the signal decrement in time until the signal amplitude reached one-fifth of the peak value. This defined the starting of the signal. Again starting from the peak of the signal, increment in time until its amplitude reached one-fifth of the peak value, and this is the end time of the signal. For acceleration signals, the curve is first integrated and the maximum value is determined. Beginning at the peak value and decrementing backward, the end time is the time of the first point that reaches four-fifths of the maximum value, and the start time is the time of the first point that reaches one-fifth of the maximum value.
(26.1)
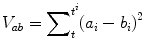
Two signals can be aligned by time-shifting the signals relative to one another until a minimum variance (Eq. 26.1) would be obtained. To align a set of n signals, one signal from each signal group was chosen as the standard for alignment. This alignment standard was the one that appeared to have the most typical shape of all signals. The cumulative variance between the alignment standard signal (S) and the second signal in the group, Vs2, was minimized as follows. The second signal was shifted backward in time by an amount equal to one-third of its duration (end time minus start time), and the variance Vs2 calculated according to the above equation. The second signal was shifted forward by one time step and the cumulative variance calculated. The process of shifting and calculating the variance continued until the second signal had been forward time-shifted by an amount equal to two-thirds of its total duration; the variance was recorded at each shift step. The shift step with the lowest cumulative variance was considered to have the optimal alignment of the alignment standard and second signals. The process was repeated for all signals in the group, one at a time, optimally aligning them with the standard signal. The mean PMHS response is obtained using the following equation subsequent to the described alignment process.
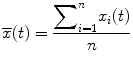
Where the variable xi(t) represents the magnitude of the signal at time t for the ith PMHS, n is the number signals and  represents the mean PMHS response at time t. The standard deviation (SDt) at each time is obtained from the Eq. 26.3.
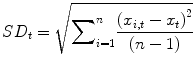
The corridor expressed as the mean and one standard deviation limits of the response is derived by adding and subtracting the standard deviation from the mean in the temporal domain.
(26.2)
represents the mean PMHS response at time t. The standard deviation (SDt) at each time is obtained from the Eq. 26.3.(26.3)
(26.4)
26.2.3.2 Cross Variable Responses
Responses such as force-deflection curves are obtained by eliminating the abscissa between the two parameters in the fundamental force-time and deflection-time responses. In an early study on the determination of the mechanical properties of PMHS lumbar spine ligaments, Pintar et al. used measured force-time responses from the load cell and deflection-time responses from the linear variable differential transducer attached to the electrohydraulic piston to determine tensile force-deflection properties [34]. This method was later used by Yoganandan et al. to determine the force-deflection properties of PMHS cervical spine ligaments [35]. Force-time and deformation-time signals were normalized with respect to the corresponding failure force and deformation magnitudes. Using the deformation as the governing variable for each force-deformation curve, at every normalized deformation data point, normalized force values were computed. The mean of these values for each ligament resulted in the mean normalized force at the corresponding normalized deformation points. These mean normalized force-deformation curves were transformed into engineering units by suitably multiplying the abscissa and ordinate with the mean failure deformation and mean failure force values, respectively, calculated for that particular ligament. At each abscissa point on the mean force-deflection curve, the authors computed plus and minus one standard deviations, describing the corridors based on the ordinate [34, 36]. Joining the minus one standard deviation and upper one standard deviation points yields the plus minus one standard deviation response corridor. Although these normalization procedures were derived from static loading, the method can be used in dynamic loadings. The described method does not account for variations in deflections because the deflection was the controlled input from the testing device. However, its standard deviations can be obtained using the same method. This process results in plus and minus one standard deviation at each data point on the mean curve, instead of the deviation for only the ordinate. Two empirical methods, termed as the box and elliptical methods, are proposed for corridor construction when both deviations are considered [37, 38].
Box Method
The box method represents the four corners of the plus and minus standard deviations in the abscissa and the ordinate the following steps are followed. Normalize deflection by dividing deflections for each test (raw curve) by the peak deflection. Determine forces for all raw curves at common normalized deflections (e.g., at every 1 % of peak deflection), and determine the average force at each deflection step. Multiply the normalized deflections by the average peak deflection of the raw curves in the entire ensemble. This results in the characteristic mean response curve. Determine the standard deviation in the force for each point on the characteristic mean response curve. Normalize force by dividing the peak force for each raw curve with its associated peak deflection. Obtain deflections for all raw curves at common normalized force values using an interpolation technique (e.g., 1 % of peak force). Determine the standard deviation in the deflection for each point on the characteristic mean response curve. Determine the “extreme” variation values associated with each point on the characteristic mean response curve, plot the four variation “extreme” curves, and enclose the region bounded by the four extreme curves.
Ellipsoid Method
This is a slight deviation from the box method. This approach treats the four corners of plus and minus standard deviations in the abscissa and ordinate (deflection and force in the cited example above) as the end points of the major and minor axes of an ellipse at each point on the characteristic mean response curve.
26.2.4 Scaling
A distinction can be made between the terms normalization and scaling based on the following considerations. While normalization can be defined as the process by which the measured/derived responses from individual PMHS tests with varying properties are brought into a reference, scaling is the process by which normalized responses can be transformed from one reference to another. For example, responses normalized and applicable to a mid-size male anthropometry can be scaled to pediatric and adult small-size and large-size anthropometries using scaling factors. This process has been used in the United States Federal Motor Vehicle Safety Standards [39]. However, it is possible to directly normalize the original data to such anthropometries by choosing them as reference. This approach has been used in the analysis of side impact response corridors wherein the small-size female total body mass was used to develop fifth percentile female dummy-specific acceleration, force and deflection corridors [17]. The equal stress equal velocity and impulse momentum approaches can be used for either scenario. Scaling factors other than geometry for pediatric applications (bone modulus and calcaneal tendon strength as a surrogate for scaling head injury criteria) have been used [39–42].
26.2.5 Discussion on Normalization and Scaling
The equal stress equal velocity approach relies only on the mass ratio between the reference subject and the tested PMHS in the ensemble on a specimen-by-specimen basis. This is applicable to all types of impact tests: drop, pendulum and sled. The impulse momentum approach takes into account the type of impact test and the effective of mass of the specific body region, regardless of methods used to determine stiffness ratios, based on characteristic length- or force-deflection properties specific to the type of impact test. This approach should lead tighter corridors in principle. Studies evaluating the tightness are limited. An analysis of maximum regional forces from lateral impacts with abdomen offset using the equal stress equal velocity and the impulse momentum approaches are presented in Figs. 26.2 and 26.3 [43, 44]. The mean and standard deviation data for different body regions show no significant bias.
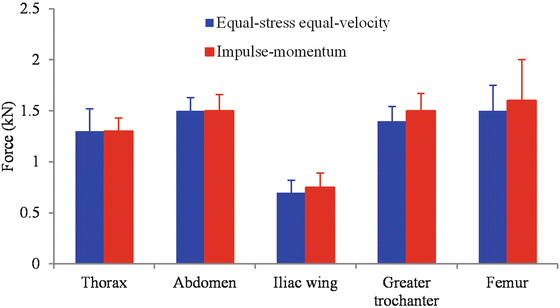
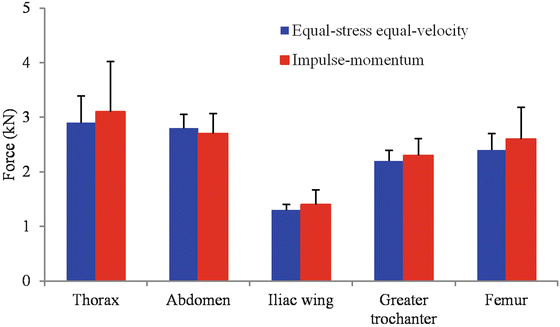
Factors such as loading type and the region of impact to the human body can influence results. Abdomen offset loading has the potential to load the less stiff and more viscous abdominal region compared to the flat wall or thoracic offset loading as these impacts tend to engage the skeletal regions initially [45]. The impulse momentum method may not be completely sensitive to local responses in all testing conditions. The choice of the PMHS may govern the outcome. A well-controlled experimental design such as using anthropometry-specific and segmented load-walls to accurately engage the specific body region, confining the subject selection based on bone mineral density of skeletal structures to minimize variability and ensuring alignment of the subject prior to impact with the load-wall, will likely have a greater influence on the outcomes, regardless of the analysis procedure used to normalize and scale recorded measurements. However, this hypothesis remains further research.
For the corridors and cross variable plots, extensions of the originally proposed analysis, based on PMHS cervical and lumbar spine ligament data, by accounting for the spread in the force and deflection by treating the four corners of the standard deviations as the extreme boundaries of an ellipse or a box are advancements. Studies are limited delineating to determine the superiority of the two box and ellipse methods. The use of either approach may have to account for the following issue: four extreme curves created by plotting the four extreme variation values for each point (plus and minus one standard deviation) on the characteristic average curve, and then enclosing the region bounded by the four extreme curves to create the corridor, may include areas beyond the one standard deviation for the ordinate and abscissa. It should be noted that both variables are treated as dependent parameters, not fully complying with the conventional definitions of insult-response depictions. Additional studies to evaluate the efficacy of these empirical methods with controlled datasets from different impacting conditions are therefore necessary.
26.3 Part II: Human Injury Risk Curve
26.3.1 Rationale for Human Injury Risk Curve Development
In the automotive field, knowledge on human injury tolerance to impact is necessary to design restraint systems for improving occupant protection. It is also necessary to set limits in test protocols for regulatory bodies and consumer-testing organizations. Human tolerance is investigated through relationships between mechanical load (such as a stress or a strain) and injury due to the external load. As explained earlier and elsewhere, there is variability among humans such that injury tolerance to impact does not correspond to one magnitude [46]. Some humans will tolerate more than others. Human injury tolerance limit is therefore better expressed using a distribution instead of one value. The cumulative distribution of the tolerance corresponds to the injury risk curve. A probability of 50 % of injury risk means that one-half of the considered population has a tolerance limit lower than the corresponding injury criterion value and will sustain injury if subjected to conditions corresponding to this level or higher. The injury risk curve is built as a function of an injury criterion. It represents the parameter allowing the prediction of the risk. It can correspond to a strain or a stress (derived metrics) or to more global parameters such as deflection, force and acceleration. The injury risk curve is the result of statistical modeling of the occurrence of the injury as a function of injury criterion sustained by the human body when impacted with an external load.
As described before, normalization processes attempt to reduce variability among the humans as much as possible, taking into account parameters for which the influence on the human response is known. The weight and size of the human are usually considered [12, 18]. Despite normalization processes, injury tolerance among humans are still scattered due to inter-individual differences and the definition of an injury risk curve rather than a single injury tolerance value is necessary. Injury tolerance limits are derived from the injury risk curves and can be used by regulatory bodies, automotive manufacturers and suppliers to ensure that the design of a restraint system or a vehicle component is efficient to protect the occupant during a crash.
The final goal of injury risk curves is to provide injury criteria to be used to ensure protection of the motor vehicle occupant. An efficient way to do it would be to collect information from crashes to develop injury risk curves. Crash investigations provide information on vehicle and occupant conditions and sometimes on the loading of the occupant (such as the load applied on the thorax), although information on the responses of the occupant are usually not available. An alternative solution is to reproduce some crash conditions in laboratory. The most representative surrogates for the occupant would be volunteers, although they are tested at low severity, i.e., sub-injurious loads. Some volunteer tests have been conducted in the biomechanical field but they are mainly used to study human kinematics [47, 48]. The fact that tests are non-injurious is a clear limitation in the development of an injury risk curve. Animal tests have also been considered as some of them allow the testing of a living surrogate at high severity [49, 50]. However, the applicability of resulting curves to the human will depend on the correspondence in terms of anatomy, geometry and material properties between the animal and human. A possibility to test a surrogate closer to the car occupant, allowing the performance of injurious and non-injurious tests and avoiding any correspondence due to difference of species is to use PMHS in laboratory tests. The PMHS are generally older than the mean age of the driving population. This is a well acknowledged aspect in automotive tests for many decades. In some tests, physiological conditions of the living human (re-pressurization of the arterial system, re-insufflation of the lungs, etc.) are reproduced as much as possible to limit the influence of differences between living human and PMHS and their possible influence on the mechanical responses and injuries.
Related posts:


Stay updated, free articles. Join our Telegram channel

Full access? Get Clinical Tree


