Fig. 1.1
MRI ankle evaluation (sagittal plane, proton density with fat saturation on the left and fast spin-echo T1-weighted on the right) of an 11-year-old boy showed osteochondral lesions on both distal tibia (arrows) and talar dome (arrowheads)
Most of the osteochondral lesions of the talar dome occur in central medial ridge (about 65 %), and the second highest frequency of lesions occur on the central lateral ridge (about 32 %). Only 3 % of lesions are located in the middle of the talar dome. Moreover, the osteochondral lesions in the medial third of the talar dome are usually larger in both surface area and depth than lesions in the lateral third of talar dome [8, 10].
1.3 MRI Findings
To evaluate MRI findings for the diagnosis of osteochondral lesions, it is necessary to understand the normal appearance of both articular cartilage and bone tissue.
Articular cartilage, on MRI spin-echo T1-weighted sequences, is characterized by an intermediate signal intensity, higher than muscle signal intensity and lower than adipose tissue signal intensity. Also on proton density sequences, the articular cartilage presents an intermediate signal intensity between muscle and adipose tissue. On the contrary on spin-echo T2-weighted images, cartilage has a low signal intensity; this low signal intensity is in contrast with the adjacent synovial fluid that presents a very high signal intensity on T2-weighted images. This signal intensity contrast allows an excellent evaluation of cartilage tissue on these sequences. Moreover, the signal intensity of the cartilage on T2-weighted images increases from depth to superficial layers. In the gradient-echo sequences, articular cartilage presents an intermediate signal intensity that decreases in the depth layers near the subchondral bone [11].
Regarding bone tissue, we have to distinguish into cortical bone and medullary bone. Cortical bone has a typical low intensity of signal in all MRI sequences. Signal intensity of medullary bone can vary on the basis of bone marrow changes and presents different kinds of MRI presentations depending mostly on age and skeletal sites. In the adult, in normal bones of the ankle prevails the adipose medullary bone pattern which has high signal intensity on both T1- and T2-weighted images and it decreases significantly on fat-saturated sequences [11].
On T1-weighted images, the signal intensity of areas adjacent to fragment of osteochondral lesions is usually intermediate or low. A characteristic high signal line is detectable on T2-weighted images adjacent to the fragment demarcating it. This sign is usually called ‘rim sign’ and usually indicates an unstable lesion. Chondral defects may be detected on T2-weighted and density proton sequences with exposure of subchondral bone filled with synovial fluid that presents high intensity signal in these sequences. The loose bodies may be diagnosed on T2 images as area of low signal outlined by high signal fluid. The donor defect area is usually filled with articular fluid that is usually hyperintense on T2-weighted images [12]. The presence of subchondral cyst may be detected as regular area of high intense signal on T2-weighted and proton density images and hypointense on T1-weighted images (Fig. 1.2).
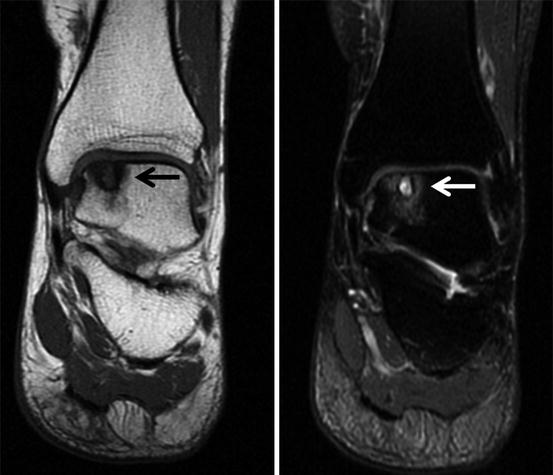
Fig. 1.2
Osteochondral lesion of the medial side of the talar dome (arrows) with cystic degeneration of subchondral bone and surrounded by bone oedema. The lesion is shown on T1-weighted MR images (on the left) and on proton density fat-suppressed images (on the right)
Bone oedema that frequently surround osteochondral lesions is characterized by low signal intensity on T1-weighted images and high signal intensity on T2-weighted fat-suppressed images or STIR sequences.
MRI is also able to help in differentiating between chronic or recent lesions. In fact, a low intensity signal on T1 images represents sclerosis and is a characteristic in chronic osteochondral lesions.
1.4 Technical Notes
Standard MR imaging sequences usually consist of fast spin-echo proton density, T2-weighted fat-suppressed sequences and newer various gradient echo sequences [13]. T1-weighted sequences are important and must be used for a correct evaluation of bone structures.
The best MRI sequence for the detection of osteochondral lesions is still a subject of controversy. Some reports based proposed thin-section 3D Fourier transform spoiled gradient-echo techniques with fat saturation and others fat-saturated fast spin-echo technique. Some authors also recommended intra-articular injection of contrast material (gadolinium) to obtain an improved detection of osteochondral lesions even if this approach is rather invasive [14].
Sagittal and coronal views are the preferred planes to evaluate osteochondral lesions of the ankle that mostly occur in the talar dome.
Three-dimensional sequences can improve the detection of cartilage lesions because of their possibility to obtain thin slices with high spatial resolution. This is particularly important in the ankle that is characterized by thin and incongruent articular surface of the distal tibia and talar dome [15]. Three-dimensional sequences permit also multiplanar reconstruction on coronal, sagittal, axial and also oblique plain, independently from the sequence acquisition plane, similar to CT thin slice reconstructions, and they are also able to show very small lesions (Fig. 1.3).
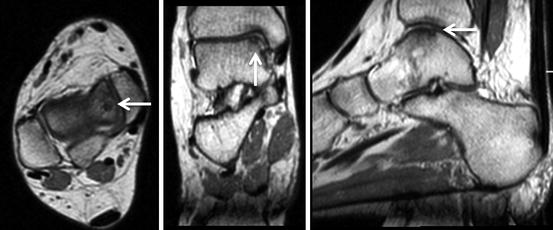
Fig. 1.3
MRI, fast spin-echo proton density ‘cube’ with thin slices acquired on axial plane (on the left) and reconstructed on both frontal (on the middle) and sagittal planes (on the right), showed a small osteochondral lesion of the talar dome (arrows) in a 47-year-old woman with persistent ankle pain and previous negative findings on plain radiographs
Recent researches have highlighted the importance of the quantitative MRI evaluations that can detect early articular cartilage damage before morphologic cartilage loss occurs. Amongst these new MRI tools, we report T2 and T2* relaxation time measurements (T2 and T2* mapping) that is the most used and represents a biomarker for the valuation of articular cartilage and cartilage repair tissue. Higher and more heterogeneous T2 values are thought to characterize collagen deterioration and increasing water contents [16].
Diffusion-weighted imaging evaluates water mobility in the articular cartilage. In cartilage with an intact collagen structure, water mobility is restricted. Early cartilage degeneration can be demonstrated on diffusion-weighted images by the increased mobility of water in a deteriorated extracellular matrix [16].
These tools have particularly grown in importance due to the necessity to closely follow up osteochondral lesions after cartilage repair, since the ethical aspects of biopsy in healthy patients are not acceptable anymore.
1.5 Classification
Berndt and Harty in 1959 established a 4-stage classification system of ankle OCLs based on the severity of the lesion on plain radiographs, which has been widespread used for decades and still has an importance on the evaluation of plain radiographs (Table 1.1) [17].
Table 1.1
Berndt and Harty classification of osteochondral lesions of the ankle (1959)
Stage | Lesion’s morphology on plain radiographs |
|---|---|
I | Compressed |
II | Chip avulsed but attached |
III | Detached chip but undisplaced |
IV | Detached and displace chip |
As new imaging modalities emerged, several osteochondral classifications have been created.
In 1993 Loomer et al. completed the Berndt and Harty classification, adding a fifth type based on CT findings, characterized by radiolucent cystic lesion [4].
In the past years, as MRI was emerging as the gold standard imaging tools for the diagnosis of osteochondral lesions, many classifications have been proposed using this imaging technique.
Dipaola et al. proposed a classification for osteochondral lesion of the talus in 1991, using MRI (Table 1.2) [18].
Table 1.2
Dipaola et al. classification based on MRI findings (1991)
Stage | MRI findings |
|---|---|
I | Thickening of articular cartilage and low-signal changes on intermediate/spin density images |
II | Articular cartilage breached with low-signal rim behind fragment indicating fibrous attachment |
III | Articular cartilage breached, high-signal changes behind fragment indicating synovial fluid between fragment and underlying subchondral bone
Related posts: Rehabilitation and Return-to-Sports Activity After Debridement and Bone Marrow Stimulation of Osteochondral Talar Defects
Conservative Treatment of Talar Osteochondritis Dissecans (OCD) Rehabilitation and Return-to-Sports Activity After Debridement and Bone Marrow Stimulation of Osteochondral Talar Defects
Conservative Treatment of Talar Osteochondritis Dissecans (OCD)
 Osteochondral Ankle Injuries in Footballers Osteochondral Ankle Injuries in Footballers
 Management of Cystic Osteochondral Lesions of the Talus Management of Cystic Osteochondral Lesions of the Talus
 Mosaicplasty of Osteochondral Lesions of the Ankle Mosaicplasty of Osteochondral Lesions of the Ankle
 Arthroscopic Debridement of Osteochondral Lesions of the Talus Arthroscopic Debridement of Osteochondral Lesions of the Talus
Stay updated, free articles. Join our Telegram channel
Full access? Get Clinical Tree
 Get Clinical Tree app for offline access

|