Turnover
Mineralization
Volume
High
Normal
High
Normal
Abnormal
Normal
Low
Low
6.2.2 Bone Mineral Density in CKD
According to a survey of 2174 Japanese men age 65 or older, bone density of lumbar spine and femur was negatively correlated to renal function [7]. Furthermore, a meta-analysis of the patients with end-stage renal failure (CKD stage 5) showed that bone density was low in the patients who had previously experienced bone fractures [8], suggesting that bone density measurement may be useful for fracture risk assessment in CKD stage 5. However, the prevalence of fracture in the proximal femur is higher in patients on maintenance hemodialysis (CKD stage 5D), regardless of age or sex, compared with the general public [9], indicating that CKD itself is a factor for bone fragility.
6.2.3 Residual Renal Function and Bone Fragility
Even in CKD stages 1–3 with mild renal dysfunction, lower renal function has been shown to be a risk for fracture in the proximal femur, after correction for bone density [10]. Accordingly, bone density alone has a limitation in assessing bone fragility in CKD as in the case of diabetes [11].
Fracture prevalence is particularly high in CKD patients with a glomerular filtration rate (GFR) <60 mL/min, and their prevalence has been reported as 2.12 times that of the patients with GFR ≥60 mL/min [12]. Furthermore, as already mentioned (Sect. 6.2.2), maintenance hemodialysis patients with advanced renal dysfunction (CKD stage 5D) have a higher prevalence of proximal femur fracture than the general population, regardless of age or sex [9]. Even in the CKD stage 5D patients on hemodialysis for less than 1 year, their prevalence of proximal femur fracture is higher compared with non-CKD patients, a trend that continues over a long time [13] (Fig. 6.1).
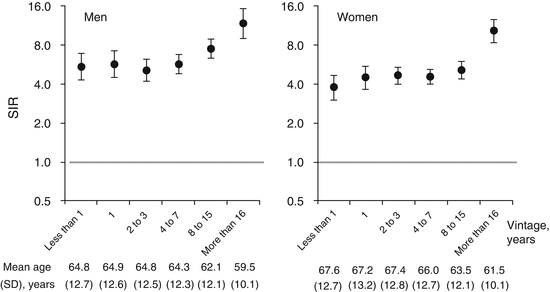

Fig. 6.1
Incidence of proximal femur fracture after introduction of hemodialysis [13]. Standardized incidence ratios (SIRs) stratified by vintage for men and women and standardized for age. Error bars indicate 95 % confidence intervals. Less than 1 year after introduction of hemodialysis, SIR was already substantially higher than that of the general public (horizontal line set as 1.0 on the y-axis), a trend that continued for 15 years after hemodialysis introduction. At 16 years and beyond, SIRs rapidly increased
6.2.4 SHPT and Bone Fragility
In CKD stage 5D patients, the prevalence of SHPT associated with a marked increase of parathyroid hormone (PTH) is still high, which is a risk factor for fracture. An excessive increase of PTH in SHPT worsens ROD, particularly osteitis fibrosa, increasing the fracture risk [3].
Increased bone turnover in SHPT is considered a factor for bone fragility in CKD [14]. According to a report on cross-sectional examination of bone biopsy specimens of CKD stage 5D patients, bone turnover markers, namely, osteon activation frequency and bone formation rate, are negatively correlated with serum sclerostin and positively correlated with serum intact PTH [15], and this finding is one piece of the evidence for PTH’s acceleration of bone turnover.
6.2.5 Bone Quality in CKD
In CKD, only a weak correlation is found between bone density and fracture rate, compared with primary osteoporosis [16]. Therefore, decreased bone quality, rather than decreased bone density, is suspected as a factor for fragility fracture in CKD. Bone quality deteriorates due to advancement of hyperhomocysteinemia in association with progression of CKD [17], thereby increasing formation of pentosidine cross-links, which are nonphysiological cross-links for type 1 collagen in bone tissue, and bone fragility develops [18]. According to a study on iliac biopsies of CKD stage 5D patients with advanced SHPT, mature cross-links decreased and immature cross-links increased in bone tissue [19]. The content of pentosidine increased substantially in the bone tissue of CKD stage 5D patients compared with that of healthy people, and bone formation rate per bone volume and mineral apposition (bone calcification) rate were inversely proportional. Based on the above, the increase in advanced glycation end-product cross-links such as pentosidine cross-links is strongly related to abnormal bone metabolism in CKD stage 5D patients.
Bone density cannot accurately assess fracture risk because of technological problems with bone densitometry measured by dual-energy X-ray absorptiometry (DXA). High-resolution peripheral quantitative computed tomography (HR-pQCT) for peripheral bones produces images of minute bone tissues and therefore is more reliable than DXA for evaluation of osteoporosis [20]. HR-pQCT is particularly good for evaluating cortical bone. In CKD patients, cortical bone becomes osteoporotic due to SHPT and acceleration of bone metabolic turnover [21]. Because osteoporosis of cortical bone cannot be captured by a traditional DXA, it is considered an aspect of bone quality.
6.2.6 Other Factors Affecting Bone Fragility in CKD
In a retrospective cohort study of 144 patients with CKD stage 5D using the onset of fragility fracture as the outcome [22], sex (female), fracture history, decreased radial bone density, relative hypoparathyroidism, and vitamin D deficiency were found to be independent risk factors for fragility fracture (Table 6.2). Even in healthy people without reduced kidney function, the level of vitamin D sufficiency and prevalence of proximal femur fracture are correlated [23]. In patients on CKD stage 5D, attention should be paid not only to the decrease of serum 1,25-dihydroxyvitamin D (1,25-(OH)2D) but also to the level of nutritional vitamin D sufficiency or serum 25-hydroxyvitamin D (25-OHD) level.
Table 6.2
Correlates of bone fracture in prevalent hemodialysis patients
OR | P | 95 % CI | |
|---|---|---|---|
Sex (female) | 18.092 | 0.026 | 1.406–232.937 |
Fracture before HD | 73.786 | 0.001 | 6.143–886.217 |
Previous transplantation | 0.462 | 0.541 | 0.039–5.508 |
Duration of RRT | 0.998 | 0.740 | 0.986–1.010 |
iPTH <100 pg/mL | 37.774 | 0.022 | 1.694–842.189 |
iPTH >300 pg/mL | 1.981 | 0.499 | 0.273–14.372 |
Kt/V | 0.023 | 0.154 | 0.000–4.141 |
Radius Z-score (1-SD decrease) | 2.691 | 0.006 | 1.327–5.459 |
25-OHD <20 nmol/L | 11.215 | 0.026 | 1.326–94.813 |
6.3 Chronic Kidney Disease-Mineral and Bone Disease
With progression of CKD, calcium and phosphate homeostasis collapses and risk of death and cardiovascular events increases [2]. In CKD, bone diseases and ectopic calcification develop concurrently. Therefore, the term “chronic kidney disease-mineral and bone disorder (CKD-MBD)” has been recommended to represent the concept of bone mineral metabolism disorder [6].
6.3.1 Calcium and Phosphate Homeostasis
Homeostasis for calcium (Ca) and phosphate (P) concentrations in serum involves three hormones: PTH, 1,25-(OH)2D, and fibroblast growth factor 23 (FGF-23). PTH, 1,25-(OH)2D, and FGF-23 form a feedback loop with Ca and P [24] (Fig. 6.2). Furthermore, PTH, 1,25-(OH)2D, and FGF-23 form feedback loops among each other. These hormones play an important role in serum Ca-P homeostasis.
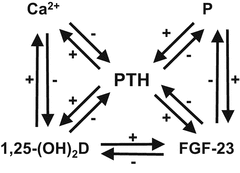

Fig. 6.2
Feedback loops in calcium and phosphate homeostasis [24]. Calcium and phosphate homeostasis is regulated by three hormones: parathyroid hormone (PTH), 1,25-dihydroxyvitamin D (1,25-(OH)2D), and fibroblast growth factor 23 (FGF-23). A feedback loop is formed between respective factors, playing an important role in serum Ca-P homeostasis
PTH, produced from the parathyroid gland, is important for the minute-to-minute regulation of serum Ca concentration. In the parathyroid gland, there are vitamin D receptors (VDRs), calcium-sensing receptors (CaSRs), and fibroblast growth factor receptor (FGFR)-Klotho complexes [25] (Table 6.3), which transmit to parathyroid cells information regarding the 1,25-(OH)2D, Ca, and FGF-23 concentrations in the blood, respectively, thus modulating PTH secretion.
Receptor | Location |
|---|---|
VDR | Cell nucleus |
CaSR | Cell membrane |
FGFR-Klotho complex | Cell membrane |
CaSR, in particular, has an important role in regulating serum Ca concentration. CaSR is a seven-transmembrane receptor in the parathyroid cell membrane. PTH is a hormone with high responsiveness for maintaining the serum Ca concentration. The parathyroid cell is highly sensitive to the changes in extracellular Ca concentration and regulates PTH secretion accordingly [25] (Fig. 6.3). Cinacalcet and other CaSR agonists modulate CaSR allosterically and make the parathyroid cell behave in a way as if the extracellular Ca concentration were high. In addition to the regulation of PTH release from the secretory granules in the parathyroid cell [26], cinacalcet is involved in PTH gene transcription and posttranscriptional regulation [27]. Furthermore, cinacalcet is involved in the regulation of parathyroid cell growth [28] and also contributes to the PTH secretion regulatory mechanism.
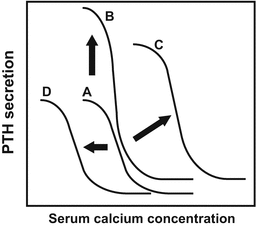

Fig. 6.3
Extracellular calcium-induced changes in the parathyroid hormone (PTH) secretion-regulating mechanism and changes in pathological condition [25]. (a) Normal PTH-Ca sigmoid curve. In accordance with the changes in serum calcium, PTH is produced. The serum calcium concentration corresponding to the midpoint PTH value between maximal and minimal PTH secretion is called the set point, which is used to evaluate parathyroid sensitivity to serum calcium concentration. The increase of the set point indicates a reduction of sensitivity to serum calcium, suggesting decreased calcium-sensing receptor (CaSR) expression in the parathyroid. (b) The case where only the number of secretory cells increases with no set-point abnormality. The PTH-Ca sigmoid curve only moves upward with no rightward shift and no hypercalcemia. (c) In primary hyperparathyroidism or severe secondary hyperparathyroidism, the number of secretory cells increases, and the PTH-Ca sigmoid curve moves upward, thus reducing CaSR expression in the parathyroid, with elevation of the set point and a rightward shift of the PTH-Ca sigmoid curve. In such a condition, hypercalcemia and excessive PTH concentration in the blood may coexist. (d) In autosomal dominant hypocalcemia induced by an activating mutation of the CaSR, parathyroid sensitivity to serum Ca increases, with a leftward shift of the PTH-Ca sigmoid curve due to the lowered set point. Calcimimetic CaSR agonists such as cinacalcet also lower the set point
FGF-23 is produced from bone and can regulate serum phosphate concentration without causing much change in the serum Ca concentration. Secretion of FGF-23 from osteocytes is regulated by dietary phosphorus loading, 1,25-(OH)2D, and PTH [24] (Fig. 6.2). The FGFR-Klotho complex is a receptor for FGF-23. In Klotho-mutant mice, the function of Klotho (part of the receptor) is deficient, and acceleration of aging and ectopic calcification have been reported [29]. The phosphorus metabolism regulatory system controlled by the FGF-23 signaling has an important role in Ca-P homeostasis in the blood, particularly in suppression of ectopic calcification.
6.3.2 Pathogenesis of SHPT
In the initial stage of CKD, the serum Klotho concentration decreases first and then the serum FGF-23 concentration increases [30] (Fig. 6.4). With progression of CKD, the elevation of serum phosphorus concentration cannot be suppressed by only the increased FGF-23, leading to an increase of PTH. When FGF-23 and PTH finally fail to regulate phosphorus metabolism, the serum phosphorus concentration rises.
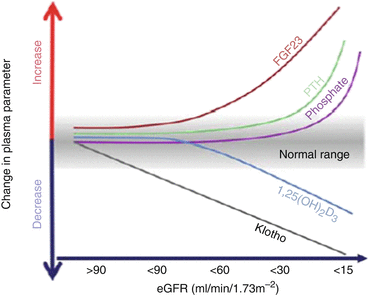

Fig. 6.4
Time profile of changes in plasma fibroblast growth factor 23 (FGF-23), Klotho, active vitamin D, and phosphate levels as chronic kidney disease (CKD) progresses [30]. With progression of CKD, the serum Klotho concentration decreases and the serum FGF-23 concentration increases, thereby suppressing the elevation of serum P concentration. However, with further deterioration of renal function, the 1,25-dihydroxyvitamin D3 (1,25-(OH)2D3) concentration decreases, and the serum parathyroid hormone (PTH) concentration increases in order to maintain the serum P concentration, but the serum P concentration goes up due to substantial progression of CKD. eGFR estimated glomerular filtration rate
Acceleration of PTH synthesis/secretion, parathyroid cell growth, and parathyroid hyperplasia occur due to hyperphosphatemia-induced relative hypocalcemia, a direct effect of hyperphosphatemia on the parathyroid, and vitamin D activation disorder. In such conditions, PTH activity becomes excessive, transferring phosphorus from bone to blood and further aggravating the hyperphosphatemia, leading to progression of CKD. Even if hemodialysis or peritoneal dialysis is introduced, its capacity to remove phosphorus is limited, and hyperphosphatemia persists, resulting in aggravation of SHPT.
According to the analysis of uremia-associated parathyroid tumors removed by parathyroidectomy (PTX) in the patients with medically refractory SHPT, many of these tumors were found to be monoclonal tumors (produced from a single cell) with somatic mutations [31]. The parathyroid initially demonstrates diffuse hyperplasia due to polyclonal growth but undergoes somatic mutation by a persistent proliferative stimulus and finally progresses to monoclonal nodular hyperplasia originating in a single cell [24] (Fig. 6.5). In such uremia-associated parathyroid tumors, decreased expression of VDR and CaSR is observed [32, 33].
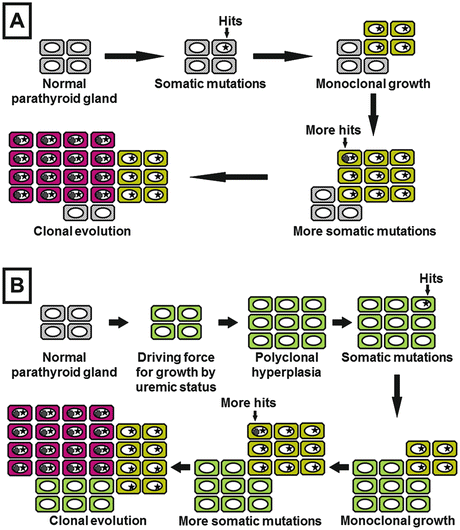


Fig. 6.5
Formation of uremia-associated parathyroid tumors (modification of reference [24]). (a) In primary hyperparathyroidism (parathyroid adenoma), a sequence of somatic mutations occurs and provides the cells with proliferative predominance. In such cells with increased proliferative potency, additional somatic mutations are likely to occur. Eventually, monoclonal tumors are formed. (b) With progression of chronic kidney disease (CKD), polyclonal parathyroid tumors are formed by growth stimulation on parathyroid gland. The actively dividing cells are likely to induce somatic mutations. As a result of proliferative predominance through somatic mutation, monoclonal uremia-associated parathyroid tumors are formed
< div class='tao-gold-member'>
Only gold members can continue reading. Log In or Register to continue
Stay updated, free articles. Join our Telegram channel

Full access? Get Clinical Tree


