Fig. 24.1
These radiographs illustrate the tibial plafond fracture severity spectrum. Simple intra-articular fractures result from low energy impacts (left). As energy increases (moving from left to right in the figure), the fractures become more complex, with greater comminution [Taken with permission from Anderson DD, Marsh JL, Brown TD. The pathomechanical etiology of post-traumatic osteoarthritis following intraarticular fractures. Iowa Orthop J. 31:1–20, 2011]
Limitations of Traditional Assessment of Articular Fracture Severity
The energy involved in producing a fracture has not been a quantifiable variable, making assessment of the severity of the injury inexact, subjective, and largely empirical. An inability to control for the influence of injury severity has been a major confounding factor in clinical studies of intra-articular fracture treatments. In current clinical practice and for clinical research, fracture severity has been subjectively assessed by surgeons or investigators on radiographs, via categorical classifications. Fractures are placed in groups often defined at least in part by assumed severity. These classifications at best allow only crude assessments of injury severity, do not attempt to assess the energy of injury and have very poor interobserver reliability [27–29]. This seriously limits their use for clinical research and even for assessing prognosis or for decision-making about optimal treatments. For these reasons, the relationship between fracture severity and eventual outcomes remains very poorly understood. To scientifically assess the effect of treatment of any condition, an investigator must be able to measure pertinent variables. Techniques that are fundamentally objective and quantitative are needed to assess the mechanical risk factors for developing PTOA.
Theory of Measuring Fracture-Liberated Surface Area to Assess Injury Severity
Although poor observer agreement is common for categorical classifications, studies by our group and others have shown that if experienced clinicians rank order fracture radiographs by severity, the agreement between observers is very high. This technique of rank ordering fractures for severity has been used in several studies which have demonstrated that observer agreement is high when clinicians stratify injury severity using simple comparative rank ordering [30, 31]. Clinicians see information on radiographs that they correlate with severity. In this technique clinicians review a series of radiographs from patients with a specific injury under investigation. The clinicians then “rank” the injuries according to their relative severity within that group of injuries. In assessing relative severity of a set number of fracture cases, clinicians have a high level of concordance with each other [6]. The problem with categorical classifications, such as conventional fracture classifications, is the inherent overlap of categories and their definitions, not the ability of clinicians to agree on radiographic severity. Clinicians assess fractures as more severe based on increased comminution and displacement, and for articular fractures when the fractures have greater involvement of the articular surface. However, rank order techniques do not allow the clinician to apply an injury severity metric to a fracture that is not part of the rank order group. Unfortunately in the absence of a rank ordered series of cases there has been no way to measure any of these variables. Current image analysis technology allows these features of a fracture observed by clinicians to be objectively measured.
In 1998 our group first published the concept that the amount of comminution highly correlated with the amount of energy imparted to the bone to produce the fracture [32]. The idea fits with basic principles of fracture mechanics. During fracture, the mechanical energy absorbed by the bone is converted to new or liberated surface area of the fracture fragments. More comminution means more new surface area. Direct measurement of new fractured surface is possible using routine CT scans acquired for many articular fractures during clinical care. A CT scan is made of the normal contra-lateral limb and the injured extremity. The external cortical and endosteal surfaces of the normal limb are measured as free bone surface area. The injured limb has this same area plus the addition of liberated surface area of fracture fragments seen on each image of the CT. This new, or fracture-liberated, surface area provides the basis for quantifying the fracture energy. Fracture energy serves as a metric of the energy pulse across that cartilage required to create the fracture. This fracture energy measurement provides a novel means to quantify injury severity in intra-articular fractures.
Development of the Analysis Techniques
Image analysis capabilities based on CT images were developed to measure the fracture-liberated surface area [33]. Accurately segmenting bone from other neighboring tissues was a significant technical challenge, due to similar attenuation characteristics. Metaphyseal articular fracture fragments without clear cortical margins and poorly defined fracture lines were particularly challenging.
The initial technique to segment fracture fragments used a seeded region-growing algorithm [34], which was geometrically accurate, but was too slow to be applied clinically. This analysis routine operates with conventional CT image data encoded in standard DICOM file format and can be run on a desktop personal computer.
The technique is used to analyze clinical CT datasets by identifying bone margins slice-by-slice (Fig. 24.2). The bone perimeters (endosteal, periosteal, and subchondral) are multiplied in a given CT slice by that slice’s thickness, which yields the bone surface area through that slice volume. The bone surface areas are summed across all slices to determine the total amount of free surface area. The final step subtracts the preexisting intact bone surface area from the fractured area to determine the liberated interfragmentary surface area. The accuracy of these measurements was originally established on precisely machined cubes of the polyurethane foam surrogate with a known surface area [34].
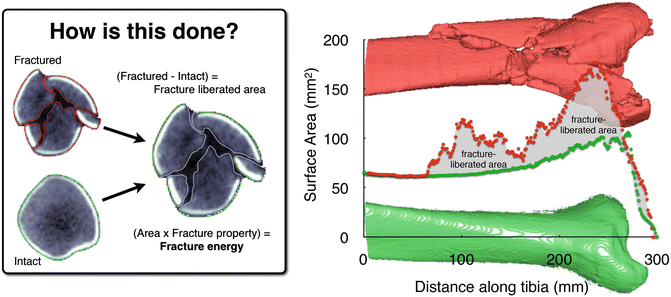
Fig. 24.2
Bone perimeters (matched intact and fractured), plotted along the length of the distal tibia, show how the fracture energy measure is calculated. Inset: CT slice from fracture case, with identified tibia bone fragment edges [Taken with permission from Anderson DD, Marsh JL, Brown TD. The pathomechanical etiology of post-traumatic osteoarthritis following intraarticular fractures. Iowa Orthop J. 31:1–20, 2011]
Controlling for Other Factors
Human bone tissue is a very heterogeneous material. To account for the density and age-dependent energy-absorbing capacity of bone [35–37], bone density-based weighting was integrated into the algorithm. Fracture energy was calculated by multiplying the interfragmentary surface area by the energy release rate (G, units of J/m2). This material property quantifies the amount of energy required to liberate a given surface area and is directly proportional to the first power of apparent density [37].
Bone density would ideally be based on CT Hounsfield intensities along fragment edges, regressed pixel-by-pixel. However, practically this approach is not reliable due to partial volume effects and high intensity gradients at the fracture edge. To deal with this challenge, G was partitioned according to densities found for the three dominant classes of bone: dense diaphyseal cortical, less dense metaphyseal cortical, and cancellous. The densities of these three bone classes are determined on a patient-specific basis [38], regressing from mixed Gaussian distributions. The final energy released by the fracture is determined by scaling (previously measured) impact energy/density data to the bone density values specific for each patient.
Fragment displacement/dispersion also influences the outcome of intra-articular fractures. Clinicians believe that widely displaced fractures are more severely injured than minimally displaced fractures, for good reason. Fragment displacement injures soft tissues and increases the complexity of surgical repairs. Similar to fracture energy, fragment displacement can be objectively quantified from CT studies.
Fragment displacement was quantified from the bone surfaces defined in the fracture energy analysis [8]. With fracture fragment displacement in given cross sections, bone fragments are translated away from their intact positions, disrupting the native shape and alignment of the bone. The intact proximal portion of the fractured tibia was aligned with a mirrored image of the uninjured contralateral side (Fig. 24.3). Fragment displacement relative to their pre-fracture position was calculated by determining the volume of tissues through which fracture fragments were dispersed. For each CT slice, a convex hull (the smallest convex polygon circumscribing a given object) was determined for a composite of the aligned intact and fractured tibias (inset, Fig. 24.3). The increase in volume provided a metric of the amount of fragment displacement and dispersion.
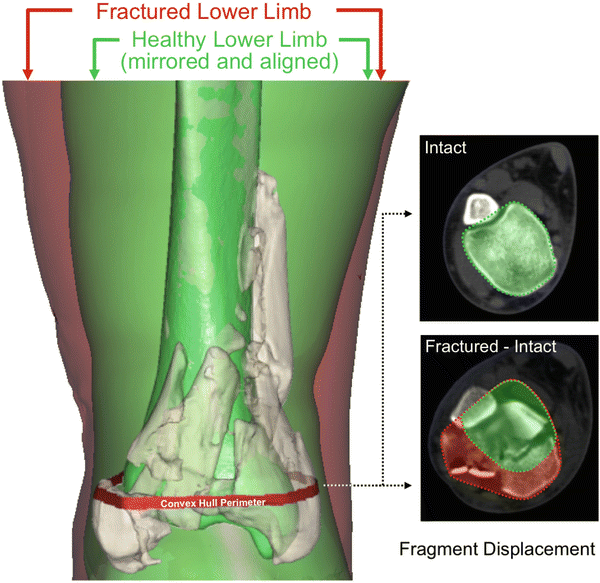
Fig. 24.3
Depiction of the fragment displacement/dispersion metric calculation [Taken with permission from Anderson DD, Marsh JL, Brown TD. The pathomechanical etiology of post-traumatic osteoarthritis following intraarticular fractures. Iowa Orthop J. 31:1–20, 2011]
Since PTOA is the outcome of greatest interest, the degree of comminution of the articular surface, as opposed to the metaphysis or diaphysis, is a key radiographic feature associated with injury severity. To quantify this variable the amount of fracture-liberated surface area located within 1.5 mm of the articular surface of the injured tibia was separately assessed and expressed as a percentage of the intact/contralateral surface area over a similar region of the distal tibia. This provides a separate severity measure exclusively focused on articular surface injury. This can also be assessed visually on plots of the local liberated surface area (energy) along the length of the distal tibia.
Results and Validation
New techniques need to be validated against accepted techniques, and the measured results need to be correlated with outcomes of interest. As an initial step to validate the CT-based injury severity metric, the technique was compared to clinician opinion of fracture severity using rank order assessment of radiographs of the same cases [6]. The radiographs of 20 tibial plafond fractures were chosen to span the spectrum of injury, from mild partial articular fractures to severely comminuted total articular fractures. Three experienced fracture surgeons ranked the cases for injury severity based on the radiographic appearances. The raters were instructed to order the cases from least to most severely fractured.
Inter-rater agreement and agreement between the rater’s assessments of fracture severity and the CT-based fracture severity metrics were assessed using concordance rates. This statistical measure estimates the probability that any two fracture cases would be ranked in the same order. Two ranked cases were concordant with each other when a case ranked higher by one rater also had a higher ranking for a second rater.
The range of different fractures encountered in the study is illustrated via plain radiographs in Fig. 24.1. This figure also illustrates the visual differences present in routine fracture radiographs that allow clinicians to reliably distinguish severity. Eight to ten hours was required to image process one CT dataset (Fig. 24.4), and provide the fracture energy data. Fracture energy ranged from 11 to 53 J, and fragment displacement volumes ranged from 3.4 to 47.4 cm3, reflecting a wide range of fracture severity of these cases.
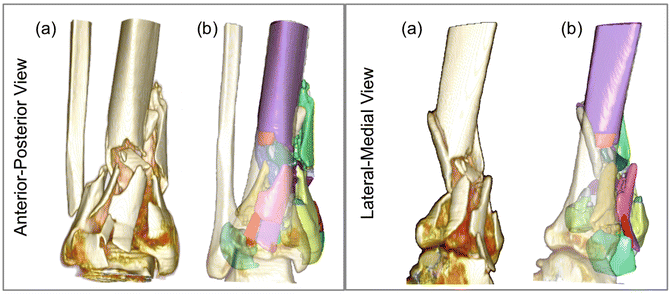
Fig. 24.4
(a) Standard, unsegmented rendering from radiology workstation: visually informative, but with no active functionality. Following segmentation, (b) individual fragments (49 of them in this case) may be readily, and independently studied (transparent surface is intact contralateral, mirrored and aligned proximally) [Taken with permission from Anderson DD, Marsh JL, Brown TD. The pathomechanical etiology of post-traumatic osteoarthritis following intraarticular fractures. Iowa Orthop J. 31:1–20, 2011]
As expected, the three raters had high concordance with each other (Fig. 24.5) ranging from 87 to 91 %. The fracture energy metric had good concordance with the raters’ ranks, ranging from 73 to 76 %, and concordance with the aggregate fragment displacement metric ranged from 82 to 89 %. The metric and clinician opinion are in high concordance with each other. This result provided initial validation of the image analysis approach to objectively measure fracture severity, but unlike the clinician ranks it provided a quantifiable metric of severity for each case.
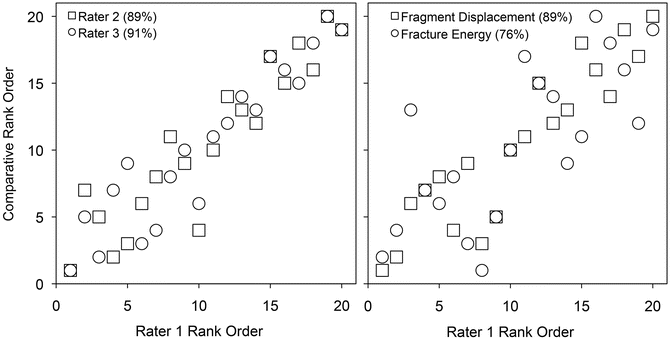
Fig. 24.5
Agreement between injury severity rankings and CT-based metrics. The graphs compare the rank ordering of rater 1 versus that of raters 2 and 3, and of the individual CT-based metrics. Concordance values are enclosed in parentheses following the rater/metric [Taken with permission from Anderson DD, Marsh JL, Brown TD. The pathomechanical etiology of post-traumatic osteoarthritis following intraarticular fractures. Iowa Orthop J. 31:1–20, 2011]
To demonstrate that the CT fracture severity index correlates with meaningful outcomes and with PTOA development, a series of 36 tibial plafond fracture patients who were uniformly treated were prospectively followed [8]. The goal was to assess if functional deficits, symptoms, and the degree of cartilage degeneration on radiographs in articular fracture patients correlate with the CT metrics of the acute mechanical insult. In addition, this study attempted to identify a threshold of acute injury severity that predicts the onset of PTOA.
Related posts:
 Arthritis That Develops After Joint Injury: Is It Post-Traumatic Arthritis or Post-Traumatic Osteoarthritis?
Post-Traumatic Arthritis: Definitions and Burden of Disease
Potential Targets for Pharmacologic Therapies for Prevention of PTA
Arthritis That Develops After Joint Injury: Is It Post-Traumatic Arthritis or Post-Traumatic Osteoarthritis?
Post-Traumatic Arthritis: Definitions and Burden of Disease
Potential Targets for Pharmacologic Therapies for Prevention of PTA
 Outcomes of ACL Injury: The MOON Consortium
 Aging and Post-Traumatic Arthritis
 Biomarkers of PTA
Stay updated, free articles. Join our Telegram channel

Full access? Get Clinical Tree


