where:
P, PTest = predicted and experimental values respectively of peak load,
M, MTest = predicted and experimental values respectively of mean load, and
E, ETest = predicted and experimental values respectively of energy absorption.
When GCI = 0.0, it means there is no correlation at all. A GCI of one (1.0) implies a perfect correlation of numerical model prediction to experimental results. Therefore, a higher GCI indicates a better correlation. Deb et al. [14] was able to achieve a GCI of 0.94 of their FE model in predicting a double top-hat section column component under axial compressive loadings. Again, Haorongbam et al. [15] used the same GCI for assessing FE models in off-set axial crushing on single and double hat sections. A Modified Gross Correlation Index (MGCI) was adopted by Zhu et al. [16] who used optimization-based methodologies to obtain a set of optimal material input properties of die cast AM60B magnesium alloy, which yielded simulated results for both slow-speed and high-speed axial crushing as well as quasi-static four-point bending of thin-walled double top-hat beam components. By selecting the peak load, displacement at the peak load, and energy absorption as metrics, the correlation between the simulated results and test data was made using the MGCI with different weighting factors for evaluating the goodness-of-fit or the degree of agreement. This MGCI reads as:
![$$ GCI=1-{\left[\begin{array}{l}a\cdot \frac{{\left({F}_c-{F}_m\right)}^2}{F_m^2}+b\cdot \frac{{\left({D}_c-{D}_m\right)}^2}{D_m^2}\\ {}+c\cdot \frac{{\left({E}_c-{E}_m\right)}^2}{E_m^2}\end{array}\right]}^{\frac{1}{2}} $$](/wp-content/uploads/2016/09/A31137_3_En_6_Chapter_Equ1.gif)
where
![$$ GCI=1-{\left[\begin{array}{l}a\cdot \frac{{\left({F}_c-{F}_m\right)}^2}{F_m^2}+b\cdot \frac{{\left({D}_c-{D}_m\right)}^2}{D_m^2}\\ {}+c\cdot \frac{{\left({E}_c-{E}_m\right)}^2}{E_m^2}\end{array}\right]}^{\frac{1}{2}} $$](/wp-content/uploads/2016/09/A31137_3_En_6_Chapter_Equ1.gif)
(6.1)
F c, F m : simulated and experimental values of peak load, respectively,
D c, D m: simulated and experimental values of the displacement at the peak load,
E c, E m: simulated and experimental values of energy absorption, respectively;
a, b and c are weighting factors of the parameters F, D and E, respectively, and a + b + c = 1.
The weighting factors a, b, and c can be judiciously chosen depending on importance of their respective metrics.
Results indicate that material constants generated from both these procedures replicate experimentally obtained force–deflection curves and fracture patterns well with a GCI of 0.91. The GCI can be generalized to take any number of parameters into consideration in the following form:
![$$ GCI=1-{\left[\begin{array}{l}\frac{1}{n}\Big\{\frac{{\left({P}_1-{P}_{1 test}\right)}^2}{P_{1 test}^2}+\frac{{\left({P}_2-{P}_{2 test}\right)}^2}{P_{2 test}^2}\\ {}+\frac{{\left({P}_3-{P}_{3 test}\right)}^2}{P_{3 test}^2}+\dots +\frac{{\left({P}_n-{P}_{ntest}\right)}^2}{P_{ntest}^2}\end{array}\right]}^{\frac{1}{2}} $$](/wp-content/uploads/2016/09/A31137_3_En_6_Chapter_Equb.gif) where
where
![$$ GCI=1-{\left[\begin{array}{l}\frac{1}{n}\Big\{\frac{{\left({P}_1-{P}_{1 test}\right)}^2}{P_{1 test}^2}+\frac{{\left({P}_2-{P}_{2 test}\right)}^2}{P_{2 test}^2}\\ {}+\frac{{\left({P}_3-{P}_{3 test}\right)}^2}{P_{3 test}^2}+\dots +\frac{{\left({P}_n-{P}_{ntest}\right)}^2}{P_{ntest}^2}\end{array}\right]}^{\frac{1}{2}} $$](/wp-content/uploads/2016/09/A31137_3_En_6_Chapter_Equb.gif)
P1, P1test = predicted and experimental values respectively of parameter 1,
P2, P2test = predicted and experimental values respectively of parameter 2,
P3, P3test = predicted and experimental values respectively of parameter 3,
etc.
Pn, Pntest = predicted and experimental values respectively of parameter n
Note: P1, P2, P3, ….Pn are to-be-determined parameters of a given material type. It is believed that this generalized GCI can be applicable to practical assessment of quality of CAE generated results against corresponding experimental data.
A remark should be made here that ISO-TR9790 Procedures [17] was specifically developed for evaluation of biomechanical responses of WorldSID prototype dummy, Cesari, Compigne et al. [18], and subsequently adopted by Ruan, El-Jawahri et al. [19] for assessing the biofidelity of the human body FE model in side impact simulations.
6.2.2 Rigorous Approaches
By taking test uncertainty and multi responses into consideration, this set of approaches used more rigorous mathematical treatment with statistical tools and probabilistic approaches for model validation of the dynamic system. When developing a rigorous approach to provide qualitative model validation under uncertainty, statistical hypothesis testing is frequently involved. Oberkampf and Barons [20] published a comprehensive state-of-the-art review of statistical hypothesis testing approaches that can be divided into classical hypothesis testing and Bayesian approach. The Bayesian approach focuses on model acceptance whereas classical hypothesis testing focuses on statistical model rejection. Recently, the Bayesian approach has become widely applied, but a review of those applications is beyond the scope of this chapter. However, Jiang et al. [21] applied Bayesian probabilistic principal component approach for model validation of a child restraint system which can be served as an example of this approach.
Recently, Kokkolaras et al. [22] presented an overview of their most recent and ongoing research efforts in developing a comprehensive frame-work for simulation-based design evaluation of vehicle system. It is the hope that such an approach can be streamlined to become more user-friendly for easy application by modelers in the future. Based on methods described above, it can be seen that the simplistic approach is much easier to apply for faster assessment of model reliability and predictive capabilities.
6.3 MADYMO-Based Rollover and Human Models
Both CAL (Cornell Aeronautics Laboratory) 3D and MADYMO (MAthematical DYnamic MOdel) 3D are the most sophisticated mathematical occupant simulation models, and are widely used in automotive and aerospace industries. These two simulation tools were basically extensions from their respective 2D versions. Currently, MADYMO 3D developed by TNO is marketed through TASS Safety in Netherlands, while CAL3D developed by CAL is maintained by the Air Force Research Laboratory. Since these two packages were previously reviewed in detail by Prasad and Chou [6], and nowadays, MADYMO 3D is widely used in automotive industry, this chapter will discuss only applications of this crash victim simulator (CVS) in rollover and whole body human models.
MADYMO 3D is a whole-body kinematics simulator, also known as gross-motion simulator, which is a class of mathematical models formulated to describe a vehicle occupant in three-dimensional (3D) motion in a crash environment. The occupant is generally assumed to be a set of rigid bodies with prescribed masses and moments of inertia, linked by various types of joints in open- and closed-loop systems known as “tree structures.” Any number of rigid bodies can be used to describe the occupant, resulting in simple to complex models of the occupant. The governing equations of motion of such a collection of rigid bodies are derived automatically in closed form using the Lagrangian or Newtonian approach. A gross-motion simulator, in general, consists of a body dynamic sub-model, a contact sub-model, a restraint system sub-model, and an injury criteria sub-model. In addition, MADYMO has an excellent dummy database consisting of various types, sizes of adult and child dummies. These subsystems and dummy database form the framework for versatile applications to analysis of frontal, side, rollover, and pedestrian impacts, as well as various restraint systems. In the late 90s, FE capability had been added to version 5.0 and its efficiency was improved in version 5.3. This added FE feature allowed MADYMO to expand its modeling capability, thus enabling application further for simulating more complex airbag deployment/interaction with occupants and deformable structural components.
6.3.1 MADYMO-Based Rollover Models
The rollover condition is reviewed because relatively few studies have been conducted due to the need to simulate long duration impacts. Blum [23] explored the feasibility of using MADYMO to simulate rollovers in various conditions. Aljundi et al. [24] gave a brief description of rollover impact simulation using MADYMO Package. Yaniv [25] developed a MADYMO model and validated it against test results for restrained occupant with inflatable tubular structure (ITS). Their model was then exercised to evaluate the effectiveness of ITS in preventing occupant ejection during rollover events. Sharma [26] used the model to help develop a rollover component test methodology for evaluating restraint systems under a Notional Highway Traffic Safety Administration (NHTSA) contract. Renfroe et al. [27] presented the MADYMO modeling of vehicle rollovers and resulting occupant kinematics. Chou and Wu [28] used MADYMO models to simulate different rollover test procedures.
Furthermore, Takagi et al. [29] adopted the MADYMO methodology to simulate occupant behaviors in various rollover initiation types. MADYMO models, in general, give fairly good predictions of vehicle kinematics at the initial and airborne phases during a rollover, and can be applied to: (a) helping establish threshold(s) for rollover sensor system development, and (b) guiding and determine the initial conditions for rollover test procedure development. However, the rigid-body approach cannot predict vehicle structural crush during the contact phases and its effect on occupant kinematics. For predictive structural model development, test data from numerous rollover events and development of FE rollover models are needed.
Rollover models of varying degrees of complexity based on rigid-body and FE assumptions are initially reviewed by Chou et al. [30] and updated by Chou et al. [31]. The analytical studies and model simulations are becoming useful methods for determining the influence of vehicle parameters on vehicle responses in rollovers. MADYMO-based models for simulating vehicle kinematics prescribed in SAE J2114, side curb trip, critical sliding velocity, and corkscrew ramp tests were developed and reported by Chou [32] and Chou and Wu [33]. The rigid-body based MADYMO models are easier to develop and run to provide trend analysis and design direction for rollover testing, sensing systems, and restraint system development. Recently, Gopal et al. [34] used MADYMO and PC-Crash as analytical tools for simulation and testing of a suite of field relevant rollovers.
The CAE methodologies can be developed along with the test methodologies. Experimental data obtained from testing are generally used for developing rollover CAE models that replicate vehicle motion under similar test conditions. Analyses of simulated results provide valuable feedback to help improve and/or enhance the test procedures. Testing with improved/enhanced procedures can provide additional and more accurate data for continued model refinements. MADYMO-based CAE tools can provide high quality models with better simulated and/or predicted results. Generally speaking, MADYMO rollover models consist of sprung and unsprung masses, suspension systems and tires, using characteristics extracted from an ADAMS-based vehicle handling model. Uses of the MADYMO-based models to support rollover testing, rollover sensing algorithm development and rollover protection system development, and many issues associated with rollover CAE simulations were given by Chou [32]. Reviews of rigid-body-based mathematical rollover models indicated that such analytical tools are good for:
Providing test conditions for roll and non-rollover events for a given test mode
Selecting test vehicle configurations for sensor development testing
Supporting countermeasures development
Trend analysis.
However, the quality of signals generated from existing rigid-body-math-based models is not yet mature enough for use in rollover sensor algorithm and calibration [34). Development of rollover models is a continually improving process, which requires experimental data for validation, refinement, and enhancement. With the advancement of computer technology, CAE methodology continues to grow in the use of FE analysis for rollover modeling to study vehicle structural deformation and occupant kinematics interacting with the restraint system and vehicle interior. In addition, an assessment tool for evaluating quality of CAE-generated sensor signals is needed. An example of such a tool that can be mentioned was developed by Le and Chou [35] for CAE generated rollover signal analysis.
In recent years, one area in the advancement of rollover CAE methodology is MADYMO with new suspension capability. The MADYMO program [36] is primarily used to study kinematics/responses of occupants within vehicles as the consequences of impact to these vehicles. Airbags and belt systems can be modeled to investigate how the occupants interact with them. Since MADYMO has the capability in modeling the behavior of tires with the Magic Formula (MF) –Tire model and allows the use of actuators to apply forces or displacements at defined points in a mechanical system, it is therefore feasible to develop a model for studying vehicular dynamics with input characteristics of vehicles. The aforementioned functionalities of MADYMO thus allow engineers to study the vehicle handling capabilities and the rollover crash characteristics with one single model. According to a review article by Chou et al. [31], a trend in modeling approach is to use one software package to model laboratory-based rollover tests using prescribed motion of the vehicular body from either experimental data or output from the vehicular dynamics program. Using a single software package could reduce model development time/cost without needs to translate model output from a vehicular dynamics software into another occupant simulation package.
The feasibility of such a single-model approach was investigated by McCoy et al. [37], who developed a MADYMO model of a mid-size sport utility vehicle, including not only a detailed suspension system translated from the model of a typical SUV from ADAMS vehicle dynamic software package, but also tire characteristics that incorporated the Delft-Tire MF description. The model was completed by adding an actuator that applied a translation motion to the steering rack, which in turn displaced the wheels. A steering wheel and column was also implemented, making it possible to provide input by turning the steering wheel. This model was correlated by simulating a vehicle suspension kinematics and compliance test. The correlated model was then used to simulate a J-turn vehicular dynamics test maneuver, a roll and non-roll ditch test, corkscrew ramp, and a lateral trip-over test. Results indicated that MADYMO was able to reasonably predict the vehicular and occupant responses in these types of applications and was potentially suitable for helping set up a suite of vehicular configurations and test conditions for rollover sensor testing. A sensitivity study was also conducted using the new suspension system for the laterally tripped non-roll event.
6.3.2 MADYMO-Based Human Models
In the early 90s, the advent of dynamic side impact crash test requirements in FMVSS 214 added impetus to the importance of developing human models for predictive human injuries due to insufficient biofidelity of existing side impact dummies. This sort of development was made possible with the advancement of FE technology and injury studies through biomechanics research in the past. There are MADYMO-based, ATB (Articulate Total Body)-based, and FE-based human models currently in the literature. Procedures used to develop FE human models are discussed in Sect. 6.6.2. In this section, only MADYMO-based human models are reviewed.
Huang, King et al. [38] developed a MADYMO 3D whole body model in side impact configurations to predict injury parameters such as TTI (Thoracic Trauma Index), chest compression, viscous criterion (VC), and average spinal acceleration (ASA). The model consists of rigid body segments connected by inextensible joints. The inertial properties used for each of the body segments were based on a 50th percentile male with a body mass of 76 kg. However, the stiffness characteristics of the torso are representative of the human and not an anthropomorphic dummy. Since major emphasis of Huang’s study is on the torso, four segments representing the shoulder, thorax, abdomen, and pelvis were used. Simulation of the soft tissue covering the rib cage was accomplished by using a viscoelastic mini-model. This human model was validated against 17 cadaveric sled tests and 44 pendulum tests on 10 parameters. The average difference between the model outputs and average experimental results was 12 %. This model was used to study the effect of padding on injury parameters for side impact protection.
Happee et al. [39] developed a MADYMO-based human model consisting of a 6-DOF (Degree-of-Freedom) multi-segment spine and neck model with lumped joint resistance for ligament and muscle, and a seven-flexible-body thorax. This model was set up for omnidirectional impact applications, and then to predict human responses (such as kinematics, accelerations, loads, and chest deflection) as in side impact and out-of-position frontal impacts. An anthropometric RAMSIS database, which consists of body height, corpulence, and torso height (relative) of various seated civilian population, was used to develop a MADYMO-based 50th percentile male RAMSIS model for this study. This human model was validated against available volunteer and cadaver data under various test conditions in frontal impacts (volunteers, blunt thorax impact, belted/unbelted) and lateral impacts (thorax). This human model was then applied to study airbag/occupant interaction in out-of-position conditions under which the occupant was also restrained by belts that were simulated with finite elements. The authors reported that crash safety designs based on a real human body model of varying anthropometry are expected in the future.
Van der Horst et al. [40] developed a human head-neck model to study the injury mechanism, with emphasis on effects of muscle response. They improved the detailed head-neck model developed by De Jager et al. [41] by the addition of neck muscles. The model was composed of nine rigid bodies representing the head, the seven cervical vertebrae, and the first thoracic vertebrae. Ellipsoids represented the skull and the vertebrae with spinous and transverse processes, and articular facet surfaces. The bodies were connected through 3D linear viscoelastic disks, 2D nonlinear viscoelastic ligaments, frictionless facet joints, and contractile Hill-type muscles. Muscle geometry was also improved by including more muscles that were divided into a number of segments, thus allowing the muscles to curve around the vertebrae during neck bending. Therefore, the model was called the curved muscle neck (CMN) (Fig. 6.1) and validated against human volunteer data obtained from Hyge experiments for frontal impact at 15 g’s and side impacts at 7 g’s with and without muscle activation. Simulation results indicated that active muscle behavior seemed essential to accurately describe the human head-neck response to impacts.
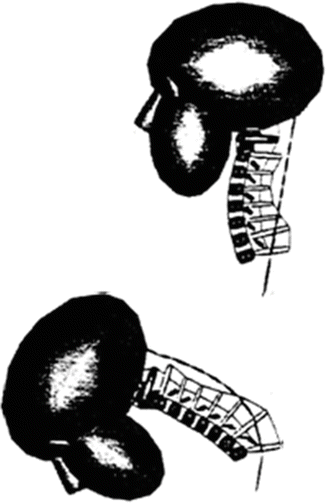

Fig. 6.1
Path of a multi-segment muscle in initial and flexed potions: curved muscle neck model [40] (Reprinted with permission of the Stapp Association)
Early in the 1970s, a number of rigid-body-based pedestrian models had been developed for simulations of pedestrian kinematics upon impact by vehicles; for example, Padgaonkar [42] using CAL3D, Wijk et al. [43] and Janssen and Wismans [44] using MADYMO. In these models, their associated joint properties and body contact characteristics were based on experimental data of early dummies with limited biofidelity, thus not being able to predict accurately the pedestrian kinematics upon car impact.
Since the 1990s, more rigid-body-based models with improved biofidelity for pedestrian safety research has been developed. Ishikawa et al. [45] reported development of a MADYMO 3D pedestrian model consisting of 15 body segments, using geometrical and biomechanical properties taken from anthropomorphic and biomechanical data available in the literature. This model also laid out the underlying basis for various models appeared later in the open literature. Examples that can be mentioned are HONDA model by Yoshida et al. [46], Japan Automobile Research Institute (JARI) model by Mizuno and Ishikawa [47], and a model by Anderson and McLean [48].
Using anatomical knee joint structures, Yang et al. [49] developed a pedestrian model with a human-like knee joints and breakable legs for simulating pedestrian-car interaction, thus enabling study of tibia and fibula fractures. This model was validated against Post Mortem Human Subject (PMHS) test data in overall pedestrian kinematics, body segment responses and injury predictions. As an outgrowth of this model via the scale method, a series of child pedestrian models were developed by Liu and Yang [50]. Additionally, TNO [51] developed a more detailed 50th percentile human pedestrian model consisting of 52 body segments and 64 contact ellipsoids, of which the simulated responses were correlated with those PMHS test data favorably. However, the model still requires further refinements for the knee and shoulder body regions, according to the authors.
6.4 CAE Tools and Critical Aspects in FE Modeling
Developing models for solvers based on rigid body dynamics such as MADYMO was reasonably straightforward. On the other hand, developing an FE model typically requires the use of several software packages. To facilitate user friendliness for creating a simulation model and allowing ease of analyzing simulation results, most mathematical simulation packages have developed pre- and post-processor capabilities. Aside from these solver orientated packages, there are also software packages dedicated to pre- and post-processing works with numerous features for mesh development. Some exemplary software packages are summarized in Table 6.1. In Sect. 6.6.2, additional software needed to process medical images to generate human or animal models will be further discussed.
Table 6.1
Exemplary FE pre- and post-processing software packages
Software title | Company | Location |
|---|---|---|
Hypermesh | Altair | Troy, MI, USA |
FX + Modeler | Midas | London, UK |
ANSA | Beta CAE Systems | Thessaloniki, Greece |
FEMB | Engineering Tech. Associates | Troy, MI, USA |
Patran | MSC Software | Santa Ana, CA, USA |
6.4.1 Mesh Convergence in FE Model
An important, but frequently overlooked, aspect in developing FE models is mesh convergence. Mesh convergence refers to how small the element size should be in an FE model to ensure that simulation results are unaffected by changing the size of the mesh. There are three main reasons for this oversight. First, an FE model with high mesh density may not be solvable when computing resources are limited. This issue is no longer a critical one as newer computers are capable of handling a large quantity of random access memory. Second, developing FE models with a different mesh density requires significant effort. Unless each refinement represents a division of one 3-D element into eight elements (that is, dividing each edge of an element into two), substantial laborious work is involved when refining a mesh. While this issue currently persists, it is less critical now because there are software packages which allow users to parameterize the mesh so that little effort is needed to adjust the mesh density (e.g. Mao et al. [52]). Still, refinement of the mesh using such automatic meshing software usually has limitations if the parameterized surface is poorly formulated and there is no guarantee that the refined mesh will be of high quality. Third, many research groups have in their databases a number of numerical models available and hence have a tendency to take an old model that was previously published for use in a new loading condition without testing for convergence to ensure that the mesh density is sufficient to solve the new problem.
To check for convergence, strains or stresses in several regions of interest are computed and plotted as a function of mesh density. If simulation results from two FE models with different mesh densities differ within a few percentage points of each other, then mesh convergence has been achieved. Otherwise, continued refinement of the mesh should be carried out and the FE simulation repeated. Typically, differences in strains or stresses in two consecutive refinements will decrease as the mesh is refined. Eventually, the difference will be sufficiently small so that convergence is deemed to be achieved. In some cases, such as impact of soft tissue by a very small diameter indenter or pendulum, convergence is very difficult to achieve due to the large deformation confined to a small region. In this case, a report must be generated to indicate how far away the mesh is from full convergence. Although some advanced FE solution methods are, in theory, not affected by mesh size, testing for convergence is a recommended practice in any laboratory/institution in the event that the software does not live up to its expectation.
6.4.2 Material Model Verifications
FE models need to be validated at the material and sub-system levels first prior to a system level model can be reliably used to predict the system behaviors. Engineering materials, such as mild steel and aluminum, are well described in literature. Their constitutive laws and associated material properties are well investigated and published. On the other hand, newly developed alloy (such as magnesium alloy for example) designed to reduce vehicular weight while maintaining high material strength is less explored. Similarly, constitutive laws and associated properties for biological tissues are not readily available and require a great number of assumptions in choosing the material properties.
Many of the new materials cannot be fully described with linear elastic models. Some FE software packages now offer a large number of material libraries for users to choose from. Because developing suitable constitutive laws for new materials requires much greater efforts, alternative material laws can be used to reasonably replicate the behaviors of such material while new or refined constitute laws are being developed. Zhu et al. [16] successfully modeled a novel die case magnesium alloy AM60B by investigating the possibilities of using MATs 24, 88, 99, and 107, all with varying degree of strain rate effect and failure simulation capabilities, available in LS-DYNA. Design optimization procedures were used to compare simulation results with physical tests including coupon testing from quasi-static to 800 s−1 strain rate, and four-point bending and crush testing of thin-walled structural components. A goodness fit procedure using GCI as described in Sect. 6.2 was used to judge which material law provided the best fit for all test conditions. Iterative procedures were continued until new material laws are validated.
In engineering materials, specimens are abundant and can be machined into specific sizes for testing under various loading conditions to identify/determine the properties. Biological tissues are not easily obtained and exhibited greater variations due to different age, gender, ethnicity, among other reasons. These tissues are very compliant in nature and hence difficult to control the exact geometry of the test specimen. Partially due to inaccurate geometry utilized in determining material properties, extremely large variations were observed in literature for biological tissues. As a result, selecting any parameters to represent biological tissues seems acceptable, although it is fundamentally erroneous. To account for specimen-to-specimen variations in geometry by removing the geometric effect in physical testing, Guan et al. [53] utilized specimen-specific FE models to identify material properties through reverse engineering procedures. It was concluded that properties obtained through this set of rigorous procedures can better represent the material behavior. Figure 6.2 shows the procedures deemed appropriate when investigating very compliant biological tissues for implementation as material properties in numerical models. Currently, laser or micro CT or MRI scanning is in place to obtain specimen-specific geometry. Specimen-specific FE models can then be developed before reverse engineering methods can be applied through optimization procedures to identify material properties.
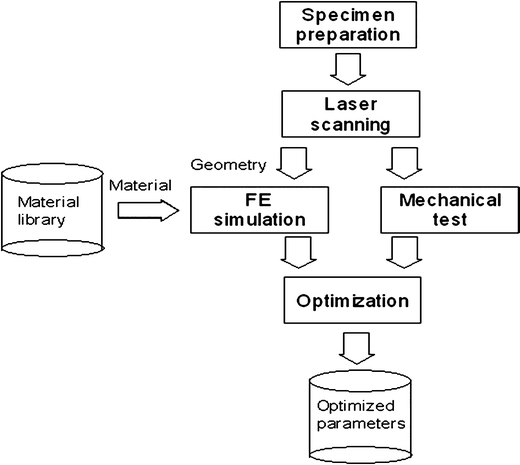

Fig. 6.2
Procedures to identify accurate material properties of very compliant biological tissues. High resolution laser or micro CT, micro MRI scanning is used to identify specimen-specific geometry while reverse engineering method is used in conjunction with optimization procedures to determine high fidelity properties
6.4.3 Procedures in Meeting Safety Regulations
Aside from governmental regulations, such as FMVSS (Federal Motor Vehicle Safety Standard), there are also consumer-based organizations (such as NCAP organizations throughout the world and IIHS) prescribing the minimum safety requirements each vehicle should possess. To meet all these regulatory and non-regulatory requirements is a monumental task for safety engineers. With the advancement of CAE tools used in design of new product, more and more cars are meeting all regulatory standards and non-regulatory requirements with good rating. This section describes a basic set of procedures that can be used in CAE process to help meet these standards and/or test protocol requirements.
At the onset of designing a safe vehicle, engineers are to gather the information related to intended design boundaries such as target buyer, price range, safety rating, corporate average fuel economy (CAFE), etc. The following three-stage CAE processes can be used in conjunction with physical testing to achieve the desired design goals. The first stage is to complete a CAE material library which includes commonly used material models and associated constants. In the second stage, critical structural load bearing components related to crash energy management are meshed with coarse mesh FE model to obtain the target crash pulses. Experiments are conducted on either a body-in-white prototype or a previously developed vehicle platform to check the fidelity of the coarse mesh model. Once the energy absorption characteristics fit the desired goal, a detailed FE model of the entire vehicle can be created and simulated. Iterative procedures between experimental validation and refinement of the FE model are needed to account for any simplifications assumed in the FE model. Figure 6.3 shows the three stages of this design process via CAE approaches.
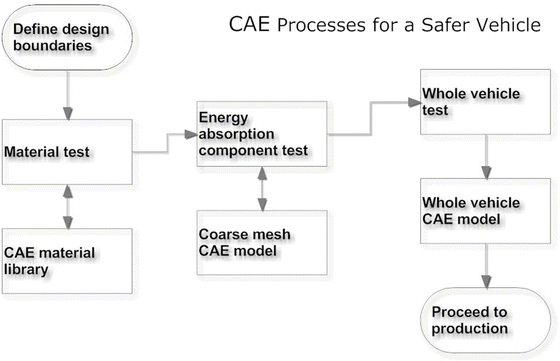

Fig. 6.3
Overall schemes of using CAE tools to meet regulatory and non-regulatory requirements
The objective of the first stage is to create (and maintain) a material library for CAE related activities. For each material needed to manufacture a vehicle, a material model should be developed with proper material laws (such as linear elastic, viscoelastic, etc.). Specimens are then cut into the desired shape and dimensions, and tested under different test modes and loading rates. Results from these experiments are compared with the FE material model. The model will be corrected if there is any mismatch between the model-predicted and experimentally obtained results. This set of procedures will continue until all materials needed to manufacture a car are available. Figure 6.4 shows this set of iterative procedures in establishing the material library. In some CAE software packages, such as the virtual proving ground (eta/VPG) developed by ETA, a library consisting of many commonly used materials is available but users are recommended for additional checking to account for different manufacturing processes.
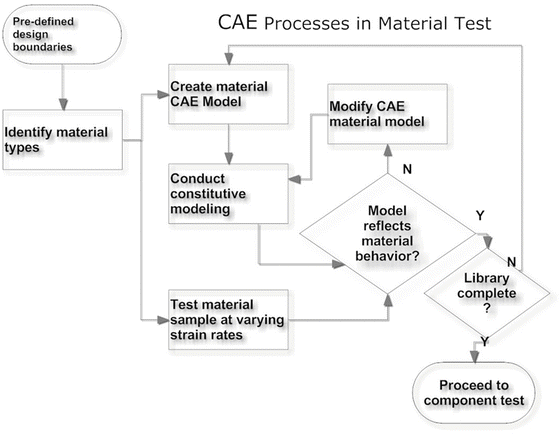

Fig. 6.4
Steps recommended for setting up a material library for CAE applications
In the second CAE stage, it is critical to meet ideal crash pulse targeted for crash energy management. In the early stage of designing a safe car, the important issue is to set the design specifications for all major structures. A common practice is to develop a FE model consisting of critical energy absorption components to set up the load path in order to manage crash energy absorption for crashworthiness study. If the model-predicted crash pulse is far from the targeted idealized one (i.e., equivalent square wave, or crash pulse of an image car), the CAE model is modified and the processes repeated until idealized crash pulses are achieved. At this time, a prototype consists of these components are built (or modified from a previous production car) and tested at different impact modes to determine the fidelity of the FE model. Again, iterative procedures are needed to correct/refine the FE model until its predictions fit experimental results meeting certain validation criteria established consensually by CAE engineers. Successful completion of the coarse mesh model at this stage can be used to design the entire vehicle. Figure 6.5 shows the iterative procedures at this stage of the design.
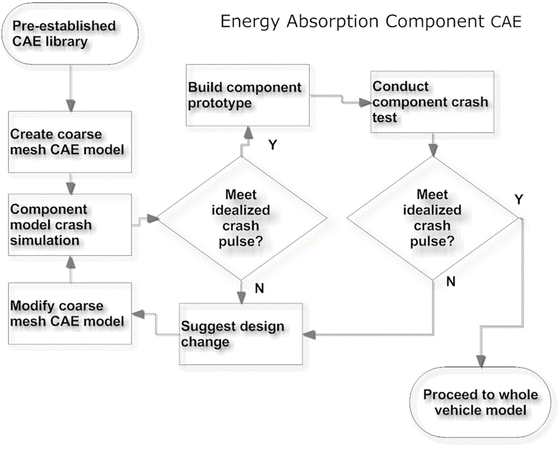

Fig. 6.5
Schemes for setting up a model consisting of critical energy absorption components for basic crash energy management
In the third stage of the design, occupant models are integrated into detailed FE vehicle model to determine if occupant responses meet the intended design safety rating target. Modifications will be made until the occupant responses meet the targeted star rating. At this stage, the FE model, when validated with predictive confidence, may also be used to generate signals for various crash modes required for the algorithm development for airbag sensing system among other things. Based on the satisfied FE model, a prototype vehicle will be developed and tested according to regulatory safety standards. Variations between test results and model predictions need to be resolved and solutions documented as “lessons learned” for future reference in modeling and hand-on-training of future safety engineers. Figure 6.6 shows this set of CAE processes.
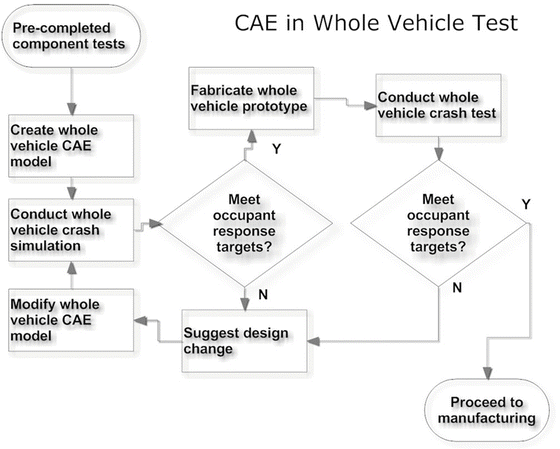

Fig. 6.6
A schematic diagram showing the last stage of CAE processes to design a safer vehicle with the desired star rating
6.5 FE-Based Models
As mentioned previously, FE-based models are the primary choice of CAE simulation tools recently because they can be used for both structure and occupant modeling and the speed of computer has been improved to an acceptable level. Additionally, it is more cost-effective to use only one software package so that engineers need to be trained to use one package only. In this section, exemplar CAE methodologies are presented for frontal impact, side impact, and rollover analyses.
6.5.1 Frontal Impact
Frontal impact tests may include the following crash test modes in accordance with regulatory, non-regulatory and sensor development requirements:
Full rigid barrier impact
Offset rigid barrier or deformable barrier impact
30° right/left angular impacts
Center pole impact
Small offset impact (IIHS test protocol)
Over-ride and under-ride impacts
CAE analyses can be carried out using both rigid-body and FE-based methods for occupant and structural analyses depending on complexity of the problems at hand.
Figure 6.7 shows a schematic diagram of a frontal crash event, which can be considered as a three-impact event. In the first (primary) impact, the vehicle strikes a barrier or another car, causing the front-end to crush. Kinetic energy of the vehicle is expended in deforming the vehicle’s front structure. The design of the front-end, rear, or side to crumple in a collision and absorb crash energy is called crash energy management or crashworthiness of a vehicle.


Fig. 6.7
Schematic of a frontal crash event
The second (secondary) impact occurs when the occupant continues to move forward as a free-flight mass and strikes the vehicle interior or interacts with or loads the restraint system. Some of the kinetic energy is expended in deforming the vehicle interior or the restraint system, and in compressing the occupant’s torso. The remaining kinetic energy is dissipated as the occupant decelerates with the vehicle.
The first and the second impacts are frequently discussed in frontal impact analyses. Now, a third impact can be added concerning with brain impact against skull or internal organs within human skeleton, when the occupant impacts the vehicle interiors. This phase of impact analysis needs to be addressed using human models.
The crash event shown in Fig. 6.7 results in vehicle response and occupant response as exhibited in Fig. 6.8. Analysis of results of these two responses contributes to the evaluation of vehicle performance and occupant safety. Referring to Fig. 6.8, the vehicle response is primarily due to collapse of energy absorbing members of front-end structures, interaction and stack-up of rigid structural components (i.e., engine, transmission, steering box/gear, etc.), depending on packaging of power-train and accessories and available crush space. Depending on the impact velocity and crash energy management, intrusion of the engine into the occupant compartment may or may not occur. Such vehicle responses, often referred to as the crash pulse, can be recorded by accelerometers mounted at the un-deformed occupant compartment locations. In the meantime, the responses of occupant are measured for each body region (i.e., head, neck, torso, pelvis, leg, lower extremity) with instrumented dummy as occupant moves within the vehicle compartment. These measurements are in form of time histories of acceleration, force, displacement, etc. Dummy injury performance numbers can be calculated for HIC (Head Injury Criterion), Nij (neck), Chest G’s, chest deflection, femur load, and tibia index, etc.
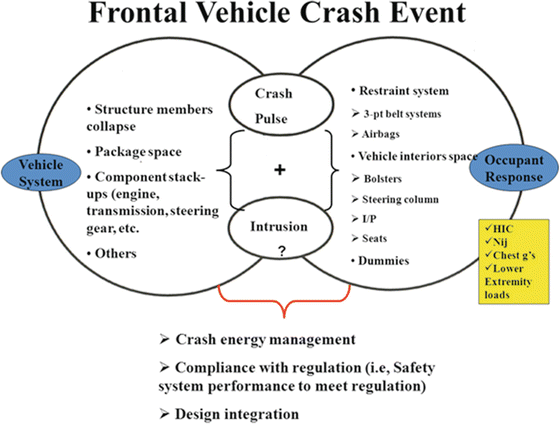

Fig. 6.8
Components of a frontal vehicle crash event
Based on results of both the vehicle and occupant responses, crash energy management of the vehicle and compliance with regulations (i.e., safety restraint system performance to meet mandated regulation) can be assessed. Traditionally, such assessment is carried out by crash testing of prototypes in laboratory environments. With the advancement of computer and CAE software, numerical methods help greatly in shorting the product development cycle and cost savings.
The crash pulse obtained from physical crash tests described above can be used as a forcing function for direct input into MADYMO occupant models to study the occupant kinematics for assessing potential occupant injury risk. Occupant response data obtained from crash tests also provide useful information for validating the occupant CAE model. In addition, a crash pulse can be idealized to become an equivalent square wave or two-step function for target pulse setting for future vehicle development.
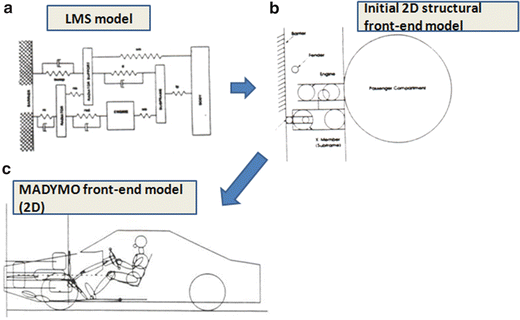
Along with the line of numerical analysis, early stage frontal impact simulations can be performed using a classical lumped-mass-spring (LMS) method as shown in Fig. 6.9a, where a vehicle front end is represented by a five-mass model in addition to a barrier mass in a 90° frontal impact with a fixed rigid barrier test configuration. The masses are connected by non-linear spring and damper elements to account for energy absorbing characteristics of structural members, such as bumper, radiator support and fore and aft portions of upper and lower rails, etc. The load-deflections of these non-linear spring characteristics can be obtained from static crusher test or from FE analysis of corresponding structural components. LMS models are in general considered as the simplest model, whose parameters, i.e., spring characteristics, relative positions between rigid components, can be further utilized for developing an integrated front-end model with an occupant model as shown conceptually in Fig. 6.9b using MADYMO, and can be further developed to become a better representation of an integrated structure and occupant model as shown in Fig. 6.9c [54]. Such an integrated model allows simultaneous simulations of the vehicle and occupant responses, without inputting the crash pulse, which is actually generated in the model. However, both the LMS and MADYMO-type models mentioned above are semi-empirical (or semi-analytical) approach, which required structural characteristics are a priori. More complex numerical simulation of full vehicle in frontal impact can resort to FE method approach.

