Fig. 22.1
Photograph of the experimental intervention – a life jacket with additional mass of 12.4 kg. The life jacket was securely fastened to the athletes and the additional mass elements were located at the bottom of the jacket close to the body centre of mass
Since available traction at the foot-ground interface can influence the execution of linear acceleration (Alexander 2002), the same pair of testing footwear with sufficient traction was used across subjects and conditions. Available traction between the testing footwear and laboratory floor was quantified mechanically with a previously validated protocol and its value (traction coefficient of 1.13) exceeded the required amount (traction coefficient of 0.82) for maximum acceleration performance (Luo and Stefanyshyn 2011). The footwear was cleaned between trials, and the floor surface was cleaned between conditions.
22.2.3 Protocol
After a 20-min warm-up session, the athletes performed maximum-effort acceleration with and without the additional mass. They started with four maximum-effort acceleration sprints in the control condition. Then they performed eight trials in the additional mass condition. After the additional mass trials, the athletes repeated four trials in the control condition. To reduce the confounding effects of learning, three practice trials were required before each condition change. To minimize the influence of fatigue, a minimum of a 3-min resting period was given between trials. To detect if there existed any learning and/or fatigue effects, the propulsive ground reaction impulse was compared between the control trials performed before versus after the additional mass condition using two-tailed paired t-tests (α = 0.05). Two athletes showed a significant reduction in propulsive impulse generation in the second control trials and were thus excluded from further analyses.
22.2.4 Data Analysis
Raw ground reaction forces and marker positions were filtered with a fourth-order recursive Butterworth low-pass filter at a cut-off frequency of 60 and 20 Hz, respectively. Ninety-nine percent of the integrated power content of the original signal was contained by the filtered data. Due to the nature of the movement task, sagittal plane ground reaction force and body marker data were then analyzed. Vertical ground reaction force was used to define stance intervals with an onset threshold of 3 % body weight.
The sagittal plane resultant ground reaction force was used to represent limb force. The peak resultant ground reaction force defines the maximum limb force generation within each condition. Stance-average propulsive and vertical limb force were determined and compared, as these vectors represent the overall force application over stance.
Body lean was quantified using effective leg kinematics. The effective leg was defined as the vector pointing from the centre of pressure to the body centre of mass. Centre of pressure was calculated using force signals and force-plate specifications. Body centre of mass was estimated using the three markers placed on the pelvis. During quiet standing trials performed prior to the acceleration, the vertical location of the estimated centre of mass was calculated as the average height of the markers; the horizontal location of the estimated centre of mass was defined as the point where the ground reaction force vector intersected with the horizontal plane at the aforementioned height. Transformation matrices between the standing trial and each movement frame were calculated using the pelvis markers. These transformation matrices were then applied to the standing centre of mass to calculate its location during acceleration (Söderkvist and Wedin 1993). Effective leg angle in the sagittal plane was calculated over stance. Body lean was expressed as the angular deviation from the vertical axis (0°: vertical; positive angles: leaning forward; negative angles: leaning backward).
Two-tailed paired t-tests were used for the statistical analyses. Statistical significance level was set a priori at α = 0.05.
22.3 Results
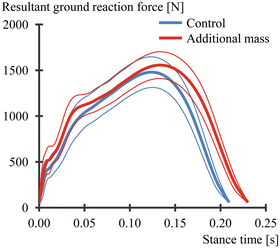
Peak resultant ground reaction force increased significantly from the control to the additional mass condition (control: 1,502.9 ± 152.9 N, additional mass: 1,572.5 ± 143.0 N; p < 0.001; Fig. 22.2). Averaged over stance, the resultant ground reaction force was observed to be significantly larger in the additional mass condition compared to the control (Table 22.1).


Fig. 22.2
Sagittal plane resultant ground reaction forces exerted during maximum-effort acceleration in the control and additional mass conditions. Thick lines are the athlete sample average, and the thin lines are the ±1 standard deviation. When accelerating with the additional mass, the athletes were capable of generating a peak limb force 5 % greater than control
Table 22.1
Variables derived from ground reaction force data. The listed values are the athlete sample averages ±1 standard deviation
Control | Additional mass | p-values | |
|---|---|---|---|
Average resultant force [N] | 984.4 ± 100.9 | 1,060.7 ± 89.6 | <0.001 |
Average vertical force [N] | 900.9 ± 95.3 | 986.3 ± 86.6 | <0.001 |
Average propulsive force [N] | 362.9 ± 43.2 | 349.9 ± 37.8 | 0.045 |
Stance time [ms] | 210.6 ± 27.8 | 230.1 ± 26.1 | <0.001 |
Peak force instance [% Stance] | 57.8 ± 5.6 | 57.5 ± 4.0 | 0.659 |
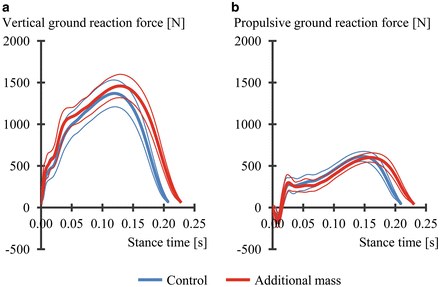
The differences observed in resultant ground reaction force could largely be attributed to the changes in vertical ground reaction force. Peak vertical ground reaction force increased from 1,393.7 ± 147.8 N in the control to 1,475.7 ± 134.5 N in the additional mass condition (p < 0.001; Fig. 22.3a), meanwhile no significant difference was detected for the peak propulsive force (control: 621.8 ± 57.3 N, additional mass: 607.1 ± 53.2 N; p = 0.098; Fig. 22.3b). Averaged over stance the vertical ground reaction force increased by 9.5 % while a 3.6 % decrease in net propulsive force was observed in the additional mass condition compared to the control (Table 22.1).


Fig. 22.3
Ground reaction forces in the vertical, Figure (a), and propulsive, Figure (b), directions. Thick lines are the athlete sample average, and the thin lines are the ±1 standard deviation. While the vertical force varied significantly, the peak propulsive force remained unchanged between conditions
Over stance, the athletes adopted a more upright effective leg posture accelerating with an additional mass compared to the control (Table 22.2).
Table 22.2
Kinematic parameters of the effective leg. Effective leg is defined as the vector pointing from the centre of pressure to the body centre of mass. 0° represents upright, and positive angles represent leaning forward. The listed values are the athlete sample averages ±1 standard deviation
Control
Stay updated, free articles. Join our Telegram channel
Full access? Get Clinical Tree
 Get Clinical Tree app for offline access

|
|---|


