Fig. 28.1
The definition of the foot coordination system. The origin is located on the calcaneus and is at the upper edge of the posterior surface. The calcaneus and the first and fifth metatarsal extension lines define the X-axis, and the positive direction of the X-axis is anterior. The Y-axis is orthogonal to the X-axis and its positive direction is superior. L1 represents the straight line that links the calcaneal tubercle and the anteroinferior aspect of the calcaneus. L2 represents the dorsal aspect of the first metatarsal shaft. L3 represents the dorsal aspect of the fifth metatarsal shaft. The medial arch angle is defined as the obtuse angle formed by L1 and L2. The lateral arch angle is defined as the obtuse angle formed by L1 and L3 (Fukano and Fukubayashi 2012). Notice: This is the author’s version of a work accepted for publication by Elsevier. Changes resulting from the publishing process, including peer review, editing, corrections, structural formatting, and other quality control mechanisms, may not be reflected in this document. Changes may have been made to this work since it was submitted for publication. The definitive version has been published in The Foot, 22(1):2011. doi:10.1016/j.foot.2011.08.002

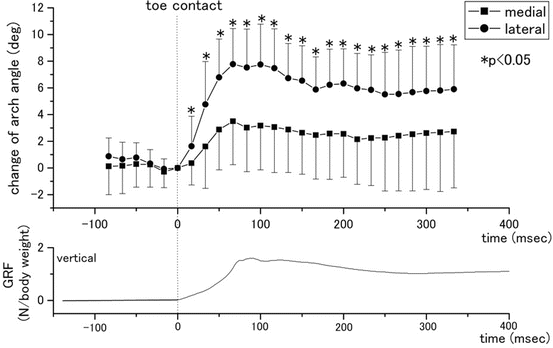
Fig. 28.2
The mean results of the quantitation of the angular change of the medial and lateral longitudinal arches. The square plot shows the medial longitudinal arch. The circle plot shows the lateral longitudinal arch (Fukano and Fukubayashi 2009)

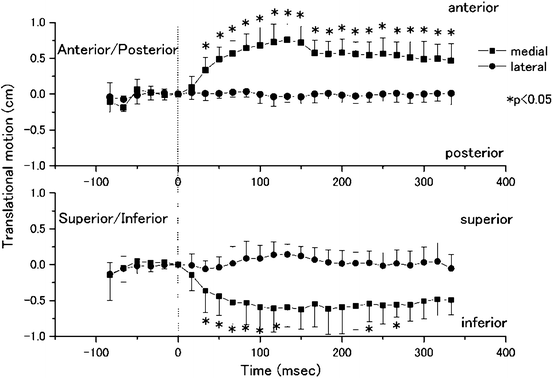
Fig. 28.3
The mean results of the translational motion of the medial and lateral longitudinal arches. The square plot shows the displacement of the distance of the calcaneus to the first metatarsal. The circle plot shows the displacement of the distance of the calcaneus to the fifth metatarsal (Fukano and Fukubayashi 2009)

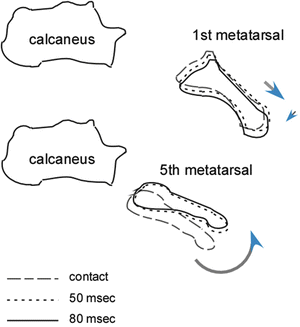
Fig. 28.4
Motion difference of the first and fifth metatarsals with respect to the calcaneus (Fukano and Fukubayashi 2009)
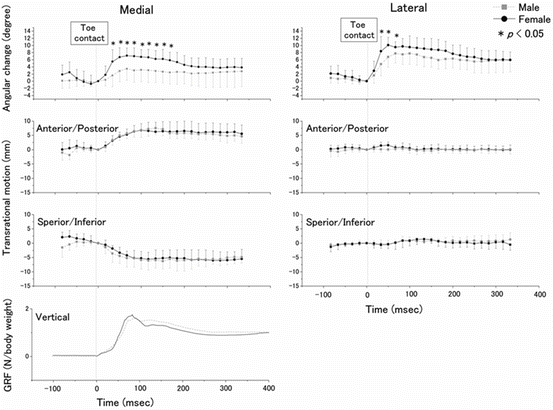
To determine the gender differences in arch deformation, we compared the first and fifth metatarsal bone positions with respect to the calcaneus (Fig. 28.1) between male and female subjects using fluoroscopic images taken during landing. Foot images in the static condition (no-load and loaded [single-leg standing] position) and during a single-leg landing from a 10-cm height were obtained using lateral fluoroscopy at 60 Hz in 11 healthy male and 8 healthy female subjects. In the static condition, the MLA and LLA of the female subjects were significantly greater than those of the male subjects in the loaded position; however, each arch was comparable between the two groups in the no-loaded condition (Table 28.1). The angular change of both arches was significantly greater in the female than in the male subjects (Fig. 28.5). These results suggest that females have a greater range of arch motion than males under static and dynamic loaded conditions (Fukano and Fukubayashi 2012).

Table 28.1
Average values and standard deviations of the arch angles of male and female subjects in the static condition
Arch angle (in degrees) | Mean (SD) males | Mean (SD) females | Significance | (p-Value) | |
|---|---|---|---|---|---|
No load | Medial | 129.5 (5.8) | 129.8 (2.6) | n. s. | (p = 0.99) |
Lateral | 138.2 (6.2) | 141.2 (1.3) | n. s. | (p = 0.46) | |
Loaded | Medial | 130.3 (5.9) | 136.2 (2.3) | * | (p = 0.01) |
Lateral | 144.9 (6.1) | 148.9 (1.3) | * | (p = 0.03) |

Fig. 28.5
Comparison of the degree of angular change and the translational motion of the medial and lateral longitudinal arches between males and females. The gray square and black circle plots are the values for the males and females, respectively. GRF ground reaction force (Fukano and Fukubayashi 2012). Notice: This is the author’s version of a work accepted for publication by Elsevier. Changes resulting from the publishing process, including peer review, editing, corrections, structural formatting, and other quality control mechanisms, may not be reflected in this document. Changes may have been made to this work since it was submitted for publication. The definitive version has been published in The Foot, 22(1), 2011. doi:10.1016/j.foot.2011.08.002
28.3 Ankle Kinematics
In recent years, quantitative evaluations of the ankle joint, which consists of the talocrural and subtalar joints, have been inadequate. However, this subject is important in the field of orthopedic and sports medicine because: (i) ankle joints function as a shock attenuator together with the foot; (ii) subtalar joint kinematics may be associated with subjective ankle instability in patients with chronic ankle instability; and (iii) subjective ankle instability (which may be associated with subtalar joint kinematics) could be an impediment to sports performance. Unfortunately, there is no international standard for evaluating talocrural and subtalar joint kinematics. A highly accurate method for measuring the movement of the talus has not been established, since errors due to deformation of the skin and the plantar soft tissue are large with respect to the bony movement of the foot. Thus no reference data from healthy subjects are available. Therefore, discussions based on quantitative data are difficult, and a functional knowledge about injury mechanics or prevention is based only on qualitative observations and textbook descriptions.
Studies with radiographic images acquired by fluoroscopy or cineradiography to analyze the detailed kinematics of joints during dynamic movement are increasingly available. The three-dimensional (3D)-2D model-based registration technique (MBRT) is a method that provides for a detailed analysis of 3D in vivo joint kinematics, by matching bone models created using 3D computed tomography and time-series radiographic images. MBRT was mainly used for the knee joint after 2000, but has been more recently applied to ankle joints in the development of total ankle replacement surgery. Some groups have performed a highly accurate analysis using orthogonal fluoroscopes and have estimated the length of the anterior talofibular ligament (Caputo et al. 2009).
Stay updated, free articles. Join our Telegram channel

Full access? Get Clinical Tree


