Glycemic control
HbA1C
GA
Excellent (HbA1C≤6 %, GA≤18 %)
307 (57.1 %)
152 (28.3 %)
Good (6 %<HbA1C≤7 %, 18 %<GA≤21 %)
128 (23.7 %)
106 (19.7 %)
Good (7 %<HbA1C≤8 %, 21 %<GA≤24 %)
65 (12.1 %)
84 (15.6 %)
Poor (8 %<HbA1C, 24 %<GA)
38 (7.1 %)
196 (36.4 %)
Accordingly, this means that glycemic control of DM HD patients is being less strictly managed than is optimal – a key point in understanding the high rates of bone metabolism disorders and vascular calcification in DM HD patients.
7.3 Low-Turnover Bone Loss in DM Patients
Because osteoblasts contain insulin and insulin growing factor (IGF)-1 receptor, the lack of these factors impairs osteoblast function, leading to low-turnover bone loss. Accordingly, most of type 1 DM patients with absolute insulin deficiency exhibit bone loss, because type 1 DM develops before reaching bone peak mass around the age of 20 years [6–8].
Meanwhile, type 2 DM patients are known to exhibit decreased osteoblast function with worse glycemic control [9]. Therefore, in a sustained hyperglycemic state, the same low-turnover bone loss seen in type 1 DM occurs even without an insulin deficiency. Furthermore, the tumor necrosis factor that is involved in the pathology of type 2 DM impairs osteoblast function and promotes osteoclast function [10]. It has been reported that the bone mass of type 2 DM patients who have had the disease for 5 years or longer is significantly decreased compared to normal individuals [11]. However, in some disease stages of type 2 DM, factors that are favorable for bones such as obesity or hyperinsulinemia may become dominant. Therefore, bone turnover and bone mass are not necessarily decreased in type 2 DM like in type 1 DM.
7.4 High-Turnover Bone Loss in CKD Patients
When vitamin D is absorbed from the intestinal tract, 25-hydroxylation in the liver and 1-alpha- hydroxylation in the kidneys activate the vitamin D (1,25(OH)2D) so that it exhibits effects. However, decreased kidney function lowers the amount of 1-alpha-hydroxylase, therefore leading to a decrease in 1,25(OH)2D. This impairs reabsorption of calcium from the intestinal tract, causing hypocalcemia and promoting the secretion of parathyroid hormones (PTH). Decreased nephron number accompanying decreased kidney function lowers the amount of phosphate excretion in urine, leading to elevated serum phosphate levels. This encourages secretion of fibroblast growth factor (FGF)-23, a bone-derived phosphaturic hormone [12]. Increased serum FGF-23 levels also lower 1,25(OH)2D through decreased 1-alpha-hydroxylase activation, promoting PTH secretion [13]. Through these mechanisms, particularly in stage 3 or higher CKD patients who have GFR of below 60 ml/min/1.73 m2, decreased GFR lowers serum 1,25(OH)2D levels [14], causing serum PTH levels to rise [15]. Thus, CKD patients develop secondary hyperparathyroidism as their CKD stage progresses. As a result, high-turnover bone metabolism is exhibited, causing decreased bone mass.
7.5 Histological Classification of Renal Osteodystrophy
After tetracycline double labeling, iliac bone biopsy specimens underwent histomorphometry, and measurements including osteoid mass, fibrous tissue mass, and ossification rate, etc. were calculated. Based on these, bone metabolism abnormalities accompanying CKD were classified into the five types shown in Table 7.2 [16]. A general name for this condition is renal osteodystrophy (ROD). Conventionally, osteitis fibrosa (OF) type accompanying secondary hyperparathyroidism was frequent. However, the recent increases in the number of people with DM and overtreatment with calcium or vitamin D preparations have led to an increase in adynamic bone disease (ABD) type.
Table 7.2
ROD histological classifications
Osteoid mass (%) | Fibrous tissue mass (%) | Ossification rate (%) | PTH concentration | ||
|---|---|---|---|---|---|
OV/BV | OV/TV | Tb. V/TV | BFR/BV | ||
OF | <15 % | <3 % | >0.5 % | Accelerated | High |
MIX | >15 % | >3 % | >0.5 % | Normal–low | Mildly elevated |
OM | >15 % | >3 % | <0.5 % | Low | Normal–mildly elevated |
MIL | <15 % | <3 % | <0.5 % | Normal | Normal–mildly elevated |
ABD | <15 % | <3 % | <0.5 % | Low | Low |
OF is a type of high-turnover bone metabolism abnormality in which excessive secretion of PTH causes abnormally increased bone turnover. Lamellar bone with normal stratification decreases and is replaced with reticular woven bone, increasing fibrous tissue. In osteomalacia (OM) type, 1,25-dihydroxyvitamin D3 (1,25(OH)2D3) deficiency and deposition of aluminum and iron in the mineralization front impair calcification, causing abnormal osteoid proliferation. The calcification disorder leads to a lowered ossification rate. Mixed type cases exhibit mixed OF and OM histology, with both increased fiber components and increased osteoids. This pathology is also considered a subtype of secondary hyperparathyroidism. In the mild change type (MIL), bone state is almost normal.
ABD cases initially appear to exhibit histology results identical to MIL cases. However, they can be distinguished by the fact that there is hardly any uptake of the tetracycline labeled prior to the biopsy. Therefore, it can be considered to be a low-turnover bone metabolism disorder in which bone turnover is extremely decreased. Risk factors for ABD onset include decreased PTH secretion due to aging or after total parathyroidectomy, excessive doses of calcium or vitamin D preparations, or relative deficiency accompanying decreased PTH responsiveness of bone due to accumulation of aluminum or iron. In DM patients, direct effects on parathyroid cells accompanying a hyperglycemic state could inhibit PTH secretion [17]. However, currently, the molecular mechanism and physiological significance have yet to be clarified.
7.6 Bone Metabolic Markers
It is extremely important to grasp the histological type of ROD. However, bone biopsy, which is the current gold standard for diagnosing ROD, is highly invasive, and it is not practical to perform it in routine clinical practice. Therefore, bone metabolism marker measurement is recommended. The measurement of bone metabolism markers makes it possible to accurately and simply grasp the current state of bone metabolism. Bone metabolism markers are biological markers that reflect the state of bone resorption and formation at the time of measurement. As bone formation is stimulated by bone resorption, elevation of bone resorption and formation markers signifies the promotion of bone resorption-dominant bone metabolism.
For example, if PTH is extremely high and both formation and resorption markers greatly exceed the upper limit of the normal range, OF type is highly likely. Meanwhile, if PTH elevations are inhibited and bone formation markers have dropped to below the lower limit of the normal range, the case is likely low-turnover type – ABD. If bone metabolism markers are within the normal range but blood aluminum and/or iron levels are high, OM type should be taken into consideration and bone biopsy performed.
However, because there is the risk that in CKD patients, bone metabolic markers that accumulate in serum with decreased kidney function will exhibit false high values that are greater than the increased bone metabolism accompanying hyperparathyroidism onset, it is best to use bone-specific alkaline phosphatase (BAP) as a bone formation marker and tartrate-resistant acid phosphatase isoform 5b (TRACP 5b) as a bone resorption marker as these markers are not greatly influenced by decreased kidney function [18].
7.7 Bone Mass of DM HD Patients Is Maintained at a Higher Level Than Non-DM HD Patients
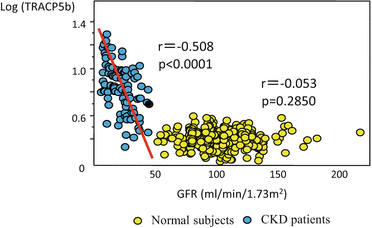
In general, secondary hyperparathyroidism starts to appear in CKD patients when GFR falls below 60 ml/min/1.73 m2. Bone metabolism markers rise almost directly along with this (Fig. 7.1), causing marked high-turnover type decreased bone mass and OF type bone lesions. However, because PTH rises tend to be suppressed in DM patients, bone turnover is not as greatly increased as in non-DM patients. Accordingly, low-turnover, gradual bone mass decreases are seen in DM patients and ABD type bone lesions are exhibited.


Fig. 7.1
Relationship between GFR and bone markers. Data from our past research. Generally, secondary hyperparathyroidism starts to develop when GFR drops below 60 ml/min/1.73 m2. In accordance with this, bone markers rise in a relatively straight line, and OF bone lesions appear in CKD patients of stage 3 or greater
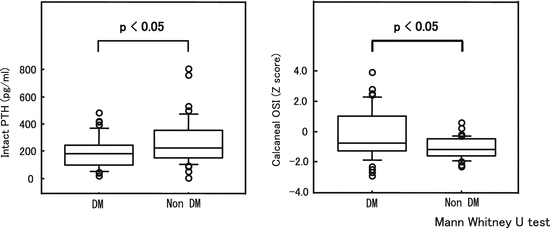
We previously investigated the relationship between PTH and bone mass in 83 male HD patients (DM, 42 cases; non-DM, 41 cases). As expected, PTH levels were significantly low in DM HD patients and osteosono index (OSI) values were significantly higher in DM HD patients (Fig. 7.2). However, when discussing these results, one must remember that bone mass is not maintained in relation to poor glycemic control. In fact, the OSI values of the 42 male DM HD patients exhibited a significant negative correlation with GA (Fig. 7.3), suggesting that bone mass decreases more with poor glycemic control [19]. Thus, different mechanisms lead to bone metabolism abnormalities in DM and non-DM patients, and once secondary hyperparathyroidism begins to complicate the condition, non-DM patients exhibit greater acceleration of bone loss than DM patients. This leads to a bone loss reversal phenomenon with decreased kidney function.


Fig. 7.2
Compared to non-DM HD patients, DM HD patients exhibited low intact PTH levels and high calcaneal OSI (Z score) levels (Cited from reference Yamada et al. [18]/partially revised). Because PTH elevation tends to be inhibited in DM HD patients, these patients exhibit more low-turnover, gradual bone loss than non-DM HD patients and bone mass tends to be maintained
< div class='tao-gold-member'>
Only gold members can continue reading. Log In or Register to continue
Stay updated, free articles. Join our Telegram channel

Full access? Get Clinical Tree


