Fig. 5.1
Early stress response on radiography. (a) Frontal radiograph of the forefoot shows focal osteopenia of the lateral cortex of the distal second metatarsal shaft (white arrow) and periostitis (curved arrow). (b) Lateral radiograph of the tibia shows focal cortical osteopenia (arrow)
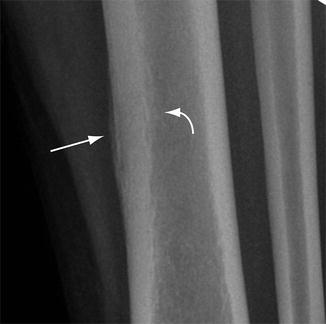
Fig. 5.2
Chronic radiographic findings of stress response. Close up of radiograph of the mid-tibia shows mature periosteal (arrow) and endosteal reactive changes (curved arrow) associated with focal areas of osteopenia in the cortex
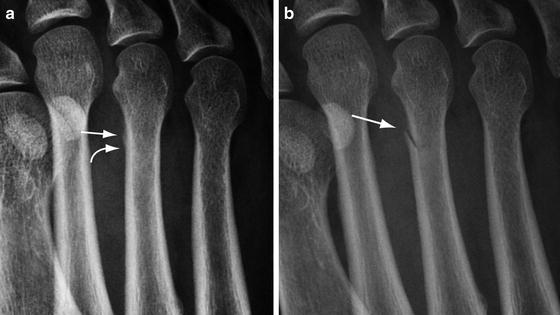
Fig. 5.3
Radiography of early stress fracture. (a) Oblique radiograph of the forefoot shows periostitis of the medial cortex of the third metatarsal shaft (arrow) and a subtle lucency (curved arrow) representing the start of a break in the cortex. (b) Follow-up image in 3 weeks shows completion of the cortical fracture with oblique lucency (arrow)
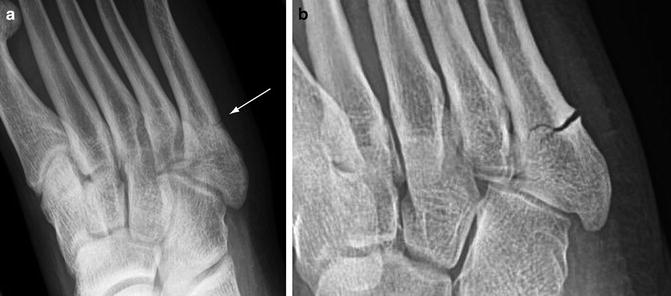
Fig. 5.4
Stress fracture progression. (a) Oblique forefoot radiograph in one patient shows a classic Jones stress fracture involving the lateral cortex of the proximal fifth metatarsal shaft (arrow). The fracture was isolated to the cortex. (b) Another patient with a Jones stress fracture shows extension into the medullary cavity after the athlete felt a “pop” while running
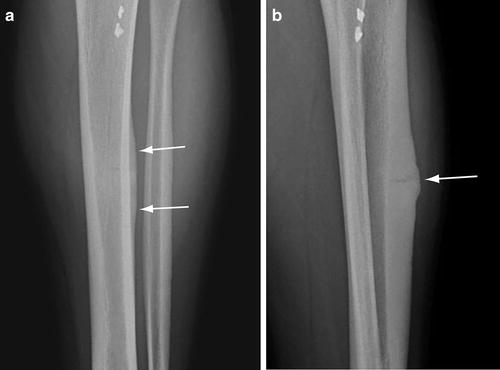
Fig. 5.5
Striated stress fracture. (a) Frontal radiograph of the tibia shows periosteal elevation along the anterolateral cortex of the mid-tibia (arrows). (b) Lateral view shows a transverse lucency through the cortex with more pronounced periosteal reaction directly adjacent to the fracture (arrow)
It is important to realize that the location and orientation of developing stress fractures influence the radiographic appearance so that fractures at the ends of tubular bones tend to depict linear areas of sclerosis whereas fractures in the shaft of a tubular bone may be simply a lucent cortical break or focal periostitis [33]. Longitudinal stress fractures have the appearance of a thickened cortex with a vertically oriented lucency in the cortex (Fig. 5.6). In bones composed largely of cancellous bones such as the tarsus and femoral neck, the first sign of a stress fracture may be simply focal linear sclerosis (Fig. 5.7). In these cases, initial findings are subtle blurring of the trabecula secondary to microfractures. As healing of the microfractures progresses, linear sclerosis appears oriented perpendicular to the course of the trabecular with extension to one cortical surface. Radiographic detectable changes usually become conspicuous weeks to months after the onset of symptoms and the timing and nature of the changes varies with the level of activity. However, it is noteworthy that imaging findings may not be necessarily sequential.
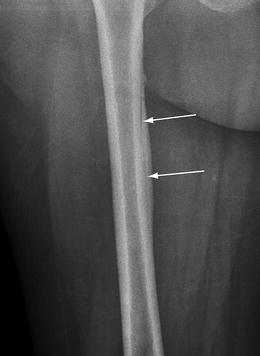
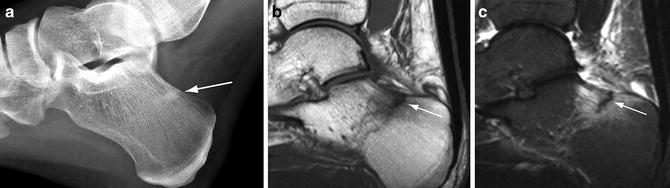
Fig. 5.6
Radiography of longitudinal stress fracture. Frontal radiograph of the femur shows a linear lucency (arrows) within the medial femoral cortex oriented along the longitudinal axis of the bone
Fig. 5.7
Stress fracture in cancellous bone. (a) Lateral radiograph of the calcaneus demonstrates a linear area of sclerosis perpendicular to the trabeculation in the superior calcaneus (arrow). Sagittal T1-weighted (b) and STIR (c) MR images show a uni-cortical, low-signal fracture line (arrows) surrounded by intense bone marrow edema
The sensitivity of radiographs for early stress fractures is as low as 15 % and follow-up radiographs may demonstrate findings in only 50–54 % of cases [7, 34]. Development of subsequent radiographic findings is often determined by whether there is cessation of the inciting stress that is affecting the bone. Prior studies comparing radiography to bone scintigraphy have reported a sensitivity of 56 %, a specificity of 94 %, an accuracy of 67 %, positive predictive value of 95 %, and a negative predictive value of 48 % [28]. There are many classifications available for grading the radiographic features of stress fractures but currently none have been ubiquitously utilized [35, 36].
Tomosynthesis, or digital radiography, has recently been shown to be superior to conventional radiography in detection of occult fractures and it may have an application in the evaluation of stress fractures [37]. This new imaging technique can depict both cortical as well as trabecular changes, so its performance is considered only slightly lower to that of CT but at lower radiation exposure [38].
The differential diagnosis for stress fracture on radiography is limited particularly as specificity of the study increases in the chronic phase of the fracture. Chronic osteomyelitis may present with periosteal and endosteal reactive changes resulting in cortical thickening but clinically, these two entities are not at all similar. Occasionally, a stress fracture may mimic a tumor [39]. Osteoid osteoma may result in cortical thickening and reactive bone formation and is often encountered in a similar patient population as stress fracture. The presence of a central lucent nidus as well as a less linear pattern of sclerosis and clinical history can aid in differentiation.
Radionuclide Scintigraphy
Bone scintigraphy had for many years been regarded as the gold standard for evaluating stress-induced injuries and although recently supplanted by MRI, it continues to be widely utilized in many situations. It measures bone response to injury by depicting areas of increased osseous metabolism through the localization of radionuclide tracers, particularly Tc-99m-MDP. The degree of uptake depends on the rate of bone turnover and local blood flow, and abnormal uptake may be seen within 6–72 h of injury [7, 34, 40]. Whole body bone scans can be performed with relatively low cost and have the advantage of being able to image the entire skeletal system at once, which is useful in cases when more than one area is symptomatic. The sensitivity of bone scintigraphy is nearly 100 % [7].
The specificity of bone scintigraphy, however, is limited by any process that increases blood flow and has osteogenic activity such as arthritis, infection, malignancy, infarctions, and metabolic conditions. The specificity can be improved by performing a three-phase study [24]. The first phase includes a dynamic flow study with images obtained at 1 s intervals for 60 s after the injection of radiopharmaceutical and is followed by a static “blood pool” image (second phase) obtained a few minutes later. These phases depict vascularity and soft tissue involvement, respectively. The third phase is the standard 2- to 4-h delayed images depicting the osteoblastic response. An acute stress fracture will be positive in all three phases while a chronic stress fracture tends to show activity only on the delayed images [7]. Another limitation of scintigraphy in patients with stress fractures is that the scintigraphic abnormality may take 4–6 months to resolve rendering the modality inadequate for sequential follow-up studies [41]. Several grading schemes are available to characterize the severity of a stress fracture according to its scintigraphic features.
The characteristic scintigraphic appearance of a stress fracture in delayed static images is intense, fusiform cortical uptake along the long axis of the bone at the level of the fracture (Fig. 5.8) [42]. However, there can be a wide spectrum of findings representative of the pathophysiologic continuum of the process and the variations in the orientation of the fracture such as in a longitudinal fracture (Fig. 5.9). A stress reaction is manifested by an area of less intense radionuclide uptake along the cortex corresponding to areas of remodeling bone during the period that radiographs are typically normal.
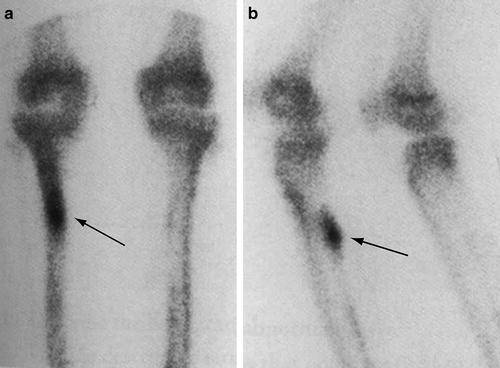
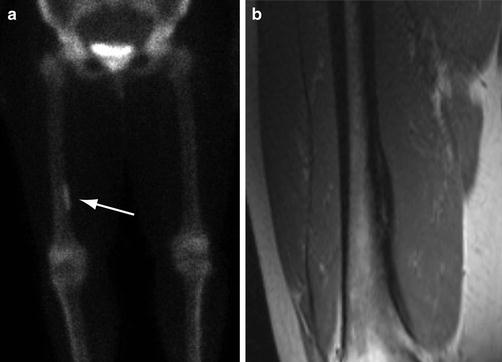
Fig. 5.8
Typical scintigraphic findings of a stress fracture. Delayed static images of the tibia from a whole body bone scan utilizing Tc-99m-MDP in the frontal (a) and oblique (b) projections show a characteristic appearance of a stress fracture in the tibia depicted as a fusiform region of radionuclide uptake oriented along the long axis of the bone (arrows)
Fig. 5.9
Longitudinal stress fracture on scintigraphy. (a) Delayed frontal static bone scan image utilizing Tc-99m-MDP shows a thin, linear area of increased activity in the medial cortex of the distal right femoral shaft (arrow). (b) Coronal T1-weighted MR image shows a longitudinal stress fracture depicted as a linear area of intermediate signal intensity within the thickened cortex aligned to the axis of the bone
Athletes who are involved in rigorous training regimens may present with multiple symptomatic regions of bone that show abnormal radionuclide uptake, and these findings have been shown to represent both stress reaction and frank stress fractures. However, some patients also depict abnormal uptake in regions of bone that are not symptomatic. This likely represents the earliest manifestation of bone remodeling [43]. The asymptomatic foci have been reported in as high as 46 % of subjects in one series [44]. With continued activity, these may progress to symptomatic stress injuries.
The application of planar scintigraphy in combination with single-photon emission computed tomography (SPECT) has been recently advocated for increasing the accuracy of grading stress fractures. In a recent study evaluating patients with known femoral neck stress fractures diagnosed with MR imaging, the sensitivity of planar scintigraphy alone was reported to be 50 % while the sensitivity for planar scintigraphy in combination with SPECT increased to 92 % [45]. Similarly, the accuracy for scintigraphy alone was 12.5 % but increased to 70 % when SPECT was added. SPECT has also been shown to improve the diagnostic accuracy of stress fractures at the pars interarticularis region of the spine, a process that is commonly observed in adolescent athletes with back pain. SPECT has been shown to provide more detailed anatomic depiction of the region in comparison to MRI and higher sensitivity in comparison to planar scintigraphy alone [46–48]. However, SPECT is limited in the spine owing to a high rate of false positives and false negatives [49].
Ultrasound
Sonography has a very limited role in the evaluation of stress fractures and is not recommended as a stand-alone study [50]. However, studies have shown that this modality may occasionally be used to assess the superficial surface of the cortex in bones that are located close to the skin such as in the ankle/feet and tibia [51]. Cortical irregularities such as periostitis and callus formation can be depicted as well as muscular edema around the bone, and compression of the probe is useful in confirming pain. Color Doppler imaging can demonstrate areas of hyperperfusion at and near the stress fracture.
Computed Tomography
The role of CT in the assessment of stress-related injuries continues to be relatively limited despite advances in technology. CT is less sensitive than both MRI and nuclear scintigraphy in depicting the early changes of bone remodeling from repetitive stress [7, 29, 31]. However, the ability to produce thin-section, multiplanar-reconstructed images in order to provide high resolution and detailed depiction of cortical bone does relegate CT to an important adjunctive role when the imaging features in other modalities are equivocal [53]. CT is clearly superior to both sonography and conventional radiography. The earliest finding of a stress injury on CT is focal cortical osteopenia, but this is not a common observation because CT is typically not a first-line study (Fig. 5.10). CT manifestations that are distinctive of stress injuries, however, include thickening of the cortex, periosteal reactive changes, intramedullary sclerosis, and longitudinal and transverse lucent fracture lines. The main limitation of CT is that these findings may not develop until the patient has been symptomatic for several weeks. However, high-resolution CT is currently the most sensitive modality for detecting subtle cystic changes in the cortex that characterize cortical resorption cavities (Fig. 5.11). Once a fracture line in the cortex develops, the defect is easily demonstrated by conventional axial images as well as by multiplanar reformatted or 3D volume rendered images (Fig. 5.12) [54].
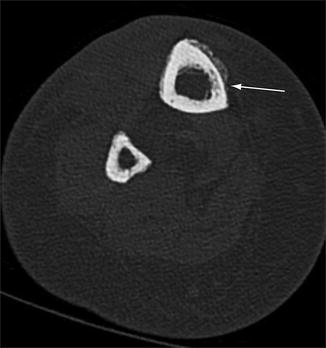
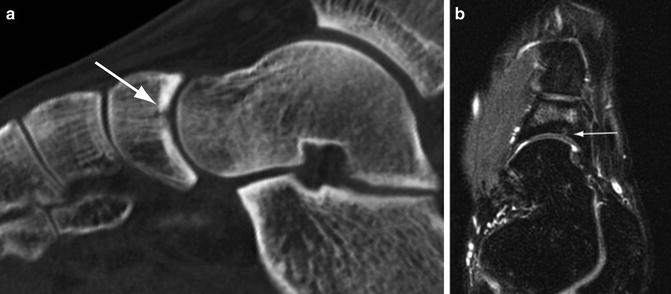
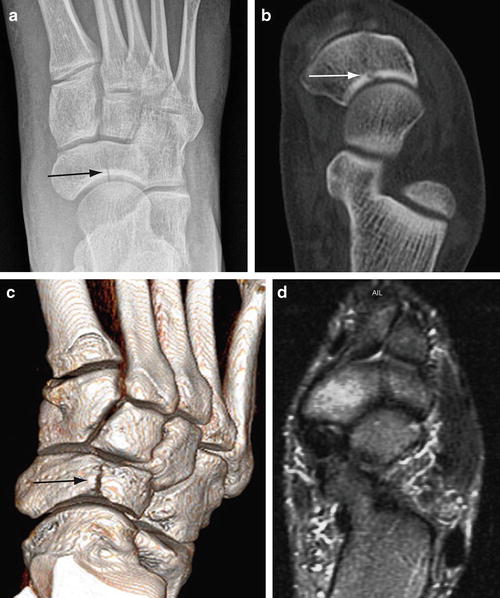
Fig. 5.10
Computed tomography, early stress response. Axial CT image of the tibia shows focal osteopenia in the cortex of the bone (arrow) where it is undergoing stress-induced changes
Fig. 5.11
Cortical resorption cavity. (a) Sagittal multiplanar CT image of the foot shows focal osteopenia in the cortex at the point of the fracture (arrow) indicating a developing cortical resorption cavity. (b) Axial STIR MR image shows the cystic defect in the cortex (arrow) and bone marrow edema in the medullary space
Fig. 5.12
Subacute navicular stress fracture. (a) Frontal foot radiograph of a college basketball player shows a vertical lucency (arrow) in the lateral aspect of the navicular. (b) Axial multiplanar CT image confirms the stress fracture (arrow) as well as normal bone density throughout the tarsal bone. (c) 3D volume rendered CT image depicts the entire stress fracture (arrow) in one image. (d) T2-weighted MR image demonstrates bone marrow edema in the medial and lateral bone fragments
CT is advantageous in certain situations over other imaging techniques. It is useful in differentiating healing from progression (Figs. 5.13 and 5.14). Certain location-specific conditions are better suited for CT. Stress fractures that affect the tarsal navicular are often difficult to diagnose because the symptoms associated with this condition are often vague and there may be a paucity of specific physical findings [55]. Additionally, the overall density of the navicular can, in part, obscure the linear focus of sclerosis that accompanies a stress fracture on radiography. In these cases, CT is useful in elucidating the imaging characteristics of the stress fracture such as the extent of abnormality, orientation, and if there are indicators of avascular necrosis. A similar challenge may occur in patients with pars interarticularis fractures. Fracture lines are often difficult to visualize utilizing other modalities such as MRI but are clearly illustrated on CT [49, 56]. Occasionally, cortical thickening may be a nonspecific finding. For instance, the radiographic manifestation of an osteoid osteoma may mimic those of a stress fracture because both conditions thicken the cortex and are associated with variable periosteal reactive changes. By utilizing thin-section CT images, these entities can be reliably differentiated by the identification of the lucent nidus that is the classic feature of osteoid osteoma within the region of cortical thickening and sclerosis [57]. The power of CT over MRI is in its ability to penetrate the high-attenuation cortical bone. Although MRI remains the single best method for evaluating early stress injuries, it is relatively insensitive to changes that occur only within the cortex. Therefore, the subset of cortical stress injuries that are characterized by osteopenia, resorption cavities, and striations are better suited for evaluation by CT [58]. Longitudinal stress fractures of the tibia caused by repetitive torsional loading in runners are another subset of fractures that are best evaluated with CT. The longitudinal orientation and extension of the fracture negates the effectiveness of radiographs and though MRI is capable of depicting the abnormality, CT has been reported to be more sensitive in identifying the fracture line itself [59].
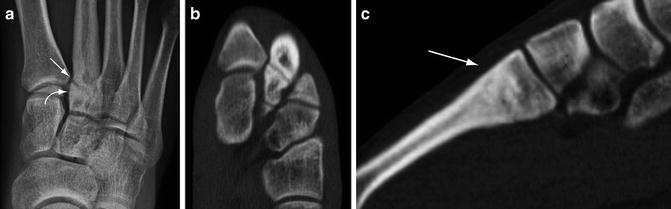
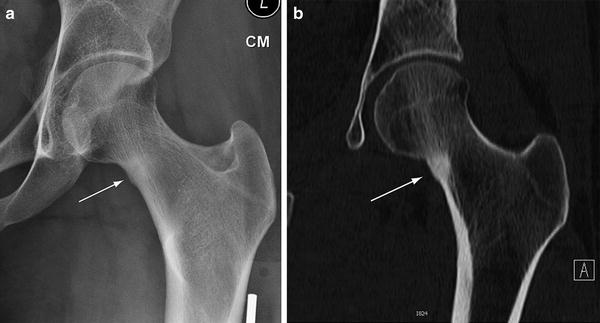
Fig. 5.13
Chronic stress fracture. (a) Frontal radiograph of the foot demonstrates a transverse lucency near the base of the second metatarsal bone (arrow). Sclerosis adjacent to the fracture is evident (curved arrow). Axial (b) and sagittal (c) multiplanar CT images more optimally characterize the stress fracture and also shows that the dorsal cortex is intact (arrow)
Fig. 5.14
Computed tomography of healing stress fracture. (a) Frontal radiograph of the hip shows a region of sclerosis on the compressive side of the femoral neck with focal periosteal reactive changes (arrow). (b) Coronal multiplanar CT image shows that the fracture line has nearly filled in and is no longer evident (arrow)
Peripheral quantitative computed tomography (pQCT) is a CT technique that has demonstrated potential in the evaluation of stress fractures by the acquisition of high-resolution images of the extremities at lower radiation doses than with conventional CT. The pQCT images afford detailed portrayal of the structure and mineralization of bone at the location of the stress fracture. As such, it may have application in monitoring the stress fracture throughout the healing phase [60, 61].
Magnetic Resonance Imaging
MRI is currently the gold standard for diagnosing and classifying stress-induced injuries. Several important features of this imaging modality have contributed to its emergence as a superior tool for assessing these conditions including unparalleled contrast, outstanding spatial resolution particularly with higher strength magnets, and the capability to image in an infinite number of geometric planes [62]. Additionally, it does not utilize ionizing radiation which is ideal in the athletic population who tend to be younger [63]. MR images, in general, can be obtained in a shorter period of time than with a scintigraphic examination, and provides images that are exquisitively sensitivity to the subtle changes seen in patients with early stress fractures. Numerous studies have shown that MRI outperforms radiography, CT, and radionuclide scanning [28, 29, 31, 64, 65].
MRI examinations are optimized by utilizing dedicated coils which serve to increase the signal-to-noise ratio and decrease artifacts. Higher strength magnets, such as 3-T systems which are becoming more commonplace, offer higher spatial and contrast resolution, shorter scanning times, and improved conspicuity of bone marrow edema than conventional 1.5-T systems [66]. The sensitivity is comparable for both MR systems and routinely, 1.5 T MR images are typically adequate for diagnosis and characterization of stress fractures [67, 68]. Typical sequences applied include short tau inversion recovery (STIR), which is commonly used in screening since it has the highest sensitivity to edema, and fast spin-echo sequences with fat-saturation which are excellent in preserving high spatial resolution. A T1-weighted sequence is generally prescribed to further characterize the inherent signal intensity of lipoid marrow. Intravenous gadolinium is not frequently administered in the evaluation of stress fracture. However, dynamic enhancement has been reported in patients with higher grade stress reactions and stress fractures caused by increased tissue perfusion. This may be useful in cases where the pre-contrast MR images show a callus, fracture, or muscle edema, and in situations where there is a concomitant malignancy or infection [69].
MRI is an effective diagnostic technique in patients who show strong clinical manifestations of a stress fracture but have normal initial radiographs [70, 71]. Like scintigraphy, MRI depicts changes in the bone and periosteum weeks before any radiographic abnormality develops. The early stages of a stress fracture are characterized by focal hyperemia and bone marrow edema that correlates with the development of microfractures and osseous resorption. Endosteal reactive changes, periostitis, and periosseous edema are important early observations on STIR or T2-weighted spin-echo images, and are characteristic of stress reactions (Fig. 5.15) [65, 72]. Edema appears bright in signal intensity on these sequences. Focal periosteal elevation develops as the process becomes more severe (Fig. 5.16). As the injury progresses and becomes more severe, marrow edema appears on T1-weighted images as areas of low-signal intensity (Fig. 5.17). As breakdown of the cortical bone progresses, a frank stress fracture forms either transversely or longitudinally (Figs. 5.18 and 5.19) [64]. The most common patterns of a fatigue stress fracture on MRI are a linear, uni-cortically-based abnormality of low-signal intensity surrounded by a larger, ill-defined region of marrow edema, or a linear cortical abnormality with adjacent muscular or soft tissue edema [73–75]. Callus formation indicates a more chronic stress fracture. The MRI features in the continuum of a developing stress fracture parallel to those that are observed on bone scintigraphy.
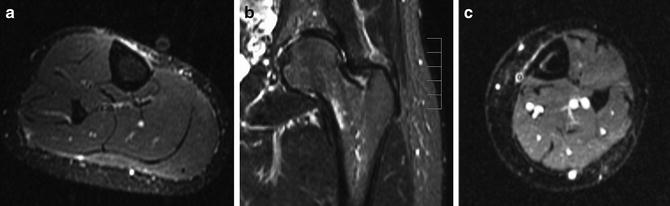
Fig. 5.15


Different stress responses on MR imaging. Fluid-sensitive MR images in three different athletes. (a) Periostitis along the medial cortex of the tibia manifests as linear high-signal intensity along the outer cortex. (b) Endosteal reaction with marrow edema along the endosteal surface of the femoral neck. (c) A patient with a more severe stress response shows both periosteal and endosteal reactive changes
Related posts:

Stay updated, free articles. Join our Telegram channel
Full access? Get Clinical Tree
