All patients
Age (years)
Height (cm)
Weight (kg)
Postoperative time (months)
Sports
All subjects
20.5 ± 1.2
165.3 ± 8.6
63.8 ± 11.3
10.0 ± 1.6
–
Males
20.8 ± 1.1
170.9 ± 6.0
71.6 ± 6.0
9.8 ± 1.3
Soccer, rugby, lacrosse, handball
Females
20.1 ± 1.3
158.0 ± 5.2
53.9 ± 8.2
10.7 ± 2.3
Soccer, cheerleading, volleyball, handball
20.2.2 Rehabilitation
The same rehabilitation program was used for each patient. After the acute phase, the patients were permitted to exercise to promote increased range of motion. They used isotonic knee extension and flexion exercises. The patients were allowed partial weight bearing at 2 postoperative weeks and progressed to full weight bearing at postoperative week 3. Rehabilitation exercises involved stationary bicycling and exercises with partial weight bearing at 3 weeks after surgery. Isotonic strengthening exercises for the quadriceps and hamstring muscle were initiated at week 4. Until week 8, a restriction in the range of motion was set for the knee extension exercise. Jogging and full-speed running were permitted after 12 and 16 postoperative weeks, and progressed to agility and sports-specific drills. Return to unlimited sports activity was allowed at 6–8 postoperative months.
20.2.3 Self-Report Measures
Subjects answered the questions of a standard questionnaire to provide a Knee Injury and Osteoarthritis Outcome Score (KOOS). The questionnaire’s answers provide an internationally used orthopaedic patient self-assessed outcome score. The KOOS supplies a global assesment (symptoms/stiffness, pain, functional impact on every day activities and sports activities, and quality of life) of post-traumatic or degenerative knee conditions. Each subscale score of 36 questions is calculated independently. The mean score of the individual items of each subscale are calculated and divided by 4. Scores for the summed (overall KOOS) and individual subdomains are transformed to a scale of 0–100, with 0 representing extreme knee problems and 100 representing no knee problems. For a detailed explanation, consult Roos et al. (1998).
20.2.4 Hop Test Procedure
We evaluated 4 single-leg function tests: (1) single hop for distance; (2) 6-m timed hop; (3) triple hop for distance; and (4) cross-over hop for distance (Fig. 20.1) (Noyes et al. 1991). For each hop test, the subjects performed one practice trial for each limb, followed by two measured and recorded trials. The final landing on the hop limb had to be stabilized and held for 2 s to be recorded as a successful trial. Subjects were instructed to begin with the nonoperative leg, with their lead toe behind a marked starting line. For single hop for distance, the subjects stood on the leg to be tested. The athlete was instructed to initiate the hop by swinging the arms forward, simultaneously extending at the hip and knee, and to hop forward as far as possible while being able to land safely on the same limb. In the triple hop for distance, the subjects stood on one leg and performed three consecutive hops going as far as possible, using the same limb. In the crossover hop for distance, the subjects were instructed to land safely on the same foot, but on the opposite side of the line medial to the stance limb. Athletes were instructed to immediately redirect into two subsequent forward directed hops, crossing over the midline with each hop. For the 6-m timed hop, the subjects stood on one leg, and then hopped as fast as possible over a marked distance of 6 m. The fastest time measured using the Speed Trap timing system (Brower Timing Systems, Utah, USA) was used for data analysis. The hop test scores were calculated as the average of two recorded trials for each limb. We used the hop test scores of the four tasks to calculate a limb symmetry index (LSI) as per the following formula: (operated lower extremity/nonoperated lower extremity) × 100 %.
Fig. 20.1
Diagrammatic representation of the series of four hop tests
20.2.5 Isokinetic Strength Evaluation
Isokinetic concentric strength was measured in the both limbs using a dynamometer (Biodex System III, Biodex Co., New York, USA) (Fig. 20.2). Before evaluation, compensation was performed to exclude the effect of gravity on the measurement of torque. The subject was first supervised in the performance of the movements, and then allowed several practice trials. Three trials of isokinetic contraction were performed at angular velocities of 60° and 180°/s. The range of motion was set from 90° of knee flexion to full extention. The reconstructed limb was tested before the uninjured limb. During the isokinetic contraction, the values for the peak torque were recorded for analysis and normalized to body weight. We calculated LSI by using the same formula as with the hop testing.
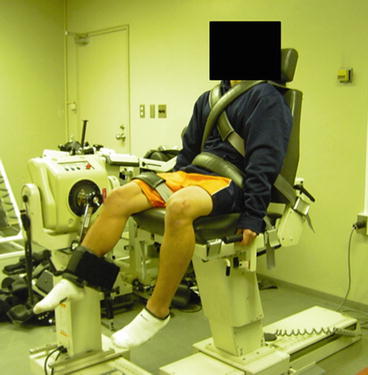
Fig. 20.2
Testing position of the isokinetic torque measurment
20.2.6 Data Analysis
Means and standard deviations were calculated for all variables of interest. All statistical analyses were conducted using a statistical analysis software program (SPSS ver. 21.0; SPSS Japan, Tokyo, Japan). A paired t-test was used to test for side-to-side differences in each hop test and for isokinetic strength. To compare differences between males and females, a non-paired t-test was performed on the hop tests and strength LSI evaluations. A Pearson’s product–moment correlation coefficient (r) was used to examine the relationship among hop test LSI, strength LSI and overall KOOS scores. Statistical significance was established at p <0.05.
20.3 Results
20.3.1 Self-Report Measures
Subejects had a mean overall KOOS score of 90.1 (range, 76–100), pain score of 90.6 (range, 72–100), symptoms/stifness score of 83.5 (range, 68–100), activities of daily living score of 97.4 (range, 88–100), sports/recreation score of 82.5 (range, 65–100), and QOL score of 79.3 (range, 44–100) (Table 20.2).
Table 20.2
Overall KOOS and individual KOOS subdomains
Overall KOOS | Pain | Symptoms/stifness | ADL | Sports/recreation | QOL |
|---|---|---|---|---|---|
90.1 ± 8.1 | 90.6 ± 9.8 | 83.5 ± 12.6 | 97.4 ± 3.9 | 82.5 ± 12.4 | 79.3 ± 19.2 |
20.3.2 Hop Tests
Table 20.2 shows hop test scores for the three subject groups. The hop distance for the operative limb was significantly less than for that of the nonoperative limb (p <0.01) (Table 20.3). Mean LSI value for hop test was single hop of 89 % (range, 77–102 %), 6-m timed hop of 101 % (range, 94–111 %), triple hop of 94 % (range, 75–105), and crossover hop of 95 % (range, 72–104). There was no statistical difference between the operative limb and the nonoperative limb in the 6-m timed hop. There were no significant differences in the LSI of the hop tests between males and females (Fig. 20.3).
Table 20.3
Hop test scores on the operative limbs and nonoperative limbs
Single hop (cm) | 6-m timed hop (s) | Triple hop (cm) | Crossover hop (cm) | |
|---|---|---|---|---|
All subjects | ||||
Operative limb | 118.7 ± 16.3** | 1.94 ± 0.23 | 458.5 ± 66.1* | 434.1 ± 81.3* |
Nonoperative limb | 133.5 ± 20.7 | 1.92 ± 0.25 | 492.6 ± 89.9 | 461.3 ± 89.7 |
Males | ||||
Operative limb | 124.0 ± 17.5** | 1.80 ± 0.13 | 500.5 ± 34.3** | 490.0 ± 52.5 |
Nonoperative limb | 142.6 ± 21.0 | 1.76 ± 0.12 | 559.4 ± 38.1 | 525.0 ± 56.2 |
Females | ||||
Operative limb | 111.8 ± 12.6** | 2.12 ± 0.20 | 404.5 ± 41.3** | 362.1 ± 46.2 |
Nonoperative limb | 121.9 ± 14.3 | 2.12 ± 0.23 | 406.6 ± 54.3 | 379.3 ± 44.7 |
Fig. 20.3
Limb symmetry index for hop tests
20.3.3 Isokinetic Strength
Table 20.3 shows knee extention and flexion isokinetic assessment for the three subject groups. For all subjects, the extention torque in the operative limb was significantly lower than that in the nonoperative limb at 60°/s (2.48 ± 0.49 Nm/kg) and 180°/s (1.75 ± 0.28 Nm/kg), respectively (p <0.01); however, the difference was not significant in flexion torque at 60°/s (1.48 ± 0.32 Nm/kg) and 180°/s (1.16 ± 0.28 Nm/kg) (Table 20.4). Mean LSI value of extention torque was 88 % (range, 77–107 %) at 60°/s, 92 % (range, 81–104 %) at 180°/s (Fig. 20.4). Mean LSI value of flexion torque was 95 % (range, 78–120 %) at 60°/s, 97 % (range, 74–107 %) at 180°/s (Fig. 20.5). There were no significant differences in the strength LSI between males and females.
Table 20.4
Isokinetic peak torque of the operative limbs and nonoperative limbs
60°/s (Nm/kg) | 180°/s (Nm/kg) | |
|---|---|---|
All subjects | ||
Extention, operative limb | 2.48 ± 0.49** | 1.75 ± 0.28** |
Extention, nonoperative limb | 2.82 ± 0.45 | 1.91 ± 0.23 |
Flexion, operative limb | 1.48 ± 0.32 | 1.16 ± 0.28 |
Flexion, nonoperative limb | 1.57 ± 0.32 | 1.20 ± 0.28
Related posts: Injury and Illness Surveillance Among Olympic Athletes: Summary of the 2010 Winter, and the 2008 and 2012 Summer Olympic Games
Anterior Cruciate Ligament Injury Prevention in Female Adolescents
Concussion and Severe Head-Neck Injury: An Approach for Their Prevention in Rugby and Judo
Video Analysis of ACL Injury Mechanisms Using a Model-Based Image-Matching Technique
Biomechanical Analysis of the Effects of Footwear
Sports Injury Surveillance in Japanese Junior and Senior High School Students Injury and Illness Surveillance Among Olympic Athletes: Summary of the 2010 Winter, and the 2008 and 2012 Summer Olympic Games
Anterior Cruciate Ligament Injury Prevention in Female Adolescents
Concussion and Severe Head-Neck Injury: An Approach for Their Prevention in Rugby and Judo
Video Analysis of ACL Injury Mechanisms Using a Model-Based Image-Matching Technique
Biomechanical Analysis of the Effects of Footwear
Sports Injury Surveillance in Japanese Junior and Senior High School Students
Stay updated, free articles. Join our Telegram channel
Full access? Get Clinical Tree
 Get Clinical Tree app for offline access

|