Intensity
Duration
Intention
Emotion
Higher
Shorter
Intentional
Mood
Lower
Longer
Non-intentional
2.2.2 Classifications of Emotion
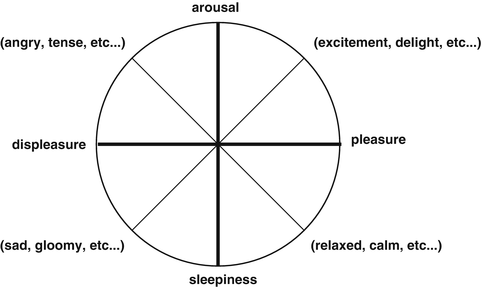
It is said that most humans, regardless of gender or culture, have certain basic, fundamental emotions that are necessary for normal function. Ekman (1992) suggests a “big six” of emotion; joy, surprise, anger, fear, disgust, and sadness, whereas Plutchik (1980) maintains there are eight basic emotions: joy, acceptance, fear, surprise, sadness, disgust, anger, and anticipation. Because the expression of emotions is influenced by culture and environment, in adults the emotions encountered by researchers can be quite different. Moreover, there is general recognition among psychologists that the basic emotions can be combined to form other emotions (e.g., joy + surprise = delight) (Plutchik 1980). Therefore, we should recognize a basic framework of classification for emotions. Figure. 2.1 shows a representative example of such a classification.


Fig. 2.1
Circumplex model of affect (From Russel 1980. Copyright 1980 by the American Psychological Association. Adapted with permission)
The model depicted in Fig. 2.1 is constructed using two dimensions, “pleasure–displeasure” and “arousal–sleepiness,” and is very useful in understanding each emotion’s orientation (Bagozzi et al. 1999). Recognize, however, that such dimensions can be different for each researcher, such as those employed by Schlosberg (1954) or Mehrabian (1978). It is important to be aware of the basic idea underlying each model.
2.2.3 Hierarchy of Emotion
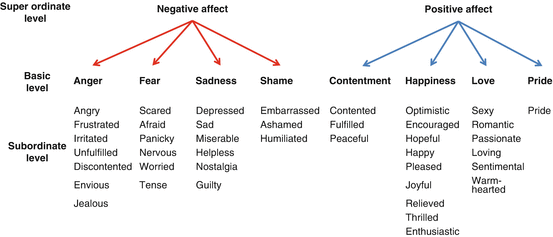
Figure 2.2 shows a hierarchy of consumer emotions. In consumer behavior research, some researchers classify emotions roughly into positive or negative, while other researchers focus on specific emotions. For example, there are studies focusing on “surprise” (e.g., Derbaix and Vanhamme 2003; Kumar et al. 2001), “anger” (e.g., Bougie et al. 2003), and “delight” (e.g., Oliver et al. 1997; Chitturi et al. 2008). The advantage of viewing emotions in a rather rough way (such as positive or negative) is that it makes it simpler to understand subjects’ attitudes. However, blending various emotions into one coarse category means that useful information may be lost. For example, although emotions are typically classified as “positive” or “negative”, we can find distinct differences between anger and fear or excitement and calm. Therefore, we should decide which classification method is most appropriate to the purpose of one’s study.


Fig. 2.2
Hierarchy of consumer emotions (From Laros et al. 2005. Copyright 2004 by Elsevier. Adapted with permission)
2.3 Emotion in Watching Sport
In this section, empirical studies are introduced that apply psychological theory to sport spectators. Two of the characteristics present when watching sport are “competitiveness” and “uncertainty of game outcome” (Wann et al. 2001); these characteristics enable spectators to be aroused easily. Previous studies have examined spectators’ psychological changes before and after watching games (e.g., Hirt et al. 1992; Knobloch-Westerick et al. 2009; Oshimi and Harada 2012a; Sloan 1989). In most results, positive emotions were aroused when the spectators’ favorite team won the game, and negative emotions were aroused when their favorite team lost. In other words, the outcome of the game, resulting from player or team performance, is a predicting factor for spectators’ emotions.
However, it is assumed that spectators’ emotional arousal cannot be fully predicted simply by whether their favorite team wins or loses. This is believed to be because spectators’ psychological states may differ depending on the content of a game (such as games won by a narrow or wide margin) (Bee and Madrigal 2012). One interesting example of the spectators’ emotional state before and after a game took place in the league qualifier games of the 2013 FIFA CONFEDERATIONS CUP in which people watched the Japan National Soccer Team (Japan vs. Brazil, Japan vs. Italy, and Japan vs. Mexico). The study focused on a total of 105 undergraduate student spectators of these games.
A unitary variance analysis was conducted on spectators’ emotions following each game, and subsequent verification was conducted using Tukey’s method. The results indicated a particularly strong occurrence of positive emotions such as pride, joy, and delight during the Italy game in comparison to the other two games (p < .001); also observed were differences in the influence of negative emotions such as anxiety and outrage as compared to the other games (Table 2.2). Therefore, it is clear that a win or loss of the spectators’ favorite team is not an adequate predictive variable for spectator emotions, because there were major differences among spectators’ emotions after each game even though the results of the games were same; Japan lost all three games (Japan vs. Brazil = 0–3; Japan vs. Italy = 3–4; Japan vs. Mexico = 1–2).
Factor | Group | Pre-match (SD) | Post-match (SD) | F | Post hoc analysis |
|---|---|---|---|---|---|
Pride | vs. BRA (n = 40) | 1.81 (1.19) | 1.58 (0.88) | 31.57 (2, 95) *** | ITA > BRA |
vs. ITA (n = 34) | 1.54 (0.84) | 3.38 (1.45) | ITA > MEX | ||
vs. MEX (n = 31) | 1.77 (1.10) | 1.53 (0.96) | |||
Joy | vs. BRA (n = 40) | 2.37 (1.45) | 1.52 (0.76) | 30.68 (2, 95) *** | ITA > BRA |
vs. ITA (n = 34) | 2.07 (1.17) | 3.15 (1.43) | ITA > MEX | ||
vs. MEX (n = 31) | 2.24 (1.44) | 1.61 (0.86) | |||
Delight | vs. BRA (n = 40) | 1.42 (0.82) | 2.12 (1.22) | 22.95 (2, 95) *** | ITA > BRA |
vs. ITA (n = 34) | 1.26 (0.56) | 4.07 (1.71) | ITA > MEX | ||
vs. MEX (n = 31) | 1.59 (1.04) | 2.15 (1.04) | |||
Anxiety | vs. BRA (n = 40) | 2.08 (1.01) | 1.89 (1.20) | 3.33 (2, 95) * | MEX > ITA |
vs. ITA (n = 34) | 1.99 (1.32) | 1.49 (0.91) | |||
vs. MEX (n = 31) | 1.92 (1.27) | 2.40 (1.57) | |||
Outrage | vs. BRA (n = 40) | 1.03 (0.16) | 1.45 (0.85) | 4.12 (2, 95) * | MEX > BRA |
vs. ITA (n = 34) | 1.09 (0.43) | 1.45 (0.98) | MEX > ITA | ||
vs. MEX (n = 31) | 1.21 (0.77) | 2.11 (1.40) |
Another approach for predicting spectators’ emotions is to apply the cognitive appraisal theory. This approach is frequently used to determine consumer emotions; consumers’ thoughts and evaluations of a given product have an impact on emotional arousal (Oliver 1993). The above methodology is based on the cognitive-motivational-relational theory (Lazarus 1991), which proposes that cognition is a precedent to emotional arousal. Table 2.3 shows the result of spectators’ emotional state as determined by applying the cognitive appraisal theory which in this case focused on discrepancies between the results of the event and the spectators’ expectations.
Table 2.3
Mean negative and positive disconfirmation for negative and positive emotions (Oshimi et al. 2013a)
Disconfirmation | |||
|---|---|---|---|
Factor | Negative | Positive | t-value |
Pride | 1.29 (0.49) | 2.89 (1.56) | 6.91*** |
Joy | 1.23 (0.41) | 2.71 (1.43) | 7.06*** |
Delight | 1.81 (1.02) | 3.67 (1.67) | 6.49*** |
Excitement | 3.16 (1.35) | 4.83 (1.49) | 5.45*** |
Anxiety | 2.45 (1.61) | 1.46 (0.85) | 3.45** |
Outrage | 2.13 (1.41) | 1.36 (0.86) | 2.97** |
Disappointment | 3.71 (1.70) | 2.80 (1.39) | 2.69* |
The results of the study were such that, depending on whether there was a high or low degree of discrepancy between the results of the event and the spectators’ expectations, there was a clear reinforcement of positive or negative emotions. From these results, it is assumed that discrepancies between the results of the event and the spectators’ expectations are important determinants in predicting the arousal of emotions. This information accrues in addition to whether a spectator’s supported team won or lost (e.g., Hirt et al. 1992; Madrigal 2008; Sloan 1989). Therefore, two variables, “outcome of the team they support” and “discrepancies between the results of the event and spectators’ expectations,” should be taken into account in predicting spectators’ emotions.
Stay updated, free articles. Join our Telegram channel

Full access? Get Clinical Tree


