This article discusses the epidemiology and clinical presentation of carpal tunnel syndrome and the electrodiagnostic approach to evaluating patients with possible carpal tunnel syndrome. The selection of the best sensory testing protocol and use of motor conduction studies and needle electromyography are discussed. Interpretation requires care, particularly in light of the risks of false-positive testing results and possible technical errors.
Epidemiology
Carpal tunnel syndrome (CTS) is the most common entrapment neuropathy in the upper limbs and is one of the most common diagnoses in patients who present to an electrodiagnostic laboratory for evaluation. The incidence and prevalence vary according to age and occupation of the subjects in the study. Generally the incidence of CTS has been reported to be roughly 100 to 300 cases per 100,000 person years in the United States. The prevalence has been reported to be roughly 3% to 6% of the general population. Age has a significant effect on incidence, with incidence in women increasing gradually with age and reaching a peak between 50 and 59 years, after which it declines. In men, there is a bimodal distribution, with peaks between 50 and 59 years and between 70 and 79 years. Geography also has an effect. Rural and industrial areas have a higher incidence than urban areas, which is likely related to occupational risks .
CTS can be associated with several medical conditions, including diabetes mellitus, rheumatoid arthritis, pregnancy, and obesity. In a study from Rochester, Minnesota, the risk of developing CTS was 3.6 times greater for patients who had rheumatoid arthritis, 2.3 times greater for patients who had diabetes mellitus, and 2.5 times greater for pregnant women than the general population . In another study that compared persons with body mass index of more than 29 with persons with body mass index of less than 20, obesity represented a 2.5-fold risk of developing CTS .
CTS is also associated with certain occupations, particularly those that involve hand motions with high force and high frequency of repetition. A recent systematic literature review reported that regular and prolonged use of hand-held vibratory tools increases the risk of CTS more than twofold. There are higher risks from prolonged and highly repetitious flexion and extension of the wrist, especially when applied with a forceful grip. The balance of evidence on keyboard and computer work does not, however, indicate a strong association with CTS .
Clinical presentation
Patients who have CTS typically present with hand numbness and tingling. Although the disorder is caused by median nerve entrapment at the wrist, reported symptoms often extend outside the median nerve sensory distribution and can involve the whole hand in a glove-type distribution . Symptoms are worse at night, and nocturnal awakening is common. Often when patients are awakened by their symptoms they shake or “flick” their hands. Some investigators report this flick sign (patients flick their hands when asked what they do at night) as highly sensitive and specific , whereas others have found it to be of limited use . Driving and hand usage are also precipitating factors for symptoms.
The physical examination does not always show marked abnormalities in CTS. Strength testing may show weakness or atrophy of thenar muscles. Sensation may be reduced in the median distribution to pinprick or two-point discrimination, although the deficits are not always apparent and do not always involve the entire median distribution. Muscle stretch reflexes are usually normal. There is debate about the sensitivity and specificity of Phalen’s sign and Tinel’s sign for detecting CTS . A recent review suggested that they are of limited use and of less value than testing thumb abduction strength or determining the distribution of symptoms .
Overall approach to electrodiagnosis of carpal tunnel syndrome
Multiple and varied approaches have been described for diagnosing CTS using electrophysiologic techniques. The lack of uniformity in approach suggests lack of consensus as to a single best approach. For a broad review of electrodiagnostic tests in this disorder, readers are encouraged to read a comprehensive review of methods for diagnosing CTS . In general, the approach to nerve conduction studies should include measurement of sensory and motor conduction in the median nerve across the wrist. It is generally wise to compare these measures with nearby nerves (radial or ulnar) that do not traverse the carpal tunnel to exclude the effects of temperature, polyneuropathy, or other factors that may influence median nerve conduction. Because conduction in large-diameter myelinated sensory axons is usually affected before smaller diameter motor axons, more focus is usually given to measurement of sensory fiber conduction. Rarely, however, motor axons are preferentially affected, possibly because of focal compression of the recurrent branch of the median nerve or selective effects on fascicles that contain motor fibers . It is important to study motor conduction even if median sensory latencies are normal.
Sensory conduction
There are many approaches to evaluating median sensory conduction across the wrist. It is critical to think through these alternative approaches before seeing a patient. In particular, one should avoid the approach of performing one test and, upon finding a normal result, performing one test after another until one finds an abnormality. Although this approach is tempting, it is risky for patients. If well designed and studied in an appropriate control group, each test would include the mean ± 2 standard deviations within the reference range, with 2.5% of healthy asymptomatic controls in the “abnormal” group (ie, false-positive results). As each test is performed and analyzed, one adds roughly a 2.5% false-positive rate. Performing two tests—and allowing an abnormality in either one to make a diagnosis—theoretically carries a 4.9% false-positive rate . These theoretical calculations are shown in Table 1 and Fig. 1 .
| Number of measures | At least one abnormal result (%) | At least two abnormal results (%) |
|---|---|---|
| 1 | 2.5 | – |
| 2 | 4.9 | 0.1 |
| 3 | 7.3 | 0.2 |
| 5 | 11.9 | 0.6 |
| 10 | 22.4 | 2.5 |
| 20 | 39.5 | 8.5 |
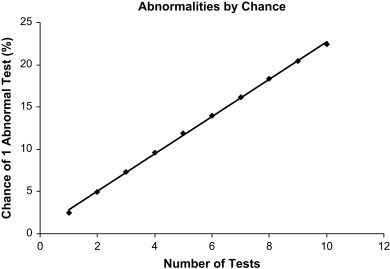
In the setting of CTS, empirical measures have partly confirmed these theoretical calculations. One study that examined the effect of performing three tests in CTS found that allowing one abnormal measure to make a diagnosis carried an 8% false-positive rate (predicted 7.3% in Table 1 ), whereas requiring two abnormal measures out of three tests carried only a 2% false-positive rate (predicted 0.2%) .
There are several options for avoiding false-positive results associated with performing multiple tests. One could perform just one test for all patients who present to the laboratory. This approach, however, carries several risks, including missing subtle disease that affects only some nerve fascicles, being misled by technical errors on a single test, and perhaps not picking the best test. Another possibility is requiring multiple test results to be abnormal to make a diagnosis. The latter approach is not a bad one and effectively reduces the chances of false-positive results. Sensitivity is lower, however, because only more severe cases demonstrate multiple abnormalities. In a study that used this approach, CTS sensitivity was reduced from 85% (requiring only one of three test results to be abnormal) to 74% if one required two test results to be abnormal . Requiring three out of three test results to be abnormal further reduced sensitivity to 56%.
A preferred approach is similar to that used for standardized tests that we have all taken (eg, board certification or medical college admissions testing): ask multiple questions to assess different areas and summarize the results into a single summary score. Although there are advanced statistical methods to perform this process, such as discriminant analysis or factor analysis , one can approximate this process well with simple addition . To achieve such a summary score, one relies on three sensory nerve conduction studies ( Fig. 2 ) that have literature support for a high degree of sensitivity and specificity in CTS. These studies include comparison of the median and ulnar sensory antidromic conduction to the ring finger at 14 cm (ringdiff), comparison of the median and radial sensory antidromic conduction to the thumb at 10 cm (thumbdiff), and comparison of median and ulnar orthodromic conduction across the wrist with palmar stimulation at 8 cm (palmdiff) .
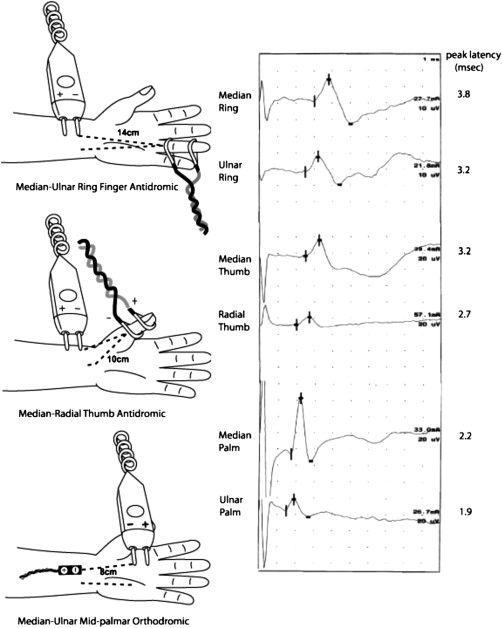
The strategy is to add the results from these three tests into a single number. The combined sensory index (CSI) is calculated as the sum of the three latency differences (median peak latency minus ulnar or radial peak latency):
An example is given in Fig. 2 , in which the CSI is calculated as
CSI = ( 3.8 – 3.2 ) + ( 3.2 – 2.7 ) + ( 2.2 – 1.9 ) = 0.6 + 0.5 + 0.3 = 1.4 msec
Related posts:
 Traumatic Brain Injury: A Review of Practice Management and Recent Advances
Spinal Cord Injury: A Comprehensive Review
Chronic Pain
Review of Upper and Lower Extremity Musculoskeletal Pain Problems
Cancer Rehabilitation: Challenges, Approaches, and New Directions
Rehabilitation of Children and Adults Who Have Neuromuscular Diseases
Traumatic Brain Injury: A Review of Practice Management and Recent Advances
Spinal Cord Injury: A Comprehensive Review
Chronic Pain
Review of Upper and Lower Extremity Musculoskeletal Pain Problems
Cancer Rehabilitation: Challenges, Approaches, and New Directions
Rehabilitation of Children and Adults Who Have Neuromuscular Diseases
Stay updated, free articles. Join our Telegram channel

Full access? Get Clinical Tree


