Low back pain has a negative impact on the economy and society. Intervertebral disk degeneration is linked to the occurrence of low back pain. MRI provides three-dimensional morphologic and biochemical information regarding the status of the disk. This article reviews new and evolving MRI disk-imaging techniques, including grading, relaxation-time measurements, diffusion, and contrast perfusion. In addition, high-resolution magic-angle spinning methods to correlate in vitro disk degeneration (with pain, etc) and in vivo spectroscopic results are discussed. With the potential for morphologic and biochemical characterization of the intervertebral disk, MRI shows promise as a tool to quantitatively assess disk health.
The incidence of back pain is ubiquitous in many societies; it has been reported as ranging from 8% to 80%. Most people experiencing back pain have self-limited episodes; however, a small proportion of this pain becomes chronic and debilitating (see the article by Karppinen and colleagues elsewhere in this issue for further exploration of this topic). Disorders of the low back have may compromise quality of life and present a tremendous financial impact on society through lost productivity, increased health care, and societal costs. In contrast to individuals with spinal degeneration resulting in spinal stenosis and disk herniation, those with disk degeneration have much more variable presentations and responses to treatment. Although aging of individuals inevitably leads to aging and degeneration of the spine, it has been proposed that physiologic degeneration is a different clinical entity from pathologic degeneration, with the implication that chronic back pain is the exception rather than the rule and that those with pathologic degeneration do not have appropriate repair or compensatory mechanisms (see the article by Chan and colleagues elsewhere in this issue for further exploration of this topic).
Intervertebral disks provide stable support to adjacent vertebral bodies and allow movement to the vertebral bodies, thereby affecting spinal flexibility. They absorb and distribute loads during daily activities. Intervertebral disks undergo age-related degeneration, increase in back pain, and stiffness. The connections between pain and disk degeneration are not fully understood (see the articles by Inoue and Espinoza Orias, and Karppinen and colleagues, elsewhere in this issue for further exploration of this topic).
The intervertebral disk is composed of the nucleus pulposus, the annulus fibrosus, and the cartilaginous end-plates (see the article by Grunhagen and colleagues elsewhere in this issue for further exploration of this topic). The nucleus pulposus is a viscous, mucoprotein gel that is approximately centrally located within the disk and is composed of glycosaminoglycans in a loose network of type II collagen. The annulus fibrosus forms the outer boundary of the disk and is made up of type-I collagen fibers arranged in lamellae. The proteoglycans of the nucleus osmotically exert a “swelling pressure” that enables it to support spinal compressive loads. The pressurized nucleus also creates tensile stress within the collagen fibers of the annulus and ligamentous structures surrounding the nucleus.
Disk degeneration is characterized by a loss of cellularity and degradation of the extracellular matrix resulting in morphologic changes and alterations in biomechanical properties. Changes in proteoglycan content within the nucleus leads to reduced water content, depressurization, and flattening of the disk. Disruption of the collagen network in the annulus ultimately leads to disk rupture and herniation. Disk-height loss also results in narrowing of the vertebral foramen with compression of the nerve roots and may lead to the development of spinal stenosis as well as foraminal narrowing. It has been proposed that biochemical degradation, upregulation of genes associated with collagen matrix degradation, and the cumulative effect of mechanical loading, all stimulate the degenerative disk process and, thus, contribute to functional impairment and pain (see the articles by Chan and colleagues, Kao and colleagues, and Inoue and Espinoza Orias elsewhere in this issue for further exploration of this topic). Thus, biomarkers that may be objectively associated with pain and functional impairment and yet provide noninvasive diagnosis of disk degeneration and its accompanying biochemical and biomechanical changes, are clearly required. It is in this context that MRI and spectroscopy has potential. In the following sections, the authors review the current diagnostic tools and recent developments for assessing disk degeneration.
Diagnostic imaging of intervertebral disk
Conventional radiographs have been used to assess degenerative disk disease for many years and are still the first imaging test in patients with suspected disk disease. Radiographic findings, however, provide indirect signs and include disk-space narrowing and reactive end-plate changes with spondylophytes and sclerosis. Associated anterolisthesis and retrolisthesis may also be a sign of degenerative disk disease. Radiographs are limited for assessing early-stage disease and quantifying the amount of disk degeneration. Disk bulges and herniations are not seen on radiographs.
CT scanning was the first line of investigation for suspected lumbar prolapsed intervertebral disk disease in the past, but has been overtaken by MRI. CT scanning exposes the patient to ionizing radiation and does not adequately demonstrate the disk in relation to the surrounding tissues compared with MRI because of inferior soft tissue contrast resolution. Nevertheless, it may be helpful in visualizing posterior osteophytes, which may be important for surgical planning. Although pain provocation using discography or CT discography has been shown to improve the odds of a positive surgical outcome, there a high incidence of false positives has been reported and there remains a significant number of severely degenerated disks that have been found to be painless. In part because of the widespread occurrence of abnormal radiographic findings, the use of provocative discography is theorized to determine which disk is the pain generator. Because degenerated disks can develop in-growth of nerve fibers that are sensitive to pain, it is thought that these fibers will be stimulated and irritated by injecting the disk and pressurizing it. Reproduction of the patient’s typical pain should signify that the patient’s pain is occurring at that disk level. The surgeon may use this test to determine at which levels the patient should have surgery. However, the test is painful, subjective, and can be difficult to interpret, particularly in chronic-pain patients. In addition, although fine needles are used for the injection into the disk (22 g and 25 g), there appears to be a higher incidence in late symptomatic degeneration in normal levels compared with those that were not injected (35% after discography compared with 14% in nondiscogram disks).
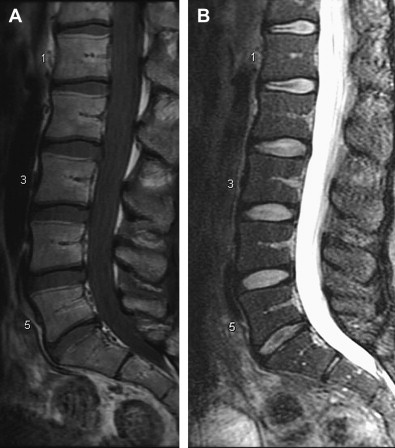
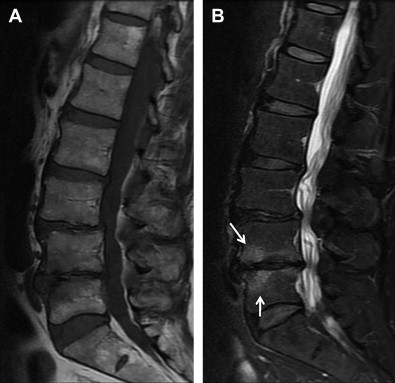
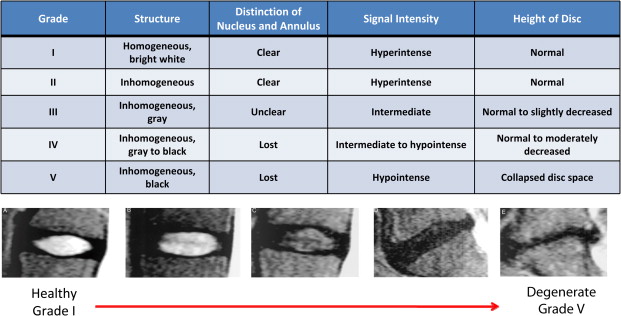
It is in this context that nonionizing MRIs, which reflect changes in disk height and morphology, are being used for diagnostic purposes. Using T 1 – and T 2 -weighted images, structural changes in the disk are visualized, as seen on representative images in Figs. 1 and 2 . A decrease in T 2 -weighted signal intensity with increased lumbar disk degeneration is often seen, as shown in Fig. 2 . Normal intervertebral disks show a well-defined, oval, high-signal intensity from the nucleus pulposus (see Fig. 1 ) and there is low-signal intensity from the annulus fibrosus, whereas degenerated disks are characterized by a change in the signal from the nucleus pulposus to give an irregular outline and a reduction in signal intensity on longer TE sequences, such as proton density and T 2 -weighting (see Fig. 2 ). In advanced cases, there is no clear demarcation between annulus and nucleus. A semiquantitative assessment of morphologic degeneration in intervertebral disk degeneration can be performed using Pfirrmann grading, which is a 5-point scale system and is assessed from T 2 -weighted MRIs. Fig. 3 shows representative disks with the different Pfirrmann grades. MRI is capable of assessing the disk degeneration in terms of signal changes and demonstrates posterior disk bulges, protrusions, extrusions, and sequestrations, as well as their effect upon the adjacent spinal cord and nerve roots.
Less common findings in MRIs include Modic end-plate changes, which are thought to be a sign of abnormal stresses at the disk and the so-called high intensity zone. This region, usually in the posterior aspect of the disk, with higher signal on T 2 images, may correlate with an annular tear of the disk fibers and the resultant inflammatory response. Studies that have attempted to correlate the presence of these findings with positive provocative discography are encouraging but not conclusive.
Investigators have used the uptake of gadolinium triethylene triamine pentaacetic acid enhancement to assess the intervertebral disk. There has been recent interest in the high-signal intensity zone in the posterior annulus seen in T 2 -weighted images, in which a band-like contrast enhancement of the disk has been correlated with vascularization (often seen as a consequence of annular tears) and which corresponds to pain, even in the absence of stenosis. In follow-up studies, however, these high intensity zones did not correlate with symptoms.
Quantitative MRI
For Biochemical Assessment
In an effort to improve the capability of MRI techniques to quantitatively assess spinal degeneration (in particular, disk degeneration) surrogate MRI measures of tissue hydration, such as relaxation times (T 1 and T 2 ) and, more recently, T 1ρ are being studied. In vitro studies have shown that there are highly significant differences between the nucleus and the annulus in both T 1 and T 2 relaxation times. A moderate negative correlation between the reciprocal of T 2 and water content for disk tissue samples suggests that a weakened collagen network could permit a greater degree of swelling (ie, a higher water content in the disk). There are significant differences in T 1 by region, the nucleus having a higher value than the annulus and in the loaded disk versus the unloaded disk. T 2 values also show a significant difference by region. The nucleus is greater than the annulus and T 2 decreases with increasing degeneration. T 1 and water content in the nucleus and annulus are correlated, but the change of relaxation time with water content is significantly higher in the nucleus compared with the annulus. In vivo, the T 1 and T 2 relaxation times and the proton density of the nucleus pulposus was measured in 107 normal and 18 surgically proven degenerate intervertebral disks, showing no age-related dependence of proton density, a marker of hydration, but showing highly significant difference between the T 1 values of normal and degenerate disks. T 2 showed highly significant differences in the younger age groups, but not in older age groups.
Boos and colleagues observed statistically significant ( P = .001) mean differences between normal (n = 100) and herniated (n = 20) intervertebral disks (difference in T 1 between the groups was 196 millisecond and in T 2 was 15 millisecond). In a subsequent study it was demonstrated that, when matched by age, gender, and occupational risk factors, asymptomatic patients showed a high rate (76%) of disk herniations. This was significantly less than the symptomatic group incidence of 96%. T 1 and T 2 in 22 patients with sciatica severe enough to require a discectomy was compared with T 1 and T 2 in asymptomatic volunteers (controls) who were matched according to age, gender, disk level, and the extent of herniation (protrusion or extrusion). The symptomatic subjects exhibited significantly shorter T 1 and T 2 relaxation times than the matched asymptomatic subjects did.
Recent attention has been focused on MRI T 1ρ relaxation time measurements that have the potential for assessing changes in the extracellular matrix (ECM), particularly proteoglycan loss in the intervertebral disk. In vivo, using different duration spin-locking pulses, T 1ρ -weighted images ( Fig. 4 ) were obtained. Fitting an exponential to the decay of signal with the time of spin-locking (TSL), a T 1ρ map was generated (see Fig. 4 ) and the reproducibility of disk T 1ρ was found to be 4.59%. Studies have demonstrated quantitatively that T 1ρ correlates with proteoglycan content and water loss in the disk. T 1ρ varies between the nucleus and the annulus, with the median T 1ρ value for the nucleus being 116.6 ± 21.4 milliseconds and 84.1 ± 11.7 milliseconds for the annulus, and these values between the nucleus and annulus were found to be significantly different ( P <.05). The correlations between age and T 1ρ relaxation time in the nucleus (r 2 = −0.82, P = .0001) and annulus (r 2 = −0.37, P = .04) were also significant. T 1ρ relaxation times decreased with disk degeneration ( Fig. 5 ), demonstrating the changes with Pfirrmann grade and T 2 ( Fig. 6 ) and showing the correlation to patient-reported physical activity and disability as assessed by clinical questionnaires (short form health survey [SF 36] and Oswestry Disability Index [ODI]).
Related posts:
 Management of Degenerative Disk Disease and Chronic Low Back Pain
Prosthetic Total Disk Replacement—Can We Learn from Total Hip Replacement?
Lumbar Intervertebral Disk Degeneration
Structure and Biology of the Intervertebral Disk in Health and Disease
Tissue Engineering for Intervertebral Disk Degeneration
Stem Cell Regeneration of the Intervertebral Disk
Management of Degenerative Disk Disease and Chronic Low Back Pain
Prosthetic Total Disk Replacement—Can We Learn from Total Hip Replacement?
Lumbar Intervertebral Disk Degeneration
Structure and Biology of the Intervertebral Disk in Health and Disease
Tissue Engineering for Intervertebral Disk Degeneration
Stem Cell Regeneration of the Intervertebral Disk
Stay updated, free articles. Join our Telegram channel

Full access? Get Clinical Tree


