Fig. 9.1
Prospectively triggered scanning. In this mode there is intermittent table motion, triggered by the ECG R-wave of the oncoming beat. Prospective mode is facilitated by a wider detector array. In this case imaging is completed in three heart beats (Courtesy of James P. Earls, MD)
Compared to retrospective ECG-gated coronary CTA scans, prospectively triggered scans markedly reduce effective radiation doses by >50 % in selected patients [15].
Image quality using this acquisition mode is highest when heart rates are <65 bpm and regular. For higher heart rates, an extended acquisition window (“padding”) can be used at the expense of increased radiation [21]. In addition, this scan mode limits the number of phases that can be reconstructed, and does not allow for evaluation of left ventricular ejection fraction.
Wide detector array scanning: Coronary CTA using 320-detector rows (z-axis coverage of up to 16 cm of volumetric data acquisition with a single rotation) allows for single heart-beat imaging in approximately 75 % of patients. The shorter radiation exposure time with wide detector scanning results in total radiation doses in 3–4 mSv range. However, this dose is increased in patients in whom >1 heartbeat is needed for image acquisition [22].
High-Pitch Dual-Source Spiral Scanning (“Flash”): This is a new scanner technology utilizing a novel high-pitch spiral technique and dual-source acquisition to rapidly image the cardiac volume, achieving average doses <1 mSv. Pitch is the ratio of the table speed to the effective detector width, so, in this mode, patients move extremely fast through the scanner (pitch 3.4 vs. 0.2 in conventional scanners) while allowing coronary imaging with a single heart beat (Fig. 9.2). This scan mode requires excellent heart rate control in order to achieve high diagnostic image quality.
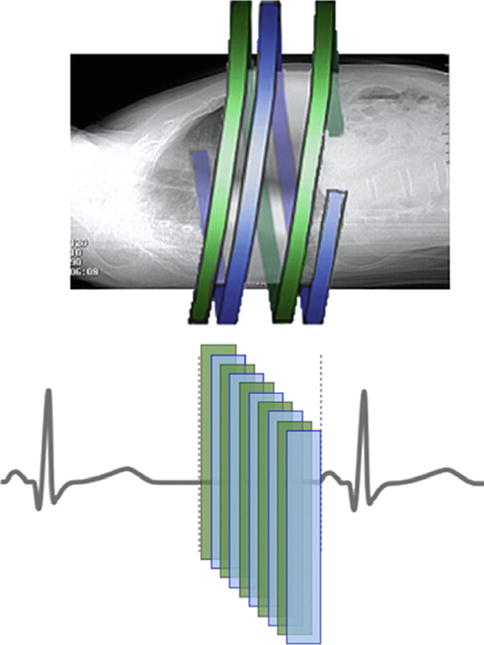
Fig. 9.2
High-pitch spiral scanning. In this mode 2 x-ray tubes and detector arrays rotate around the patient during continuous table motion at a high pitch. Scanning is accomplished during a single heart beat (Courtesy of James P. Earls, MD)
Iterative Reconstruction: This is a novel image reconstruction algorithm that uses the traditional filtered back projection reconstruction to reconstruct raw pixels, then repeatedly reconstructs these images in an iterative way to achieve a computer-derived optimal image. Studies to date have shown that this reconstruction method can significantly reduce image noise, allowing for decreased image acquisition dose, while maintaining or perhaps improving image quality. Best results are obtained by using both FBP and iterative reconstruction (e.g., 40 % iterative reconstruction applied) so to avoid image distortion [23, 24].
Modern coronary CTA scanning protocols that employ combinations of the above radiation dose reduction techniques (e.g., prospective ECG triggering + 100 kV), in addition to limiting the scan range to the minimum volume as feasible, are able to consistently achieve effective radiation doses of <4 mSv in most patients undergoing coronary CTA at our institutions.
The pace of innovation resulting in marked reductions in radiation exposure during coronary CTA has been remarkable and unprecedented [25]:
Recent reports have documented the performance of extremely high-quality coronary CTA studies at <1 mSv, a value that 5 years ago would have not have been thought possible [26].
However, the use of radiation dose reduction techniques may not be uniformly applied and have been shown to vary across institutions, a practice that may be improved with better coronary CTA provider/technician education [25, 27, 28].
To ensure high quality image is performed at the lowest radiation dose allowable requires providers to be appropriately trained, to select patients in whom coronary CTA is an appropriate imaging test, and to follow current guidelines that clearly outline the appropriate performance of coronary CTA.
The Society of Cardiovascular Computed Tomography (SCCT) (http://www.scct.org), in many cases in collaboration with other medical societies, has published detailed guidelines and statements outlining all aspects for appropriate performance of contemporary cardiac CT:
Guidelines for the Performance of Coronary CTA [7]
Guidelines for the Interpretation and Reporting of Coronary CTA [8]
2010 Appropriate Use Criteria for Cardiac Computed Tomography [10]
Guidelines on Radiation Dose and Dose-optimization Strategies in Cardiovascular CT [9]
Standardized Medical Terminology for Cardiac Computed Tomography [29]
Coronary Plaque Characterization and Stenosis Quantification: Accuracy of Cardiac CT Angiography
Coronary Atherosclerosis Visualization and Qualitative Plaque Characterization
Current MDCT scanners achieve an isotropic spatial resolution of approximately 0.4 mm (400 μm), thereby allowing for detailed visualization of even minor degrees of coronary atherosclerotic plaque.
The coronary artery lumen typically achieves high attenuation (typically 200–500 Houndsfield units [HU]), allowing for the identification of the coronary vessel wall and atherosclerotic plaque.
For providers new to coronary CTA, it is first important to recognize the appearance of normal coronary arteries (Fig. 9.3).
Fig. 9.3
(a, b) Normal Coronary Arteries. Curved multiplanar reformatted (MPR) of a normal (a) left anterior descending artery (LAD) and (b) right coronary artery (RCA) showing no evidence of atherosclerosis
Based on the in-plane resolution of 0.4 mm, areas of atherosclerotic plaque are generally defined as tissue structures >1 mm2 within the coronary artery lumen or adjacent to the coronary artery lumen that can be discriminated from surrounding pericardium, fat and the vessel lumen itself.
Coronary artery atherosclerosis can be viewed in general in numerous imaging planes, to include axial, multiplanar reformatted (MPR), as well as in curved multiplanar reformatted (cMPR) images (Fig. 9.4).
Fig. 9.4
(a–i). Different types and visualization of coronary plaques by computed tomography (Adapted with permission of Elsevier from Voros et al. [4])
Coronary plaque is broadly classified based on the presence and relative amount of calcification (Figs. 9.4 and 9.5) [29]:
Fig. 9.5
(a–c) Curved multiplanar reformatted (cMPR) images demonstrating (a) a severe stenosis (arrow) in the mid LAD due to non-calcified plaque, (b) a partially calcified plaque in the mid LAD (block arrow) causing mild stenosis and (c) a purely calcified plaque (*) in the distal LAD causing minimal stenosis
Non-calcified plaque: entire plaque contains no calcium density
Partially-calcified plaque: plaque contains two visible plaque components, one of which is calcified
Calcified plaque: plaque appears entirely calcified.
Terms used to describe plaques, such as “soft,” “lipid-rich,” “fibrous,” “hard,” and “mixed” are not recommended as these terms are imprecise and may erroneously imply histologic plaque compositional changes that can typically not be discerned using coronary CTA [29].
Figure 9.6 demonstrates the appearance of coronary atherosclerosis at various stages, from early lipid deposition to advanced, calcified atherosclerosis.
Fig. 9.6
(a–l) Stages of Atherosclerosis. Schematic representation of the progression of atherosclerosis is shown in the top row (green: lumen; red: non-calcified plaque; white: calcified plaque), with corresponding CTA cross-sectional images in the bottom row. A normal vessel is shown in (a, b). Early lipid deposition with minimal wall thickening is shown in (c, d). More advanced lipid deposition with non-calcified plaque and positive remodeling is demonstrated in (e, f). Complex plaque with lipid deposition, calcification and significant positive remodeling is represented in (g, h). More positive remodeling, more extensive calcification with minimal non-calcified plaque is shown in (i, j). Final stages of calcification, fibrosis, negative remodeling and luminal stenosis is illustrated in (k, l)
In a sentinel study by Leber et al. and demonstrated recently in a review of 14 studies involving 340 patients who underwent both CCTA and intravascular ultrasound (IVUS), CCTA is highly accurate as compared to IVUS in its ability to identify and properly classify coronary arterial segments and/or plaque as normal, calcified, mixed and non-calcified [30, 31].
Similarly, Pundziute et al. [32] evaluated the accuracy and correlation of qualitative plaque characterization to intravascular ultrasound (IVUS). They demonstrated that the three different types of plaque described above had significantly different composition when assessed using intravascular ultrasound with radiofrequency backscatter analysis (“virtual histology”):
Importantly, they demonstrated that thin-cap fibroatheromas (TCFA) were more commonly seen in partially calcified plaques (32 %; p = 0.002) as compared to non-calcified (13 %) and calcified plaques (8 %).
Qualitative characterization of coronary plaques by CTA, with IVUS with radiofrequency backscatter analysis correlation, is demonstrated in Fig. 9.7.
Fig. 9.7
(a–f) Qualitative characterization of coronary plaques by CTA, with IVUS/VH correlation. Predominantly calcified plaque on CTA (d) shows mostly calcium on IVUS/VH (a). Partially calcified coronary plaque on CTA (e) shows a combination of fibrous, fibro-fatty tissue, necrotic core and calcium on IVUS/VH (b). Non-calcified plaque on CTA (a) shows no calcium on IVUS/VH (c)
Semi-Quantitative Assessment of Coronary Atherosclerosis: Lumen Stenosis
Original studies evaluating the accuracy of CCTA compared to invasive coronary angiography (ICA) typically used a binary approach, classifying lumen stenoses as <50 or ≥50 % (possible flow-limiting) to guide clinical management. Most studies were initially from single centers involving highly experienced CCTA readers.
In a review of 23 single-center studies comparing 64-row coronary CTA to invasive angiography in 2,045 patients, the per-patient pooled sensitivity for significant (≥50 %) native coronary artery stenosis was 98 % (range 88–100 %), pooled specificity was 88 % (range 59–100 %) and per-patient negative predictive value (NPV) >95 % [33].
Several multicenter studies have since been reported demonstrating similar test performance [34–36].
In a recent meta-analysis that included 89 accuracy studies involving 7,516 patients in whom both coronary CTA and invasive angiography were performed, including those from the three large multi-center accuracy trials, >16-slice coronary CTA had a per-patient sensitivity of 98 % and specificity of 89 %, the highest reported such test characteristics of currently available non-invasive tests for coronary artery disease [37].
Based on the impressive sensitivity and specificity of modern coronary CTA, across multiple centers, consistent with current Appropriate Use Criteria, the most common utilization of coronary CTA is for the evaluation and exclusion of potentially flow-limiting (obstructive) coronary artery stenoses in patients with symptoms of possible angina who: (1) do not have known coronary artery disease; and (2) are at low or intermediate pre-test risk for obstructive coronary disease (Tables 9.1 and 9.2) [10].
Table 9.1
Detection of CAD in symptomatic patients without known heart disease
Indication
Nonacute symptoms possibly representing an ischemic equivalent
Pretest probability of CAD
Low
Intermediate
High
1.
ECG interpretable AND
U (5)
A(7)
I(3)
Able to exercise
2.
ECG uninterpretable OR
A(7)
A(8)
U(4)
Unable to exercise
Acute symptoms with suspicion of ACS (urgent presentation)
3.
Definite MI
I(1)
4.
Persistent ECG ST-segment elevation following exclusion of MI
U(6)
5.
Acute chest pain of uncertain cause (differential diagnosis includes pulmonary embolism, aortic dissection, and ACS) (“triple rule out”)
U(6)
Pretest probability of CAD
6.
Normal ECG and cardiac biomarkers
A(7)
A(7)
U(4)
7.
ECG uninterpretable
A(7)
A(7)
U(4)
8.
Nondiagnostic ECG OR
A(7)
A(7)
U(4)
Equivocal cardiac biomarkers
Table 9.2
Use of CTA in the setting of prior test results
Indications
Prior ECG exercise testing
20.
Prior normal ECG exercise test
A(7)
Continued symptoms
Duke Treadmill Score – Risk Findings
Low
Intermediate
High
21.
Prior ECG exercise testing
I(2)
A(7)
I(3)
Sequential testing after stress imaging procedures
22.
Discordant ECG exercise and imaging results
A(8)
Test Result/Ischemia
Equivocal
Mild
Mild or Severe
23.
Prior stress imaging procedure
A(8)
U(6)
I(2)
Prior CCS
24.
Zero CCS > 5 year ago
U(4)
25.
Positive CCS > 2 year ago
I(2)
CCS
<100
100–400
401–1,000
>1,000
26.
Diagnostic impact of coronary calcium on the decision to perform contrast CTA in symptomatic patients
A(8)
A(8)
U(6)
U(4)
Asymptomatic OR stable symptoms periodic repeat resting in the setting of prior stress imaging or prior coronary angiography
Last study done
<2 year ago
≥2 year ago
27.
No known CAD
I(2)
I(3)
28.
Known CAD
I(2)
I(3)
Evaluation of new or worsening symptoms in the setting of past stress imaging study
Previous stress imaging study
Normal
Abnormal
29.
Evaluation of new or worsening symptoms
A(8)
U(6)
Clinically, a standard review of coronary CTA images and subsequent report generation requires the systematic assessment of each of the 18-segments of the coronary artery tree (Fig. 9.8) for the presence and type of plaque (as described earlier), as well as for the semi-quantitative assessment of lumen diameter stenosis [8].
Fig. 9.8
Society of cardiovascular computed tomography coronary segmentation diagram. Dashed lines represent division between RCA, LAD, and LCx and the end of the LMPLB = PLV (posterior left ventricular branch). Additional nomenclature may be added, for example: D3, R-PDA2, SVG (saphenous vein graft), mLAD (Reproduced with permission of Elsevier from Raff et al. [8])
Segment
Abbreviation
Description
Proximal RCA
pRCA
Ostium of the RCA (right coronary artery) to one-half the distance to the acute margin of heart
Mid RCA
mRCA
End of proximal RCA to the acute margin of heart
Distal RCA
dRCA
End of mid RCA to origin of the PDA (posterior descending artery)
PDA-RCA
R-PDA
PDA from RCA
PLB-RCA
R-PLB
PLB (posterior-lateral branch) from RCA
LM
LM
Ostium of LM (left main) to bifurcation of LAD (left anterior descending artery) and LCx (left circumflex artery)
Proximal LAD
pLAD
End of LM to the first large septal or D1 (first diagonal), whichever is most proximal
Mid LAD
mLAD
End of proximal LAD to one-half the distance to the apex
Distal LAD
dLAD
End of mid LAD to end of LAD
Diagonal 1
D1
First diagonal branch D1
Diagonal 2
D2
Second diagonal branch D2
Proximal LCx
pCx
End of LM to the origin of the OM1 (first obtuse marginal)
OM1
OM1
First OM1 traversing the lateral wall of the left ventricle
Mid and distal LCx
LCx
Traveling in the AV groove, distal to the first obtuse marginal branch to the end of the vessel or Origin of the L-PDA (left posterior descending artery)
OM2
OM2
Second marginal OM2
PDA-LCx
L-PDA
PDA from LCx
Ramus intermedius
RI
Vessel originating from the left main between the LAD and LCx in case of a trifurcation
PLB-L
L-PLB
PLB from LCx
While binary approaches have been utilized in many studies assessing the accuracy of coronary CTA, current guidelines recommend the following semi-quantitative scale in describing lumen stenoses [8]:
Normal: absence of plaque and no luminal stenosis
Minimal: plaque with <25 % diameter lumen stenosis
Mild: 25–49 % stenosis
Moderate: 50–69 % stenosis
Severe: 70–99 % stenosis
Occluded
There are several variables inherent to coronary CTA that may, in some cases, limit the precise correlation of percent stenosis (and other more quantitative plaque measures discussed next) to that seen on invasive coronary angiography (ICA) and other invasive imaging modalities of plaque, such as IVUS:
Technical performance: Coronary CTA currently has reduced temporal (85–165 ms) and spatial resolution (0.4 mm) compared to ICA (8 ms and 0.22 mm).
Coronary calcification: Due to partial volume effects, it “blooms” and appears larger on coronary CTA, often partially obscuring the surrounding coronary lumen.
Increased plaque visualization and coronary remodeling using coronary CTA: As compared to ICA, coronary CTA more fully visualizes the true extent of coronary atherosclerosis, including that lining or only involving the coronary artery wall and in areas of positive remodeling which can lead to overestimation of degree of stenosis when measuring stenosis in positively remodeled areas (instead of compared to reference normal areas as is done in ICA) (Fig. 9.9) [38].
Fig. 9.9
(a–c) Coronary artery lesion in a 53 year-old woman. (a) Cross-sectional CCTA image suggests a high-grade lesion with a large non-calcified plaque (large arrows) and a small remaining vessel lumen (small arrow). (b) Longitudinal display demonstrates significant positive remodeling (expansion of the vessel diameter; arrows). (c) Consequently, the degree of luminal narrowing appears less than suggested on cross-sectional display (Reproduced with permission of Elsevier from Achenbach [12])
Accuracy in Coronary Artery Bypass Grafts
The accuracy of CCTA in detecting coronary artery bypass graft stenoses is impressive and related to the increased vessel diameter of most bypass grafts and their relative lack of motion compared to native coronary arteries (Fig. 9.10). Sensitivity for bypass graft stenosis is >97 % and specificity 94–98 % in published series, with limitations mainly at anastomosis sites involving calcification and surrounding surgical clips [39].
Fig. 9.10
Curved MPR of saphenous vein graft to the LAD demonstrating an area of stenosis due to non-calcified plaque in the proximal graft (arrow). The anastomoses site is patent (block arrow). The native LAD is severely diseased proximal to the graft anastomoses (*)
Quantitative Plaque Characterization
The semi-quantitative assessment of lumen stenosis severity is the most clinically valued information by providers and symptomatic patients who undergo coronary CTA. In most patients who undergo coronary CTA, significant coronary stenosis can be convincingly excluded and other causes of their symptoms perhaps evaluated, thereby avoiding invasive coronary angiography or further testing. Based on its excellent test accuracy, this approach may be clinically efficient and cost effective in both the outpatient [40, 41] and emergency department settings [42].
However, as a three-dimensional imaging technique, coronary CTA may also provide for more advanced measures of plaque burden and vessel lumen geometry that typically would only be available using intravascular ultrasound (IVUS). These include such measures as plaque volume, plaque area, percent area stenosis, vessel minimal lumen area, as well as measures of vessel remodeling, such as the remodeling index.
Numerous studies have been published documenting the reproducibility and accuracy of these measures as compared to IVUS.
Reproducibility
Manual measurement of individual plaque volume, plaque area and lumen areas requires meticulous measurement using high-quality coronary CTA datasets (Fig. 9.11).
Fig. 9.11
(a–d) Figure demonstrating technique for measuring plaque areas (PAs). PAs were manually traced and volume calculated by multiplying PA by the reconstruction increment. (a) First, outer vessel contour (border to low-signal epicardial fat) was traced to calculate the cross-sectional area (CSA). (b) CSA of the lumen was manually traced. (c) PA was calculated by subtracting the luminal area from the CSA (PA = CSA – LA = 25 mm2). (d) Calculation performed for each of the reconstructed 1-mm sections and summed to obtain the total plaque volume (Reproduced with permission from Schmid et al. [77])
Hoffman et al. reported reproducibility data for total plaque volume in 20 patients, showing limits of agreement were approximately 60 % for small plaques (10 mm3) and 28 % for larger volumes (100 mm3) [43].
Cheng et al. examined intraobserver, interobserver, and interscan variability in 89 proximal segments in 30 patients using manual delineation of calcified and noncalcified components. They demonstrated that there was relatively good correlation between observers and mean measurement differences were small. However, limits of agreement were wide (20–269 %) for the measurement of total and noncalcified plaque volumes [44].
Others have also shown relatively good reproducibility, mainly in noncalcified lesions with best reproducibility in the left anterior descending artery [45, 46].
Voros and colleagues [47] recently demonstrated that interobserver reliability of vessel and plaque measurements may be significantly improved through the use of standardized, automated software (Figs. 9.12, 9.13, and 9.14). In this study, mean differences for lumen geometric measures such as the minimum luminal diameter and minimum luminal area were small (0.45 and 0.43 %, respectively), and the limits of agreement significantly improved (±11.8 and ±18.5 %, respectively).
Fig. 9.12
(a–e) Steps of quantitative analysis. (a) Shows the curved multi-planar reformat (MPR) of the artery. (b) Illustrates the creation of the centerline. (c) Shows the placement of the luminal boundary, and (d) Illustrates the fitting of the vessel boundary, based on geometrical assumptions and Hounsfield-unit based segmentation. (e) Illustrates the segmentation of the lumen as well as the vessel wall
Fig. 9.13
(a–d) Qualitative (top row) and quantitative (bottom row) stenosis quantification. A normal segment in the proximal RCA is shown in (a). Mild, moderate and severe stenoses are illustrated in the proximal LAD in (b–d) respectively. DS = diameter stenosis. AS = area stenosis
Fig. 9.14
(a–h) Inter-rater reliability for calcified, non-calcified, low-density non-calcified and high-density non-calcified plaque. Plaque segmentation between different observers is shown in the image (Observer 1: top row; Observer 2: bottom row). Bland-Altman plots for the volume (top row) and percentage (bottom row) confirm no significant difference between observers, with very narrow limits of agreement, confirming excellent inter-observer reproducibility (Reproduced with permission of Elsevier from Voros et al. [4])Related posts:
 Insights into the Natural History of Atherosclerosis Progression
 Positron Emission Tomography: Imaging Inflammatory Atherosclerosis
 Factors Contributing to the Development of Atherosclerosis
 Auscultation and Atherosclerosis
 Intravascular Ultrasound
 Noncontrast Cardiac CT for the Detection of Calcified Atherosclerosis

Stay updated, free articles. Join our Telegram channel

Full access? Get Clinical Tree


