Fig. 17.1
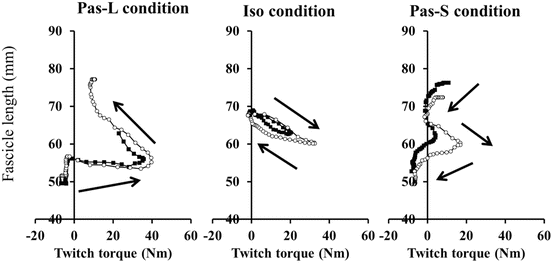
Typical examples of fascicle length changes during twitch contractions
After a twitch contraction was elicited, maximal-voluntary isometric plantar flexion was performed for six seconds as a conditioning contraction. The contraction intensity and the duration of the conditioning contraction were identical for the three conditions. Ten seconds after completing the conditioning contraction, a twitch contraction was elicited again to calculate the relative change in twitch torque (i.e., the extent of PAP). Each condition was randomly performed, and the conditions were provided at >10-min intervals to prevent any influence by the conditioning contraction on subsequent trials.
Experimental Setup
The subjects were positioned on an isokinetic dynamometer (CON-TREX, CMV AG, Switzerland) with the right knee and hip joints fully extended, and the right foot fixed to the dynamometer’s footplate. The right thigh was fixed to the dynamometer’s bench with a non-elastic strap. The center of rotation of the footplate was visually aligned with the center of the subject’s ankle joint. The anatomical position of the ankle joint was defined as 0°. The ankle joint range of motion during passive movement was set from −20° (dorsiflexion) to 30° (plantar flexion). The angular velocity of the passive movement was set at 120°/s during Pas-S and at −120°/s during Pas-L.
The posterior tibial nerve was stimulated percutaneously to evoke a twitch contraction of the plantar flexors with a single stimulation pulse. A cathode (11 mm diameter) was placed over the popliteal fossa, and an anode (40 × 50 mm) was placed over the ventral aspect of the thigh near the patella. Single rectangular pulses of 500 μs were delivered from a high-voltage stimulator (SEN-3301; Nihon Kohden, Tokyo, Japan) with an isolator (SS-1963; Nihon Kohden). The stimulus intensity for each subject was determined prior to the experiment by increasing the voltage until the corresponding isometric twitch torque at 0° reached a plateau, and an intensity of 20 % above the maximal voltage was adopted for all trials.
To control the timing of electrical stimulation during Pas-S and Pas-L, the ankle joint angle was recorded with programming software at a sampling frequency of 4 kHz (Labview, National Instruments, Austin, TX, USA). The timing of electrical stimulations was adjusted for each subject to match the occurrence of the peak torque during twitch contractions. The peak torque during a twitch contraction was confirmed to occur at 0° in all trials.
The muscle fiber’s length (i.e., fascicle length) of the medial gastrocnemius (MG) was recorded during the elicited twitch contraction using an ultrasound device (SSD-6500, Aloka, Tokyo, Japan) with a linear-probe array (7.5 MHz, Aloka, Tokyo, Japan). The ultrasonographic image was recorded at a sampling frequency of 96 Hz. The fascicle length was measured as the distance from the intersection of the superficial aponeurosis and fascicle to the intersection of the deep aponeurosis and fascicle using Image J software (National Institutes of Health, MD, USA).
Measurements
The peak torque during twitch contractions was determined as the twitch torque. The relative change of these values were calculated with the following equation: Relative change (%) = (value recorded after the conditioning contraction / value recorded before the conditioning contraction) × 100.
The fascicle shortening velocity during the twitch contraction elicited before the conditioning contraction was calculated by dividing the fascicle shortening distance from the onset of torque development to the occurrence of peak torque by the time required (Fig. 17.1). In addition, the mean fascicle length over the same interval was also calculated.
Statistics
Descriptive data are presented as mean ± SD. A one-way analysis of variance (ANOVA) with repeated measures was used to test differences in the relative change in twitch torque (i.e., the extent of PAP), fascicle shortening velocity, and mean fascicle length under the three conditions (Iso, Pas-S and Pas-L). If there was a significant main effect, a post-hoc test with a Bonferroni correction was used. The significance was set at p < 0.05 level.
17.2.3 Results
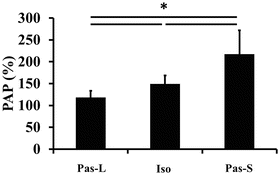
A significant main effect was found for the extent of PAP between the three experimental conditions (F value = 50.501, p < 0.001, Fig. 17.2). Additional analysis showed that the extent of PAP during Iso was significantly smaller than that during Pas-S, and significantly larger than that during Pas-L, respectively (p < 0.05).


Fig. 17.2
The extent of postactivation potentiation (PAP) during the three conditions. Data are shown as mean ± SD. Pas-L passive lengthening condition, Iso isometric condition, Pas-S passive shortening condition. * Significant difference between conditions (p < 0.05)
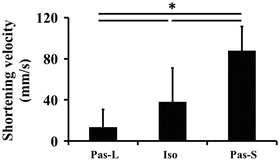
There was a significant main effect in the fascicle shortening velocity of the MG during twitch contractions (F value = 50.056, p < 0.001, Fig. 17.3). The fascicle shortening velocity during Iso was significantly smaller and larger than during Pas-S and Pas-L, respectively (p < 0.05).


Fig. 17.3
Fascicle shortening velocity during the three conditions. Data are shown as mean ± SD. Pas-L passive lengthening condition, Iso isometric condition, Pas-S passive shortening condition. * Significant difference between conditions (p < 0.05)
Typical fascicle behavior during twitch contractions is shown in Fig. 17.4. The MG fascicle length during twitch contractions elicited before the conditioning contraction was 52.6 ± 7.0 mm in Pas-L, 58.8 ± 6.6 mm in Iso, and 65.5 ± 8.3 mm in Pas-S. A significant main effect was found between conditions (F value = 39.128, p < 0.001), and post-hoc analysis showed that the mean fascicle length was significantly shorter during Pas-L than Pas-S (p < 0.05, Table 17.1).


Fig. 17.4
Exemplary fascicle behavior during twitch contractions. Black squares indicate fascicle behavior during twitch contraction elicited before the conditioning contraction. White circles indicate fascicle behavior during twitch contraction elicited after the conditioning contraction. Pas-L passive lengthening condition, Iso isometric condition, Pas-S passive shortening condition
Table 17.1
Mean fascicle length of medial gastrocnemius during twitch contractions
Fascicle length (mm) | ||||||||
|---|---|---|---|---|---|---|---|---|
Pas-L* | Iso | Pas-S | ||||||
52.6 | ± | 7.0 | 58.8 | ± | 6.6 | 65.5 | ± | 8.3 |
17.2.4 Discussion
The main purpose of this study was to examine the influence of the shortening velocity of muscle fibers on PAP. Although the conditioning contraction was similar, the extent of PAP was different among the three conditions. As the fascicle shortening velocity during twitch contractions increased, the extent of PAP also increased. These results indicate that the extent of PAP is related to shortening velocity of muscle fibers during twitch contractions.
The extent of PAP was larger during Pas-S than Iso or Pas-L. These results are in line with the report of Babault et al. (2008) where the extent of PAP was largest during a passive shortening condition. These authors also suggested that eccentric contractions, unlike concentric contractions, are not potentiated by a conditioning contraction, based on the relationship between joint angular velocity and the extent of PAP. However, the type of muscle contraction (i.e., isometric, concentric, or eccentric) as estimated from joint angle changes, is not identical to the type of muscle fibers contraction due to muscle-tendon interactions (Fukashiro et al. 1995; Ichinose et al. 2000). In fact, even during Pas-L, the fascicle length decreased in the present study (Fig. 17.1). With this result, we can assume that the extent of PAP is larger when muscle fibers shorten at a faster velocity, as seen during Pas-S in the current results. Thus the conclusion by Babault et al. (2008) that suggested the extent of PAP was contraction-type dependent (smaller during eccentric than concentric contractions), might be due to differences in shortening velocity of the muscle fibers.
To understand why the extent of PAP was the largest during Pas-S, the mechanism of PAP needs to be considered. As described earlier, an increase in twitch force/torque by a conditioning contraction is related to the MLCP (MacIntosh et al. 2012). Once a myosin regulatory light chain is phosphorylated, actin-myosin interactions are facilitated, causing an increase in twitch torque (Sweeney et al. 1993). Thus, the effect of MLCP should be small when the actin-myosin interaction is already sufficiently high without a conditioning contraction. Indeed, electrically-evoked maximal isometric force has been shown not to increase after a conditioning contraction (Vandenboom et al. 1993). However, if the actin-myosin interaction differs among various shortening velocity conditions, the extent of PAP should also be different. Piazzesi et al. (2007) reported that as the shortening velocity of muscle fibers increased, the number of attached cross bridges decreased. Therefore, facilitation of actin-myosin interactions induced by MLCP would have a stronger effect when muscle fibers shorten faster, thereby causing a larger increase in the twitch torque during the Pas-S condition. Taking this into account, the maximal-voluntary concentric torque may be increased by a conditioning contraction if the shortening velocity of muscle fibers is large. Even during a maximal-intensity (maximal stimulation frequency) contraction, muscle force decreases as the shortening velocity of muscle fibers increases (Hill 1938), which is well known as the force-velocity relationship. As described above, the mechanism underlying this decrease in force is considered to be a decrease in the number of attached cross bridges (Piazzesi et al. 2007). Therefore, a conditioning contraction (facilitating the formation of attached cross bridges) can substantially enhance a subsequent maximal-intensity contraction because many cross bridges would not attach to actin filaments.
Stay updated, free articles. Join our Telegram channel

Full access? Get Clinical Tree


