Biomechanics of Hip Reconstruction
Maureen K. Dwyer
Introduction
Understanding the biomechanics of the hip joint has advanced both the diagnosis and treatment of hip joint disorders. The goal of any biomechanical analysis is to assess an individual’s functional capabilities and the influence of impairments on joint function. Data obtained from these analyses can be used to identify new treatment strategies, advance current treatment strategies, or identify appropriate postoperative rehabilitation programs to address persistent impairments. A comprehensive biomechanical analysis should include measures of both motion and force. Kinematics is the study of angular or translational motion of the hip joint during function and is measured through the use of optoelectric camera systems. Kinetics is the study of forces and moments acting on the joint to create motion. These forces include those due to gravity, muscle contraction, and passive tension created by the supporting static structures of the joint. Forces are often estimated using data obtained by force platforms while subjects perform functional activities, as well as anatomic estimates of muscle size, shape, and activation patterns during these activities. Measurement of kinematic and kinetic parameters can detect impairments that are not recognized with clinical tests or patient-reported outcome measures.
Hip Joint Forces
In Vivo Measurement of Hip Joint Forces
The forces encountered by the hip joint during the performance of functional activities play an important role in the health and longevity of both the natural and reconstructed joint. Quantitative measurement of these forces can be utilized to assess implant fixation and wear, to modify implant design, and to guide activity recommendations following surgery. Direct measurement of the forces acting upon the joint is not possible in the intact joint. However, the development of prostheses and endoprostheses instrumented with strain gauges has allowed for the measurement of in vivo forces and contact pressures applied to the hip joint during function after surgery. Early investigations using these prostheses revealed peak hip joint forces during gait of 300% body weight (BW) (1). Advances in both the instrumented prosthetic design as well as computational methods have resulted in more comprehensive analyses of in vivo joint function during a wide array of activities of daily life and rehabilitation exercises.
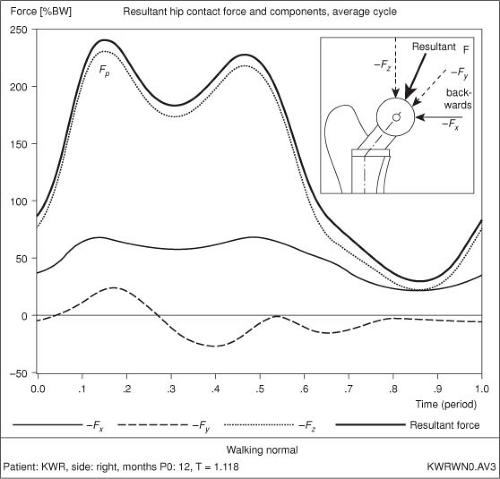
The magnitude of the peak resultant forces acting upon the hip joint varies greatly depending on the functional activity being performed (Table 10.1). Peak forces during gait have been reported to vary between 200% and 480% body weight, with higher forces reported for increased gait velocities (2,3,4,5). The majority of the peak joint contact force occurs in the superior direction and has two peaks (Fig. 10.1). The first peak occurs at contralateral toe off, whereas the second occurs just prior to contralateral heel strike. The magnitude of the two peaks is similar, and has been reported to be 240% body weight for the first resultant peak and 237% body weight for the second resultant peak (6). Similar peak forces were reported during single limb
stance (230% to 350% body weight) (2,5), while reduced peak forces were observed during chair rise (190 to 200% body weight) (2), chair decline (156% body weight) (2), and knee bend (143% body weight) (2) compared to gait. However, stair climbing resulted in higher peak joint forces, with values exceeding 500% of body weight during both stair ascent and descent (7). Peak forces during stair climbing were reported to be higher at 8 months when compared with 1 to 3 years postsurgery, and may indicate improved muscle function and improved biomechanics over time. No common daily activity resulted in peak forces with as great a magnitude as that observed during incidental stumbling, which could be upwards of 900% body weight (4). Counseling patients on avoiding unsafe activities, especially during the early postoperative phase, may assist with achieving proper implant fixation and extending longevity.
stance (230% to 350% body weight) (2,5), while reduced peak forces were observed during chair rise (190 to 200% body weight) (2), chair decline (156% body weight) (2), and knee bend (143% body weight) (2) compared to gait. However, stair climbing resulted in higher peak joint forces, with values exceeding 500% of body weight during both stair ascent and descent (7). Peak forces during stair climbing were reported to be higher at 8 months when compared with 1 to 3 years postsurgery, and may indicate improved muscle function and improved biomechanics over time. No common daily activity resulted in peak forces with as great a magnitude as that observed during incidental stumbling, which could be upwards of 900% body weight (4). Counseling patients on avoiding unsafe activities, especially during the early postoperative phase, may assist with achieving proper implant fixation and extending longevity.
Table 10.1 Average In Vivo Hip Joint Contact Forces and Peak Torsional Implant Moments Measured during Activities of Daily Life | |||||||||||||||||||||||||||||||||
|---|---|---|---|---|---|---|---|---|---|---|---|---|---|---|---|---|---|---|---|---|---|---|---|---|---|---|---|---|---|---|---|---|---|
|
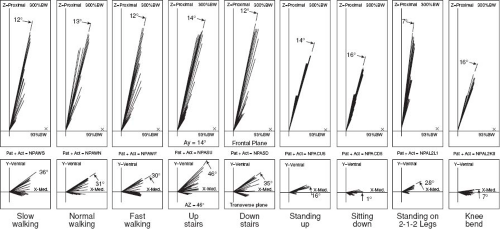
The angular direction of the resultant force in the frontal plane varied little between functional activities, with smaller frontal plane forces observed as medial deviation increased (Fig. 10.2). In contrast, the angle of the force in the transverse plane was highly variable and increased as the magnitude of the resultant force increased. For stair climbing, the direction of the resultant force in the transverse plane was 10 to 16 degrees more anterior than walking. This coincided with a 23% increase in the torsional moment about the long axis of the implant during stair ascent compared to gait, whereas peak torsional moments for all other activities were comparable to gait (Table 10.1). Given the high joint forces and torsional moments produced, stair climbing may compromise implant fixation.
Understanding joint function during rehabilitation exercises is essential to identifying appropriate exercises to improve muscle and joint function while protecting the implant from potential large forces and pressures during healing. Measures of peak acetabular contact pressures have been documented while patients performed activities of daily life as well as common rehabilitation exercises (8,9,10,11,12) (Table 10.2). During gait, maximum contact pressures ranged from 3.6 to 6.8 MPa and were observed along the superior and posterior acetabular surfaces (10,11). Contact pressures peaked between heel strike and midstance, and were found to relate to both the vertical ground reaction force as well as muscle contraction (11). For the hip abductor muscles, increases in electromyographic (EMG) activation levels occurred concurrently with increases in acetabular contact pressure. During rehabilitation exercises, peak contact pressures ranged from 1.9 to 4.8 MPa. Active muscle strengthening exercises resulted in reduced contact pressures when compared to isometric strengthening exercises. Increases in peak pressures were associated with the rate of exercise, as well as the amount of external load applied during exercise, both of which can be controlled in a rehabilitation setting. The highest overall peak pressures were observed during chair rising and stair climbing. Successful completion of these activities requires coordination and co-activation of a
number of muscle groups. As a result, lower-body functional exercises impose greater pressures on the joint surfaces and should be delayed following joint surgery.
number of muscle groups. As a result, lower-body functional exercises impose greater pressures on the joint surfaces and should be delayed following joint surgery.
Table 10.2 Average Peak Acetabular Contact Pressures Activities of Daily Life and Rehabilitation Exercises | ||||||||||||||||||||||||||||||
|---|---|---|---|---|---|---|---|---|---|---|---|---|---|---|---|---|---|---|---|---|---|---|---|---|---|---|---|---|---|---|
|
In vivo analyses provide a direct measure of contact forces on the hip joint; however, interpretation of these findings must be done with caution. Due to the complexity of these analyses, application of the instrumented prostheses can only be performed on a small number of patients. As a result, all studies reported a high degree of variation between subjects, due to such variables as gait pattern, time from surgery, and altered muscle function. In addition, these patients are of older age and some report the presence of functional limitations. As age and functional impairments have been shown to affect gait parameters, the values measured during instrumented functional analyses may not accurately represent the magnitudes and/or direction of forces incurred by the native joint. Values collected while subjects were in the early postoperative time period may be fraught by pain and lasting impairments from surgery. As muscle and joint motion impairments have been shown to persist following arthroplasty, time from surgery may play a role in the variability of the force measurements.
Analytical Models of Joint Force Estimates
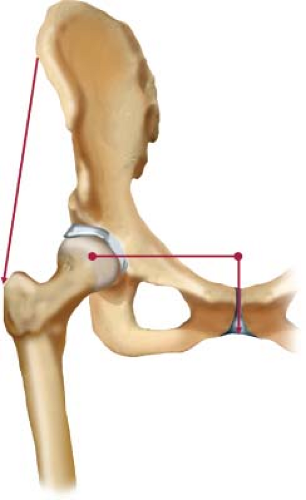
Early estimates of hip joint forces were performed using two-dimensional free-body diagrams during static single limb loading (13,14) (Fig. 10.3). In this position, equilibrium within the system is achieved by the balance of forces and moments acting upon the joint with the reaction force produced by the joint. The external forces acting on the femoral head include the gravitational force, roughly five-sixths of body weight, along with the forces produced by muscles. In these early models, the muscle forces were limited to those controlling frontal plane motion—the hip abductor muscles. The moment arm of the abductor muscles is roughly one-third the length of the moment arm of the gravitational force, thereby giving the force of body weight a 2:1 mechanical advantage over the abductor muscles (15). This requires the abductor muscles to generate a force of approximately twice the body weight to maintain neutral pelvic alignment in single limb stance (16). A major influence on the magnitude of the joint reaction force is the ratio of the lever arm of the hip abductor muscle force to the lever arm of the gravitational force. Increasing the abductor moment arm will reduce this ratio and lessen the reaction
force of the femoral head on the acetabulum. Changes in the muscle tendon insertion location as well as coronal plane motion will alter the mechanical arm of the abductor muscles. Specifically, lateral and superior placement of the hip abductor muscle insertion increases the moment arm length, whereas medial and inferior movement of the muscle insertion reduces the moment arm for single limb stance (17). For surgical approaches which require reattachment of these muscles, proper location is critical to restoring an effective mechanical ratio and minimizing joint reaction forces.
force of the femoral head on the acetabulum. Changes in the muscle tendon insertion location as well as coronal plane motion will alter the mechanical arm of the abductor muscles. Specifically, lateral and superior placement of the hip abductor muscle insertion increases the moment arm length, whereas medial and inferior movement of the muscle insertion reduces the moment arm for single limb stance (17). For surgical approaches which require reattachment of these muscles, proper location is critical to restoring an effective mechanical ratio and minimizing joint reaction forces.
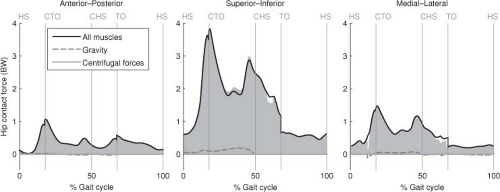
To calculate joint forces and muscle moments during dynamic activities, computational models can be used to estimate joint forces using measurements obtained through motion analysis—joint position, ground reaction forces, segment mass, muscle geometry, and inertial properties (18


Stay updated, free articles. Join our Telegram channel

Full access? Get Clinical Tree


